
10
Evaluating Results
The controversies surrounding the management of PCB-contaminated sediments, especially sediments with high concentrations of PCBs and large volumes of sediments, have been intense. In part, these controversies have arisen because of a lack of evaluation of the effectiveness of management options that have been applied in large pilot studies or at full-scale contaminated sites. Fortunately, in the past 2 years, there has been progress in the evaluation of some aspects of remediation efforts at several sites.
This chapter presents the rationale for an effective evaluation program, drawing on the overall recommendations for evaluating the suggested framework (Chapter 3). The chapter also describes the committee’s reviews of some of the recent evaluations conducted for selected remediation sites and then presents its conclusions and recommendations. The actual details of all aspects of site monitoring are not presented in this chapter, because there have been several excellent reports and reviews about the nature of monitoring in general (e.g., NRC 1997), methodologies for PCB analyses (Appendix F and Chapter 6), and biological effects measurements (Appendix G and Chapter 6).
FRAMEWORK GUIDANCE
In its report Framework for Environmental Health Risk Management, the Presidential/Congressional Commission on Risk Assessment and Risk Man-
agement stresses the need for an evaluation of any risk-management strategy. An evaluation provides the decision-makers and other affected parties with valuable information, including the following:
-
Whether the actions are successful, whether they accomplish what was intended, and whether the predicted benefits and costs are accurate.
-
Whether any modifications are needed to the risk-management strategy to improve success.
-
Whether any new information has emerged that indicates a decision or stage of the framework should be revisited and possibly revised.
-
Whether the framework process is effective and how the involvement of the affected parties contributes to the outcome.
-
What lessons can be learned to guide future risk-reduction strategies at PCB-contaminated sites to improve the decision-making process.
The framework (Chapter 3) identifies several information tools that will assist in the evaluation process: environmental monitoring, health monitoring, research, disease surveillance, analyses of costs and benefits, and discussions with affected parties.
Of particular relevance to the committee’s charge to develop a risk-based framework are learning lessons from the past and ongoing remedial actions. It is difficult to build consensus among affected parties on how to proceed with future remedial actions when there is a lack of information about the effectiveness, costs, and risks of risk-management strategies that have already be implemented. Thus, it is crucial that information gained from the few evaluations of remedial actions for PCB-contaminated sediments that have been conducted be thoroughly and impartially assessed in a process that involves all affected parties. As the commission (1997) notes,
In the past, evaluation, when conducted, has been performed by the regulatory authority itself. As with other stages of the risk management process, evaluation will benefit if stakeholders are involved, helping to:
-
Establish criteria for evaluation, including the definition of ‘success.’
-
Assure the credibility of the evaluation and the evaluators.
-
Determine whether an action was successful.
-
Identify what lessons can be learned.
-
Identify information gaps.
-
Determine whether cost and benefit estimates made when evaluating the risk management options were reasonable.
REVIEWS OF EVALUATIONS OF REMEDIAL ACTIONS
Among the reviews of remedial actions at PCB-contaminated-sediment sites that have been conducted over the last several years by various organizations, two studies were recently completed—General Electric (2000) and Scenic Hudson (2000). The General Electric report lists 54 sites for which data were assembled on the type of site, methods of remediation and disposal, volume of sediment removed (if removed), total costs, and per unit cost. A summary of information for several sites is presented in Table 10–1.
Among the key findings of the General Electric report are the following:
-
There has not been a systematic experience-based review of the capabilities and limitations of dredging technology in reducing risks posed by contaminated sediments. Thus, an opportunity exists to apply lessons learned from the current base of experience that can help to guide future decision-making.
-
Based on evaluation of projects in the United States, information is now available on the capabilities and limitations of dredging technology. The data on post-dredging residual contaminant levels in surface sediments, production rates, and costs need to be more rigorously used in the evaluation of dredging technology in sediment remedy decisions.
The Final Observations and Conclusions of the General Electric report include, among nine bulleted points, the following:
The experience at completed projects needs to be considered in making future decisions. Adequate monitoring data and formal plans for pre- and post-remediation evaluation of risk reduction are essential elements in sediment remediation projects. These types of essential data can reduce uncertainty and allow one to draw sound conclusions regarding the relative effectiveness of remedial activities.
EPA Region 5, in a presentation to the committee during a public session, indicated that there were six sites (five in the United States and one in Sweden) where monitoring data for PCBs in fish indicated a 2- to 9-fold reduction of PCB concentrations as a result of remedial dredging of PCB-contaminated sediments. Appendix C of the General Electric Report, contributed by the Fox River Group, takes exception to EPA Region 5’s contention that sediment removal (dredging or dry excavations) has been successful in reducing risks as evidenced by decreases in PCB concentrations in fish sampled in the areas of the remedial action. General Electric contends that “EPA presents its findings as conclusive without properly qualifying those conclusions based
TABLE 10–1 U.S. Sediment Remediation Projects Implemented (>10,000 cubic yards)—Primary Goal Versus Outcome
|
Project |
Primary Goal |
Basis for Primary Goal |
Sediment Remedial Target |
Relationship of Target to Goal |
Remediation Method |
Achievement of Remedial Target |
Achievement of Primary Goal |
|
Manistique River, MI (97,050 cubic yards) |
Reduce PCB in fish levels; reduce carcinogenic and noncarcinogenic risks to <10−4 and <1, respectively, except for high-end subsistence and some high-end recreational exposure from fish consumption |
Human-health risk assessment |
10 ppm PCBs |
Default level after using biota to sediment accumulation factor (BSAF) to estimate a target sediment level, then increasing the estimate to 10 ppm PCBs, which EPA justified based on cleanup levels at other EPA projects, the likelihood of achieving <10 ppm, and future natural burial |
Hydraulic dredging |
In progress; consistent achievement of 10 ppm or less proving difficult |
Too soon to tell. Remediation still in progress in Year 5. No postmonitoring program defined as of yet |
|
New Bedford Harbor, MA (14,000 cubic yards) |
Remove PCB mass at an optimum “residual concentration to volume removed” ratio and reduce PCB flux to the water column (interim measure) |
Mass removal calculations; flux modeling studies conducted by PRPs; water column data |
4,000 ppm PCBs in 5 acres of hot spots |
Direct |
Hydraulic dredging |
Achieved based on a limited number of verification samples (15 composite samples ranging from 67 to 2,068 ppm PCBs) |
Achieved mass removal; water column data post-dredging (if collected) not obtained. PCBs in surface sediment samples in the Upper Harbor increased 32% on average, following hot-spot dredging |
|
General Motors (Massena), NY (13,800 cubic yards) |
Reduce PCB levels in fish |
Human health risk assessment |
Achieve 1 ppm PCBs and remove as much sediment as technically feasible |
Vague; 0.1 ppm PCBs desired, but 1 ppm selected based on technical feasibility |
Hydraulic dredging |
Not achieved. Average residual PCB levels at completion in six dredged quadrants across 11 acres ranged from 3 to 27 ppm with a maximum of 90 ppm |
Two annual post-dredging fish monitoring programs completed; no discernible trends other than a slight increase in fish PCB concentration in Year 2 versus Year 1 |
|
Sources: Manistique River (Scenic Hudson 2000; BBL 2000); New Bedford Harbor, Massachusetts (NRC 1997; Bergen et al. 1998); GM Massena, New York (BBL 1996; Scenic Hudson 2000; General Electric 2000). |
|||||||
on known uncertainties and limitations of the underlying data” (General Electric 2000).
The Scenic Hudson report reviews many of the same remediation activities and monitoring data as the General Electric report. The Scenic Hudson (2000) report, which is intended to inform the EPA’s decision regarding remediation of PCB-contaminated sediments in the Hudson River, states,
Dredging is still the preferred remedy for sediment contamination…. [M]onitoring data show reductions in sediment and fish contamination following sediment cleanups…and options for large-scale sediment dewatering, water treatment, and disposal are well developed.
The committee carefully reviewed these reports and the supporting documents to ascertain why these groups could assess the same sets of evaluation data and arrive at different general conclusions. The committee determined that there are three principal reasons for this disagreement. First, in some instances, there is disagreement about the remediation goals and the measures by which achievement of the goals can be assessed. Second, in some cases, the available post-remediation monitoring data are sparse and incomplete compared with pre-remediation data and control data. Third, in some cases, it is the intention of reviewers, agencies, and industries to support their preferences, and that might lead to more conflict. The committee acknowledges that objective evaluations are difficult to organize and even more difficult to produce; however, that does not preclude the affected parties from striving for objectivity.
The lack of a comprehensive set of data on site conditions prior to remediation limits the ability to provide compelling evidence of post-remediation risk reductions. A plot of monitoring data for PCBs in fish collected at the Queensbury, New York, site on the Hudson River (Figure 10–1) illustrates that point. Niagara Mohawk completed the first phase of remediation on this site between 1993 and 1996. That phase involved removal of onshore contamination and dry excavation of a portion of the near-shore sediments in 1996. The 1992 data in Figure 10–1 are for fish that might be larger in size than the other fish samples, and the fish were sampled at a different time of the year (Scenic Hudson 2000). The Scenic Hudson report states, “According to the New York State Department of Environmental Conservation (DEC), the pre-cleanup fish contamination levels at the site are best represented by the 1993 data” (Scenic Hudson 2000). The inclusion or exclusion of the 1992 data set makes a major difference in interpretation of the influence of the remediation on the current concentrations of PCBs in fish. Similar difficulties arose for assessments of
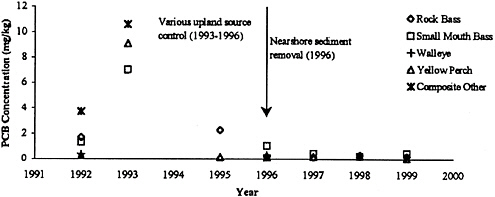
monitoring data for PCB concentrations in fish for the General Motors, Massena, New York, site (General Electric 2000).
The committee has previously emphasized that achieving an understanding of the issues, goals, and risks among affected parties for a project is critical. Also, critical is agreement on how success in achieving these goals will be monitored and evaluated. The need for agreement becomes clear when two different perspectives on possible risk-management goals are considered for a hypothetical area with PCB-contaminated sediments. One goal might be to decrease concentrations of PCBs in surface sediments and thereby decrease PCB concentrations in fish at the site. As discussed in Chapter 6, PCB concentrations in the surface sediments can influence PCB concentrations in fish. However, the degree of certainty of achieving a reduction in PCB concentrations and the time allowed to make such a reduction in the surface sediments and/or fish should be stated as part of the overall risk-management goals.
In a second situation, PCB concentrations in surface sediments were found to be higher after remediation than the goal concentrations established before the remedial dredging (General Electric 2000). (See Box 10-1 for a possible explanation of this increase.) Some affected parties might view that phenomenon as a failure to achieve a management goal. However, if the management goal was to reduce the overall sediment burden (mass) of PCBs, including those in those in deeper sediments that might continue to diffuse low concentrations of PCBs into the overlying surface sediment (i.e., the mass removal option), then the long-term and certain benefit might outweigh the temporarily increased risk associated with the higher concentrations of PCBs in surface sediments. It is important to have an accurate assessment of short-term and long-term risks associated with each possible management option to select the risk-management strategy that will maximize the risk reductions for human health and the ecosystems or that will best achieve the risk-management goals established in the earlier stage of the framework.
ASSESSMENT MONITORING
In the following section, monitoring data collected after the remediation of PCB-contaminated sediment sites are excerpted from a few of the reports submitted to the committee. These data illustrate the type of monitoring that can and should be conducted and also some of the pitfalls that can arise from incomplete monitoring or incomplete interpretation of the data. The specific types of samples and methods of analysis for monitoring depend on the goals and objectives of the management strategy, although certain common practices, which are discussed below, are also applicable. These include air moni-
|
BOX 10–1 Monitoring Surface-Sediment PCB Concentrations There are good scientific reasons for the common assumption that PCBs in surface sediments are an important source of most exposures of fish of PCBs via direct uptake from water in contact with sediments and via feeding on prey that are contaminated by interactions with the sediment and interstitial and overlying water (see Chapter 6). Thus, surface-sediment PCB concentrations have become a focus of monitoring and assessments. For this reason, there is a need for a much clearer understanding and reporting of what is meant by the term surface sediment. In several assessments at specific sites, the upper 3 inches (7.6 cm) is defined as surface sediment. That might be acceptable in some cases where bioturbation or physical mixing rapidly mixes the upper 7.6 cm of the sediment. However, in other cases, surface sediment should be defined as 0.5 cm or less, because that is where the most immediate interaction is between the PCB-contaminated sediment, the overlying waters, and the biotic sectors of the ecosystems. Bioturbation and physical mixing are less intense in this area. Knowledge of the sediment dynamics in question and depth profiles in the sediments of PCB concentrations, coupled with modeling, can provide an estimate of the depth of surface sediment that should be sampled. Ideally, for monitoring assessments, cores of sediment should be cut horizontally into sections of 0.5 to 1 cm to larger intervals, depending on the biological and physical mixing rates of the sediments, followed by analysis for PCBs. At present, there are few such data in monitoring assessments. Very fine-grained sediment and organic particles can be resuspended during dredging and resettle on areas that have been dredged. These particles have large surface area to volume (mass) and high sorption capacity for PCBs. Thus, the concentrations of PCBs can be high. A thin layer of high PCB concentrations can form on or in the surface sediments. In some circumstances, this layer can result in higher measured concentrations of PCBs in surface sediments after dredging compared with the desired and expected outcome of lower surface-sediment concentrations. Much depends on the individual site conditions and the depth of sediment sampled and analyzed as the surface sediment. Given this situation, assessments of risks within various time frames are important. High concentrations within surface sediments can mean greater short-term risk from exposure of biota to PCBs. In the long term, however, combinations of bioturbation, physical mixing, and microbial degradation might significantly reduce these surface-sediment concentrations. |
toring to protect human health during and after remediation and sediment monitoring to determine the concentrations of PCBs remaining in the sediments and the amount of sediment removed.
The committee details the assessment monitoring conducted at the General Motors Massena site because it has the most complete set of results. However, the committee also reviews some monitoring that was conducted at other PCB-contaminated sites around the United States, including New Bedford Harbor in Massachusetts and Manistique Harbor in upper Michigan.
General Motors, Massena, New York
The monitoring data were reported by BBL (1996), Scenic Hudson (2000), and General Electric (2000).
The General Motors Powertrain facility near Massena, New York, began operations in 1959. Between then and 1973, PCB-containing hydraulic fluids were used at the plant, and there were leaks and discharges that resulted in contamination of soils, groundwater, and nearby sediments of the St. Lawrence River. In 1984, the site was placed on the National Priorities List. Primary remediation goals at the site were as follows:
-
Remove PCB-containing sediments within a specified geographic area (an embayment of the St. Lawrence River—about 11 acres of near-shore area of about 13,000 yd3) to achieve a target cleanup goal of PCBs at no more than 1 ppm in sediments, if technically feasible.
-
Dewater sediment sufficiently to pass EPA Method 9095—Paint Filter Liquids Test.
-
Treat dredge-return water and other process water to remove solids and meet discharge limits for PCBs, oil and grease, and suspended solids (TSS) prior to discharge to the river.
-
Prevent release of PCBs, suspended solids, and other constituents to the air and river to the maximum extent practicable.
-
Substantially complete the work before December 1995.
The environmental monitoring plan for this effort consisted of the following:
-
Monitor the St. Lawrence River sediment-removal project to verify that the project performed in a manner protective of human health and the environment.
-
Provide procedures for sampling, analyzing, and measuring the effectiveness of removal operations.
-
Specify the necessary steps to be taken should remediation activities cause exceedances in project action levels.
Environmental monitoring prior to sediment removal consisted of the following:
-
Conduct a pre-dredge bathymetric survey.
-
Determine optimal sampling depth and location for turbidity measurements and water-column samples.
-
Collect nontransient, noncommunity potable water at the site and intake-water samples from the St. Regis Mohawk Tribe.
-
Collect pre-dredging turbidity measurements.
-
Collect air samples for ambient PCBs and dust.
-
Take video documentation of bottom and connecting joints of sheetpile wall.
-
Conduct a turbidity study to determine adequacy of the sediment control system.
Monitoring sediment removal operations included the following:
-
Visual inspection.
-
Turbidity monitoring.
-
Water-column testing.
-
Demonstration and verification testing of temporary water-treatment system.
-
Intake-water sampling at the General Motors site and from the St. Regis Mohawk Tribe.
-
Air sampling for ambient PCBs and dust.
The monitoring action levels for the project are presented in Table 10–2. The sampling activities and results of analyses were reported on a daily basis to the U.S. Army Corps of Engineers onsite representative, the New York State Department of Environmental Conservation, and the St. Regis Mohawk Tribe Environmental Division in the St. Lawrence River Environmental Monitoring Daily Report. If there was an exceedance of an action level, the remediation contractor and the Corps of Engineers onsite representative were notified immediately. Prescribed modifications and procedures, which were agreed to before dredging began, were promptly executed.
TABLE 10–2 Action-Level Values for the St. Lawrence River Sediment Removal Project
|
Turbidity Monitoring: |
|
Nephelometric turbidity units (NTUs): 28 NTUs at predetermined locations downstream greater than those at upstream location |
|
Temporary Effluent Discharge Limitations: |
|
PCBs: Nondetectable PCBs with a target detection limit of 0.065 μg/liter (L)a TSS: 10 mg/L Oil and Grease: 15 mg/L |
|
PCB Water-Column Sampling: |
|
PCBs: 2 μg/L at downstream monitoring stations |
|
Airborne Particulate-Dust Monitoring: |
|
Particulate Dust: 150 μg/m3 |
|
Airborne PCB Monitoring: |
|
PCBs: Daily average total=0.1 μg/m3 |
|
SLR Sediment-Sample Cleanup Goal: |
|
PCBs: 1 mg/kg |
|
aIf PCB analyses of greater than 0.065 μg/L were indicated, the contractor was required to examine and resolve the treatment-system problems but could continue to discharge to the St. Lawrence River. If the PCB analyses of greater than 0.3 μg/L were indicated, the contractor was required to examine and resolve his treatment-system problems and also discontinue discharging to the St. Lawrence River until such levels dropped below 0.3 μg/L. |
Turbidity Monitoring Results
There were a few exceedances of the turbidity action level due to turbid water escaping over the top of low sheet walls of the containment system. These exceedances were not substantial and dissipated within 5 to 15 minutes. However, a filter fabric was installed over the walls, and then additional sheetpile was added to raise the walls. These actions corrected the problem, and only one exceedance of turbidity was measured for 1 day for the remainder of the project. This exceedance was due to a storm event.
Water-Column Monitoring Results
The action level was exceeded only one time because mechanical removal activities associated with a sheetpile wall without a protective silt screen in place. This situation was corrected the following day by installing a silt cur-
tain inside along the sheetpile wall. Final water-column sampling after the sheetpile wall removal at the end of the remediation sediment removal indicated all PCB concentrations within the dredging area had approached detection limits for the sampling and analysis methods. These concentrations were definitely below the action level.
Temporary Water-Treatment Sampling
Three exceedances of the action level occurred on 3 days. Two were caused by high water-flow rates, causing shorter contact time through the activated carbon treatment. This problem was corrected by reducing the flow rate through the system and adding additional activated carbon in a unit to increase sorption contact time and sorption capacity for PCBs. The third exceedance was caused by a switch in the alignment and flow pattern through the activated carbon treatment system. The system was realigned, and the problem was corrected within 4 days. In the interim, the discharge of the treated effluent from the facility to the St. Lawrence River inside the sheetpile wall in the dredging area was recycled to the equalization basin of the dewatering treatment system until corrective realignment had been accomplished.
Drinking-Water-Intake Sampling
Intake samples were taken of the General Motors nontransient, noncommunity potable-water supply facilities and the St. Regis Mohawk Tribe potable-water treatment facilities. The General Motors intake showed action-level PCB concentrations in the early days of the monitoring, and these levels were evidently due to leaks in the system. Bottled water was provided to General Motors employees until the system was fixed. There were no action-level exceedances at the St. Regis Mohawk Tribe facility.
Air Monitoring
Baseline testing showed that 2 of 17 samples from one monitoring station prior to the dredging were above the action level, and the remainder of the samples and all 14 samples from another area were below the action level, in fact below the detection limits. Ninety-eight air samples were collected and analyzed from the area immediately adjacent to the sediment stockpile area, and 50 of these analyses exceeded the action level. After additional sampling
stations were set up and results were received, it was determined that these exceedances were a result of grading activities of soils contaminated with low levels of PCBs adjacent to the sediment stockpile area. These activities were being conducted by a contractor for another site’s remediation activities. Data from the more distant air monitor showed little or no impact on off-site areas associated with the sediment removal and stockpiling.
Monitoring After Sediment-Removal Operations
-
Bathymetric survey after sediment removal. Bathymetric surveys were conducted along specified lines after each dredging event. At the project initiation, an estimated 16,800 yd3 of sediment were targeted for removal from the designated dredge area. At project completion, the bathymetric survey estimated that an in situ volume of about 13,000 yd3 had been removed.
-
Verification of sediment sampling and analyses of the river bottom. The goal was to remove sediment so that residual PCB concentrations in river sediment were at or below 1 ppm. Final PCB concentrations in several of the individual sediment samples at the end of the project did not meet the 1-ppm goal. Further dredging removal was determined to be technically impractical, because there was only a thin layer of sediment remaining, and mechanical removal activities were removing more underlying clean materials than surface sediments with PCB concentrations above 1 ppm. A sediment cap for one of the areas of concentrations above 1 ppm was approved by EPA and installed. (See Chapters 6 and 9 for more details.)
New Bedford Harbor, Massachusetts
The monitoring data are from reports by the NRC (1997) and Bergen et al. (1998).
New Bedford Harbor is a marine Superfund site undergoing remediation. The general background on the site has been described in Chapter 9. Remedial actions are focused on the hot-spot areas, the upper and lower harbor, and the Buzzards Bay area. Dredging of the hot-spot sediment was completed in 1995 (see Chapter 9). The record of decision (ROD) for remediation of the remainder of the upper and lower New Bedford Harbor was issued in September 1998. The selected remedy calls for dredging and shoreline containment of approximately 450,000 yd3 of contaminated sediments with PCB concentrations greater than 10 ppm in four confined disposal facilities constructed along the edge of the harbor.
The results of the monitoring of the air and water are summarized in Chapter 9. The possible effect of hot-spot remediation dredging on the PCB concen-
trations in the remainder of the upper and lower harbor were assessed in a sediment monitoring program (Bergen et al. 1998). The sampling matrix of 80 monitoring stations in the harbor and Buzzards Bay was sampled before (October 1983) and after (October 1995) hot-spot dredging and analyzed for 18 PCB congeners. “Although major re-distributions of contaminated sediments were confined to the immediate vicinity of remedial activities, there is evidence that low-molecular-weight PCBs were transported further.” Those findings were not evident in the more traditional analyses of concentrations of total PCBs. The application of qualitative graphical analyses coupled with exploratory statistical techniques were required to notice the findings of transport from the immediate vicinity of the remedial action (Bergen et al. 1998). Simply stated, there was transport of PCB-contaminated sediments into other areas of the upper and lower harbor, but the amounts were not large enough to detect by analyzing for total concentrations of PCBs.
Manistique River and Harbor, Michigan
The monitoring data are from reports by Scenic Hudson (2000) and BBL (2000).
Manistique River is in the upper peninsula of Michigan and drains into the north shore of Lake Michigan. EPA estimated that there were about 16,000 pounds of PCBs in the Manistique harbor sediments and immediately upstream in the river. Remediation included dredging of contaminated sediments in several areas between 1996 through 2000. A recent report (BBL 2000) of PCB concentrations in cores of sediments details the concentrations of PCBs in the upper 0–3 inches of sediment from dredged and undredged areas. The report presents detailed comparisons of PCB concentrations in surface sediments (0–3 inches) for 1999 samples and for some 1997 and 1998 samples with 1993 pre-remediation dredging action. The emphasis in the report is again on surface sediments, and thus the data for deeper sections of the cores are presented only for the 1999 samples and not for the 1993 samples. Thus, it is difficult to discern from this report what happened regarding removal of the deeper sediments, perhaps some with higher PCB concentrations. This problem becomes important when considering the issue of mass removal of PCBs versus the issue of initial effects on surface-sediment PCB concentrations. Among the conclusions of this report are two that illustrate that point (BBL 2000):
-
Data suggest that while a decline in PCB concentrations might be occurring naturally in undredged areas, no decline is apparent in dredged areas. This observation suggests that dredging might have slowed the rate of
-
naturally occurring surface-sediment PCB reductions in dredged areas by re-exposing previously buried PCBs. Whereas the median PCB concentration in the undredged area declined significantly, the median values for 1993 and 1999 dredged area samples showed no statistically significant change in PCB concentrations.
-
Data demonstrate that although PCB mass removal occurs during dredging, limitations exist with respect to the ability of large-scale environmental dredging to reduce risks associated with PCBs in aquatic sediments. Thus, dredging at Manistique to date has not resulted in appreciable reductions in surface-sediment PCB concentrations.
Once again, this example emphasizes the debate about mass removal versus surface-sediment concentrations and about balancing increased short-term risks against long-term risks.
The committee notes that remediation activity was still ongoing at Manistique after the report was prepared. Dredging was completed in August 2000. Further sediment data after that time are not available as this report goes to press. It is possible and feasible to use the existing monitoring data and new monitoring data to be collected to guide further action in terms of additional dredging if that is warranted after evaluating the data using the framework approach that the committee recommends.
The NRC (1995) review of the EPA Environmental Monitoring and Assessment Program (EMAP) provides a good discussion of the scientific issues associated with environmental monitoring that are also pertinent to assessment monitoring. EMAP was established to monitor ecological status and trends by estimating “changes in selected indicators of condition of the nation’s ecological resources on a regional basis with known confidence.”
The issue of human health concerns associated with the presence of PCBs in sediments and in connection with various management options has been discussed earlier in this report (see Chapters 2, 6, and 7 and Appendix G). A useful human health monitoring and epidemiological study is difficult to implement because of the many interactive and confounding factors and limited sample size (NRC 1991). Nevertheless, the need for such studies is clear. General guidance for the design and implementation of such studies is available (IOM 1999). Furthermore, even if the risks to human health are expected to be minimal, carrying out human-health monitoring is beneficial and is a safeguard against unexpected effects. It is reassuring to the affected communities to have this type of monitoring in place. The challenge is to have a human-health monitoring capability that provides meaningful results for reasonable cost. The risk-assessment framework we recommend provides a process for meeting such a challenge.
CONCLUSIONS AND RECOMMENDATIONS
Monitoring for a few sites and remediation actions have been completed or are ongoing. The committee’s assessment of the monitoring plans and reported monitoring results is that the data are helpful and allow some short-term assessments of the efficacy of a few projects. However, the data and reviews are limited, because they are based on total PCBs and not on congener-specific analyses and risk calculations using congener-specific risk factors. Based on measurements of total PCBs and all the caveats associated with such measurements, monitoring and interpretation of the data protected public health from immediate risks associated with inhalation of airborne PCBs. In addition, the monitoring data helped minimize the release of suspended or dissolved PCBs from the dredging activities. In the future, additional monitoring will provide better information and a longer-term record of evaluation.
There are few instances where monitoring has assessed ecological health beyond the measurements of total PCBs in selected fish samples. Given the current capabilities for assessing PCBs in congener-specific measurements and coupling these with biological-effects responses, as noted in Chapter 6 and Appendix G, the lack of such monitoring data is disappointing.
In addition, there are few baseline data for concentrations of PCBs in fish at many of the sites undergoing remediation. The lack of baseline data precludes an assessment of the immediate effect of a remedial action when compared with measurements made after the remedial action. This data gap has to be acknowledged when interpreting monitoring data. It might be many years before any expected reductions in PCB concentrations can be measured because of the length of turnover times of PCBs in older and larger fish, even when inputs to their habitats and exposure levels are decreased (Chapter 6). For new sites and those still undergoing management actions, the committee strongly recommends that baseline monitoring data be collected before management actions are undertaken.
The monitoring of sediments for PCB concentrations is confounded by a lack of adjusting the sampling and analysis strategy to account for the dynamics of sediment systems and particles in aquatic systems. Furthermore, a much clearer understanding about the meaning of the term surface sediments is needed in many of the studies reviewed to avoid confusion. Often, in the evaluations cited above, the upper 3 inches (7.6 cm) of sediment is defined as surface sediments. However, sampling 0 to 3 inches of surface sediments from carefully obtained core samples is an unnecessary expenditure of effort if the samples are homogenized before analysis. Sampling of only the upper few centimeters would reveal more useful information about the PCB concentrations in surface sediments (see Box 10-1).
The result of the monitoring of surface sediments is the subject of controversy in terms of what the data mean for risk management. This issue is only partly a monitoring strategy issue as noted in the preceding paragraph and is more an issue of agreeing to the actual risk-management goals.
Information about monitoring economic and social aspects of remedial actions is missing. For example, there were careful plans to control the traffic of trucks with dewatered sediments leaving the New Bedford containment facility for an out-of-state disposal facility. However, the committee has no information regarding how this system worked in the neighborhoods. Were there adverse economic impacts on nearby businesses? Once again, the committee notes that there is a lack of data for this and other sites.
Although there were references in the monitoring reports about the reporting of data to a select set of affected parties, there seemed to be no process to involve affected communities beyond notifications through newsletters of the results of the monitoring. Each site should have a policy and management mechanism by which the affected parties can have rapid and easy access to monitoring data and a clear understanding of the implications of the data. That mechanism needs to be coupled with an agreed upon mechanism for interruption or modification of the remediation process if the monitoring data indicate agreed upon deviations from the expected results.
-
Short-term and long-term assessments of the efficacy of management actions require carefully planned and adequately funded monitoring to inform all interested parties and affected communities of the outcomes of the management actions.
-
Information from assessments of completed and ongoing remediation projects should be assessed within the recommended risk-management framework to inform decisions about management options at other sites and projects.
-
The collection of baseline data for pre-remediation characterization is essential for new sites and ongoing sites where additional management actions are being contemplated. There is often a lack of adequate data for pre-remediation baseline assessment at sites undergoing remediation. Many of these sites will involve future management activities, at the very least monitored natural attenuation. Continued collection of monitoring data at these sites is needed. Such data are needed not only for assessment of completed management actions, but also for monitoring in anticipation of future remediation. The latter may require different types of monitoring than the former.
-
PCB monitoring should utilize congener-specific analyses, allowing for congener-specific risk calculations.
-
Assessment of remedial action requires social science, economic, cultural monitoring in addition to technological, human health, and ecological health monitoring.
-
Each site requires a policy and management mechanism by which the affected parties can have rapid and easy access to monitoring data and a clear understanding of the implications of the data. This mechanism needs to be coupled with an agreed upon mechanism for interruption or modification of the risk-management process if the monitoring data indicate agreed upon deviations from the expected results.
-
Contaminated sites can act as both sources and sinks for the global redistribution of PCBs. Monitoring of those sites can provide estimates of the net contribution of PCB-contaminated sites to the global burden of PCBs.
REFERENCES
BBL (Blasland, Bouck & Lee). 1996. St. Lawrence River Sediment Removal Project Remedial Action Completion Report. Prepared for General Motors Powertrain, Massena, New York. Blasland, Bouck & Lee, Syracuse, New York. June.
BBL (Blasland, Bouck & Lee). 2000. Dredging-Related Sampling of Manistique Harbor—1999 Field Study. Report prepared for Fox River Group. Syracuse, New York: Blasland, Bouck & Lee Engineers and Scientists. June.
Bergen, B.J., K.A.Rahn, and W.G.Nelson. 1998. Remediation at a marine superfund site- Surficial sediment PCB congener concentration, composition, and redistribution. Environ. Sci Technol. 32(22):3496–3501.
GE (General Electric Company). 2000. Environmental Dredging: An Evaluation of Its Effectiveness in Controlling Risks. General Electric Company, Blasland, Bouck & Lee, Inc., and Applied Environmental Management, Inc., Albany, New York. August.
IOM (Institute of Medicine). 1999. Gulf War Veterans: Measuring Health. Washington, DC: National Academy Press.
Niagara Mohawk. 2000. Annual Fish Tissue Sampling Program Data Report of the 1999 Results and Five Year Summary (1995–1999). Prepared for the Niagara Mohawk Power Corporation by Parsons Engineering Science, Inc. April 2000.
NRC (National Research Council). 1991. Human Exposure Assessment for Airborne Pollutants: Advances and Opportunities. Washington, DC: National Academy Press.
NRC (National Research Council). 1995. Review of EPA’s Environmental Monitoring and Assessment Program: Overall Evaluation. Washington, DC: National Academy Press.
NRC (National Research Council). 1997. Contaminated Sediments in Ports and Waterways. Washington, DC: National Academy Press.
PCCRARM (Presidential/Congressional Commission on Risk Assessment and Risk Management). 1997. Framework for Environmental Health Risk Management: Final Report. Washington, DC: The Commission.
Scenic Hudson. 2000. Accomplishments at Contaminated Sediment Cleanup Sites Relevant to the Hudson River. Scenic Hudson. September.


