
Page 50
4
Market-Basket Reporting
Market-basket reporting for NAEP has been proposed as a way to summarize academic achievement on a representative collection of NAEP test items. The objectives for market-basket reporting are twofold: to summarize performance in a way that is more comfortable to users; and to release the collection of items so that users would have a concrete reference for the meaning of the scores (National Assessment Governing Board, 1997). In addition, the market-basket approach would make it possible to track performance over time to document changes in students' academic accomplishments. The ultimate goal is to better communicate what students in the United States are expected to know and be able to do, according to the subject areas, content and skills, and grade levels assessed on NAEP.
The earliest references to market-basket reporting of NAEP assessments appeared in the “Policy Statement on Redesigning the National Assessment of Educational Progress” (National Assessment Governing Board, 1996) and in the Design and Feasibility Team's Report to NAGB (Forsyth et al., 1996). These documents referred to market-basket reporting as “domainscore reporting” where a “goodly number of test questions are developed that encompass the subject, and student results are reported as a percentage of the ‘domain' that students ‘know and can do”' (National Assessment Governing Board, 1996:13). According to these documents, the general idea of a NAEP market basket draws on an image similar to the Consumer Price Index (CPI): a collection of test questions representative of some larger content domain; and an easily-understood index to summarize performance
Page 51
on the items. These writings generally refer to two components of the NAEP market basket, the collection of items and the summary index. The documents consider collections of items that are large (e.g., too many items to be administered to a single student in its entirety) or small (e.g., small enough to be considered an administrable test form). They consider percent correct scores as the metric for summarizing performance on the collection of items, a metric NAEP's sponsors believe is widely understood (National Assessment Governing Board, 1997). Figure 1-1 (see Chapter 1) provides a pictorial description for the NAEP market basket and its various components.
Perceptions about the configuration and uses for the NAEP market basket are not uniform. NAGB's current policies address the short form version of a market basket, stating that its goal is to “enable faster, more understandable initial reporting of results” and to allow states access to test instruments to obtain NAEP results in years when particular subjects are not scheduled (National Assessment Governing Board, 1999a). Educators from both the state and local level who participated in the committee's workshops envisioned NAEP market-basket forms as short forms that could be used as an alternative to or in connection with their local assessments possibly for the purpose of comparing local assessment results with NAEP results (National Research Council, 2000). At the committee's workshop and in his writings on domain score reporting, Bock (1997) described the market basket as a tool for sampling student knowledge over the entire domain of any given content area. Under Bock's conception, the focus would extend beyond what is measured by NAEP and would support score inferences that provide information about how a student would perform on the larger domain. If one were to draw a direct parallel between the CPI, an economic index that summarizes actual consumer purchases, one could reasonably expect a market basket positioned as an educational index to measure and report exactly what it is that students are learning.
The intent of this chapter is to explore various conceptions of market-basket reporting and discuss issues associated with NAEP's implementation of such a reporting mechanism. We address the following study questions: (1) What is market-basket reporting? (2) What information needs might be served by market-basket reporting for NAEP? (3) Are market-basket reports likely to be relevant and accurate enough to meet these needs? This chapter deals more broadly with market-basket reporting, while the next chapter focuses specifically on the short form.
Page 52
The first section of this chapter lays out the psychometric issues that should be considered in connection with market-basket reporting. This is followed by a description of the pilot study currently under way at ETS and comments made by participants in the committee's workshop. The final section of the chapter presents details on the methodology for constructing and reporting results for the CPI market basket.
STUDY APPROACH
During the course of the study, the committee reviewed the literature and the policy guidelines pertaining to market-basket reporting, including the following documents: Design and Feasibility Team's report to NAGB (Forsyth et al., 1996); ETS's proposal (Educational Testing Service, 1998); various studies on domain score reporting (Bock, 1997; Bock, Thissen, & Zimowski, 1997; Pommerich & Nicewander, 1998); and policy guidelines included in the 1996 NAEP Redesign (National Assessment Governing Board, 1996) and in NAEP Design 2000-2010 policy (National Assessment Governing Board, 1999a). In addition, the committee listened to presentations by NAGB and NCES staff about market-basket reporting.
As mentioned in Chapter 1, the committee held a workshop on market-basket reporting which provided a forum for discussions with representatives of the organizations involved in setting policy for and operating NAEP (NAGB and NCES) along with individuals from ETS, the contractual agency that works on NAEP. In preparation for the workshop, NCES, NAGB, and ETS staff prepared the following papers:
1. A Market Basket for NAEP: Policies and Objectives of the National Assessment Governing Board by Roy Truby, executive director of NAGB
2. Simplifying the Interpretation of NAEP Results With Market Baskets and Shortened Forms of NAEP by Andrew Kolstad, senior technical advisor for the Assessment Division at NCES
3. Evidentiary Relationships among Data-Gathering Methods and Reporting Scales In Surveys of Educational Achievement by Robert Mislevy, distinguished research scholar with ETS
4. NAEP's Year 2000 Market Basket Study: What Do We Expect to Learn? by John Mazzeo, executive director of ETS's School and College Services
Page 53
Individuals representing a variety of perspectives—education policy, assessment, curriculum and instruction, measurement, and the press—reacted to the ideas presented by NAEP's sponsors and contractors. Because the conception of the market basket has often been illustrated through analogies to the CPI market basket, we also arranged for a briefing on the CPI from a representative of the Bureau of Labor Statistics. Approximately 40 individuals participated in the workshop, and the results were summarized and published (National Research Council, 2000).
PSYCHOMETRIC CONSIDERATIONS FOR THE NAEP MARKET BASKET
While the idea behind market-basket reporting is to produce more easily understood test results, the “behind-the-scenes” technology required to enable such reporting methodology is quite complex. During the workshop, Robert Mislevy laid the conceptual groundwork for the technical and measurement issues involved in market-basket reporting (Mislevy, 2000); Andrew Kolstad traced the history of NAEP reporting practices (Kolstad, 2000); and John Mazzeo described features of the pilot study currently under way on the market basket. In the section that follows, we draw from the ideas presented by Mislevy, Kolstad, and Mazzeo and from other sources to delineate the psychometric issues that must be addressed in designing a NAEP market basket.
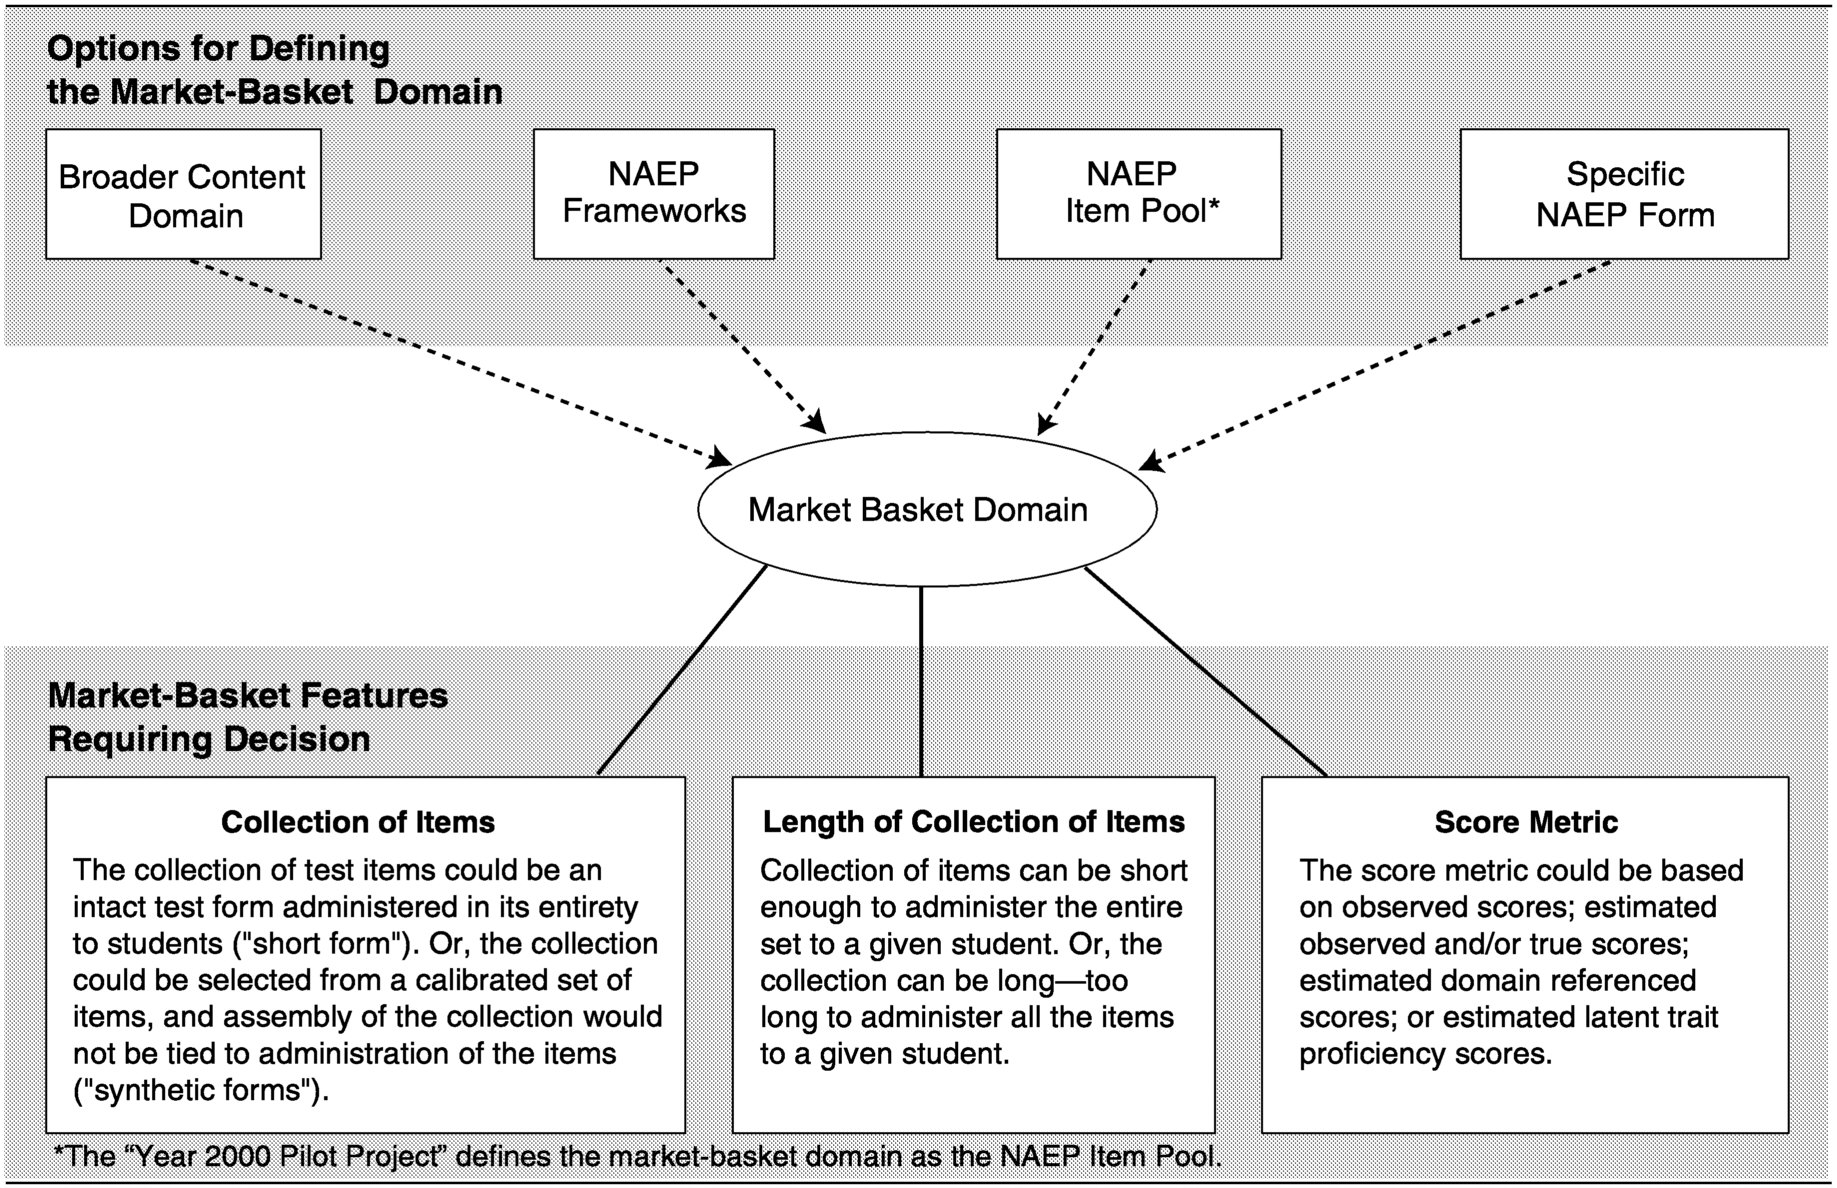
The Market Basket Domain
Perhaps the most critical issue for a market basket is determining the domain to be measured. For the current pilot study, the market basket domain is limited to the pool of existing or newly constructed NAEP items (Mazzeo, 2000). Such a domain might be selected as most desirable, but it is not the only way to define the market basket. Figure 4-1 depicts several key factors that must be considered.
For any given content area, the first stage in developing instruction and assessment programs is delimitation of the targeted range of knowledge, skills, and objectives. In most cases, the range of material is too broad to be covered by a given instructional and assessment plan, forcing educators to choose what they consider most important for students to know and learn. Under its broadest definition, the domain would include knowledge and skills: (1) deemed important by content experts; (2) covered by text-
Page 55
books and other instructional material; (3) specified by state and local curriculum guides; (4) actually taught in the classroom; and (5) believed to be critical by the larger public. NAEP's use of matrix sampling allows it to define the domain broadly, as is evident in the NAEP frameworks. The frameworks were selected through a broad-based consensus process to balance current educational practice and reform recommendations (National Research Council, 1999b).
Because the length of any assessment is constrained by time, the collection of items a student takes can only be expected to be a sample from the domain. As with other tests, frameworks guide item and task development for NAEP so that performance on the test items can support inferences about the domain. The intent is to provide a reference for test construction that assures the final assessment will be representative of the defined domain.
In constructing the market basket, the alignment of the item pool to the framework, as well as the framework's representation of the broad domain, have a substantial impact on the potential validity of inferences based on market-basket scores. Given that the pilot study defines the domain as the pool of existing and newly constructed NAEP items (Mazzeo, 2000), inferences from market-basket scores to the NAEP frameworks will rely on how well the item pool represents the frameworks. The Committee on the Evaluation of National and State Assessments of Educational Progress (National Research Council, 1999b:132), evaluated the fit of NAEP items to the frameworks. They concluded:
In general, the assessment item pools are reasonably reflective of the goals for distributions of items set forth, in the framework matrices, particularly in the content-area dimensions in mathematics and science.
However, the presence of standards-based goals in the frameworks and the general fit of the assessment item pools to categories in the major framework dimensions do not ensure that the goals of the framework have been successfully translated into assessment materials. Several lines of evidence indicate that NAEP's assessments, as currently constructed and scored, do not adequately assess some of the most valued aspects of the frameworks, particularly with respect to assessing the more complex cognitive skills and levels and types of students' understanding.
Thus, it is not clear that defining the domain as the pool of existing or newly developed NAEP items will result in a set of items for the market basket that adequately represent the frameworks.
Page 56
The Basis for Market-Basket Reporting
To define the basis for market-basket reporting, two decisions must be made. The first relates to the set of items that set the scale for the percent correct or percent of maximum score; the second pertains to the method used to collect the data that are summarized using the market-basket approach. The set of test items used to define the market basket could either be administered to students as part of data collection, or they could be selected from a calibrated set of items solely for the purpose of defining the score scale for reporting performance on the market basket. In the former case, the set of items could take the shape of an intact test form administered in its entirety to students. Given time constraints for test administration, an administrable form would need to be relatively short, short enough to administer during a 40- or 50-minute testing session. We refer to this sort of a collection of items as a “short form.” In the latter case, the set of items could be assembled to represent the content and skill domain, but assembly of the collection would not be tied to administration of the items. That is, the items would be administered as part of NAEP but not necessarily in a form that would be used for reporting. This conception of the market basket—a collection of items that is never administered in its entirety as an intact test form—is called a “synthetic” form. Synthetic forms can be long or short.
Synthetic forms can be developed to meet a variety of reporting goals. One alternative would be to use a very large pool of items that is too large to administer to any individual. This pool would yield better representation of the NAEP framework, but it could provide more information than can easily be assimilated by the audiences for NAEP results. Alternatively, a synthetic form could be a smaller set of items that represents the NAEP framework in a more limited way and that could be used as a constant reference over time for tracking performance. Since the form would be short, it would not provide information about the nuances of the NAEP framework, only the major points.
A third alternative could be a collection of synthetic short forms, which together would provide a more detailed representation of the NAEP framework than would a single short form. This would overcome the limitations in coverage of a single short form. Using multiple forms, however, introduces the complication of comparing results across test forms that are not identical.
Page 57
Thus, the data that form the basis for market-basket reporting can be collected using the large pool of items as is currently done with NAEP, or via a short form or multiple short forms. The means for transforming the scores to the reporting metric will vary depending on the data collection method.
Constructing Multiple Market-Basket Forms
As stated above, market-basket reporting could be based on a single short form. Given the breadth of the NAEP frameworks, however, short forms necessarily will be limited in the way that they represent the NAEP frameworks. To overcome the limitations in coverage of a single short form, multiple market-basket forms can be constructed to be either technically parallel (each measures similar content and skills) or arbitrary (each measures different sets of content and skills). Parallel test forms are commonly used in large-scale achievement testing, while arbitrary forms are typical of NAEP.
Arbitrary test forms measure the same general domain of content and skills, but they are not necessarily constructed to be comparable. They can be expected to have varying test length, use different item formats, and differentially sample the content domain. The test parameters from each form will also differ.
Parallel forms, on the other hand, more consistently sample the domain for a given group of examinees. However, the construction of parallel test forms presents a developmental challenge. According to Stanley (1971: 405):
The best guarantee of parallelism for two test forms would seem to be that a complete and detailed set of specifications for the test be prepared in advance of any final test construction. The set of specification should indicate item types, difficulty level of items, procedures and standards for item selection and refinement, and distribution of items with regard to the content to be covered, specified in as much detail as seems feasible. If each test form is then built to conform to the outline, while at the same time care is taken to avoid identity or detailed overlapping of content, the two resulting test forms should be truly comparable.
Depending on the degree to which parallelism is actually obtained, forms can be classified as classically parallel, tau-equivalent, or congeneric (Feldt & Brennan, 1989). The differences among these classifications per-
Page 58
tain to the distributions of true scores, error scores, and observed scores on the forms. 1
To some extent, the type of forms used in data collection will directly affect the score distributions for the test. Knowing how scores are expected to be distributed serves as an indicator for selection of appropriate statistical tools for estimating and reporting student performance. With rare exception, the type of test forms used for NAEP have been arbitrary forms; coupled with matrix sampling, their use has necessitated complex statistical techniques for estimating examinee performance (i.e., imputation and conditioning). If the desire is to make comparisons between market-basket results and main NAEP or to make predictions from one to the other, procedures for deriving scores for NAEP market baskets will be similarly complex. If there is no intention to compare results with main NAEP or to predict performance on one from the other, forms used to facilitate market-basket reporting need not follow the path of NAEP and can be constructed to yield more easily derivable and interpretable information.
Statistical Methods for Linking Scores from Multiple Test Forms
If multiple test forms are used, student performance across the forms will likely differ. Even if the forms were constructed in a manner intended to yield parallel forms (i.e., similar in content, format, difficulty, and length), differences in difficulties will be expected. Equating procedures can be used to adjust for differences in difficulty levels (though not to align content or make up for test length differences) and will yield scores that can be used interchangeably across forms (Kolen & Brennan, 1995). Percent correct scores based on different forms can, thus, be equated, and adjusted percent correct scores reported.
1 Classically parallel forms must, theoretically, yield score distributions with identical means and variances for both observed scores and true scores. Classically parallel forms share a common metric. Tau-equivalent forms have the same mix of items but may differ slightly with regard to the numbers of items. Tau-equivalent measures can yield different error variances and observed score variances. True scores as well as their variances are constant across tau-equivalent forms as long as forms do not vary in length in any meaningful way. Congeneric forms include the same essential mix of knowledge and skills but may differ in terms of the number and difficulty of the items. The observed score distributions from congeneric forms may have different characteristics that may in part result from variations in test length.
Page 59
Since arbitrary forms can consist of a different mix of item types and can vary in test length and difficulty levels, scores based on arbitrary forms must be linked using calibration techniques, rather than equating procedures. Further, the precision with which scores on arbitrary forms are estimated can vary both across forms and across student proficiency levels within a form. Given these differences among forms, Item Response Theory (IRT) models are most often used for linking scores from different forms.
Comparisons between Market-Basket Scores and NAEP Performance
Market-basket reporting requires some method for placing NAEP results on the market-basket score scale. This can be accomplished directly by administering one or more market-basket short forms to a statistically representative sample of the NAEP examinee population. This approach will not work for the long-form market basket, however, because the number of items is too great to administer to an individual student.
An alternative approach is to project NAEP results from a separate data collection onto the score scale defined by a market-basket form. The form can be either an administrable short form or one of a variety of synthetic forms. The methodology used for projection is statistically intensive because of complexities in the dimensional structure of some NAEP frameworks (e.g., the multiple scales) as well as the IRT and plausible values methodologies used for the analysis.
Score Metrics
There are several score metrics that can be considered for market-basket reporting, each of which poses challenges in terms of providing NAEP's audiences with a more easily understood summary of performance. The proposed score metrics are: (1) observed scores, (2) estimated observed and/ or true scores, (3) estimated domain referenced scores, and (4) estimated latent trait proficiency scores.
Observed Scores
The observed score metric is based on a tally of the number of right answers or the number of points received. The most direct method for obtaining observed scores is to administer one or more short forms to an
Page 60
appropriate sample of students. The observed score that has most frequently been suggested for market-basket reporting is the percent correct score. Observed scores can be quickly converted to a percent correct or percent of maximum score by adding the number correct on the multiple-choice items and the points received on the constructed response items and then dividing the sum by the total number of possible points. Observed scores have the problem of being tied to the composition and difficulty of the collection of items on the test form. Under a configuration in which multiple forms were used, a method (equating or calibration) would be needed to adjust scores for these form differences so that the scores would have the same interpretation.
At first blush, percent correct scores seem to be a simple, straightforward, and intuitively appealing way to increase public understanding of NAEP results. However, they present complexities of their own. First, NAEP contains a mix of multiple-choice and constructed response items. Multiple-choice items are awarded one point if answered correctly and zero points if answered incorrectly. Answers to constructed response items are awarded a varying number of points. For some constructed response questions, 6 is the top score; for others, 3 is the top score. For a given task, more points are awarded to answers that demonstrate greater proficiency. Therefore, in order to come up with a simple sum of the number of correct responses to test items that include constructed response items, one would need to understand the judgment behind “correct answers.” What would it mean to get a “correct answer” on a constructed response item? Receiving all points? Half of the points? Any score above zero?
As an alternative, the percent correct score might be based not on the number of questions but on the total number of points. This presents another complexity, however. Adding the number of points would result in awarding more weight to the constructed response questions than the multiple-choice questions. For example, suppose a constructed response question could receive between 1 and 6 points, with a 2 representing slightly more competence in the area than a 1 but clearly not enough competence to get a 6. Compare a score of 2 out of 6 possible points on this item versus a multiple-choice item where the top score for a correct answer is 1. A simple sum would give twice as much weight to the barely correct constructed response item than to a correct multiple-choice item. This might be reasonable if the constructed response questions required a level of skill higher than the multiple-choice questions, such that a score of 2 on the former actually represented twice as much skill as a score of 1 on the latter,
Page 61
but this is not the case for NAEP questions. Hence, some type of weighting scheme is needed. Yet, that weighting also would introduce complexity to the percent correct metric.
Estimated True Score
Reporting on a true score metric involves making a prediction from the observed score to the expected true score (it is a predicted score, since an individual's true score is never known). For a NAEP short form, the prediction would be based on the sample of administered items. A similar prediction would be made for the estimated observed score based on a longer form of which a given student takes only a portion of items. Estimated true scores could be derived from techniques aligned with either classical test theory or IRT. Reporting on an estimated true score or estimated observed score metric means working with predictive distributions of these scores which requires statistical procedures that are more complex than those for reporting observed number correct or percent correct scores.
Estimated Domain Score
As defined by Bock (1997), the estimated domain referenced score involves expressing scale scores in terms of the expected percent correct on a larger collection of items that are representative of the specified domain. The expected percent correct can be calculated for any given scale score using IRT methods (see Bock et al., 1997). This calculation would involve transforming observed scores, based on an assessment of part of the domain, to an expected percent correct score. While derivation of this score would require complex procedures, it would result in scores on the metric (e.g., percent correct) that NAEP's sponsors consider more intuitively appealing than an IRT proficiency score (Kolstad, 2000).
Estimated Proficiency Score
IRT-based procedures for estimating proficiency yield estimates referred to as “latent trait estimates.” Use of the latent trait metric requires estimation of the latent trait distribution. NAEP currently estimates latent trait distributions that are converted to scaled score distributions for reporting. Estimating the latent trait distribution also involves complicated transformations from observed scores but has the advantage that, when
Page 62
IRT assumptions are met, the distributions generalize beyond the specific set of administered items. Market-basket reports could use the latent trait (theta) metric, or latent trait scores could be converted to scaled scores, but reporting on this metric would not ameliorate the interpretation problems associated with the current NAEP reporting scale.
THE YEAR 2000 PILOT STUDY ON MARKET BASKET REPORTING
The market-basket pilot study, currently under way at ETS, was designed with three goals in mind: (1) to produce and evaluate a market-basket report of NAEP results; (2) to gain experience with constructing short forms; and (3) to conduct research on the methodological and technical issues associated with implementing a market-basket reporting system (Mazzeo, 2000). The study involves the construction of two fourth-grade mathematics test forms, also referred to as administrable or short forms. Under one configuration for market-basket reporting, one of these forms would be released as the market basket set of exemplar items, and the other would be treated as a secure form for states and districts to administer as they see fit. The pilot study also investigates preparation and release of the longer version of the market basket. ETS researchers plan to simulate a longer synthetic form of the market basket by combining the two short forms. Because no student will have taken both short forms, scores for the long form will be derived from performance on the items and the relationships across the forms.
The test developers hope that the study will serve as a learning experience regarding the construction of alternate NAEP short forms, since short forms might be used by NAEP even without the move to market-basket reporting. Whereas creating intact test forms is a standard part of most testing programs, this is not the case with NAEP. NAEP's current system for developing and field testing items was set up to support the construction of a system of arbitrary test forms in an efficient manner and does not yet have guidelines for constructing market baskets or intact tests.
A NAEP test development committee handled construction of the short forms. They were instructed to identify a set of secure NAEP items that were high quality exemplars of the pool and to select items that matched the pool with respect to content, process, format, and statistical specifications. The committee constructed two forms that could be administered within a 45-minute time period, one consisting of 31 items, the
Page 63
other containing 33 items. The items were organized into three distinct blocks, each given during separately timed 15-minute test sessions. One of the short forms consisted of previously administered secure items; the other consisted of new items. Both forms were given to a random sample of 8,000 students during the NAEP 2000 administration. The forms were spiraled 2 with previously administered NAEP materials to enable linking to NAEP.
The study's sponsors expect the research to yield three products: (1) one or more secure short forms; (2) a research report intended for technical audiences that examines test development and data analytic issues associated with the implementation of market-basket reporting; and (3) a report intended for general audiences.
ETS researchers will continue to study alternative analysis and data collection methods. One of their planned studies involves conducting separate analyses of the year-2000 data using methods appropriate for arbitrary forms, methods appropriate for congeneric forms, and methods appropriate for parallel forms. Each of these sets of analyses will produce results in an observed score metric as well as a true score metric. Comparisons of results from the other approaches to the results from the arbitrary forms will provide concrete information about which data gathering options are most viable for the market-basket concept. These comparisons will evaluate the degree of similarity among the sets of results based on the stronger models, which use congeneric or parallel forms and involve less complex analytic procedures, and results from the arbitrary forms, which make the weakest assumptions but involve the most complicated analyses. If the results are similar, the simpler data collection and analytic procedures may be acceptable. In addition, comparing observed score and true score results for each of the approaches will inform decisions about which type of reporting scale should be used.
The year-2000 study will also evaluate the potential benefit of using longer market baskets. The 31-item short forms were chosen to minimize school and student burden and to increase the chances of obtaining school participation in NAEP. Other decisions regarding test length could also be
2 Spiraling is an approach to form distribution in which one copy of each different form is handed out before spiraling down to a second copy of each form and then a third and so forth. The goals of this approach are to achieve essentially random assignment of students to forms while ensuring that approximately equal numbers of students complete each form.
Page 64
made, such as the domain score reporting approach (Bock, 1997). (See Chapter 5 for a description of this approach.) Clearly, a longer collection of items would permit more adequate domain coverage and produce more reliable results.
WORKSHOP PARTICIPANTS' REACTIONS TO PLANS FOR MARKET-BASKET REPORTING
Large-Scale Release of NAEP Items
Participants in the committee's workshop on market-basket reporting suggested several ways for the market-basket set of items to be used. Test directors and school system administrators found the idea of releasing a representative set of items to be very appealing and maintained this would help to “demystify” NAEP. In their interactions with the public, school officials have found that many of their constituents often question the amount of time devoted to testing and are unsure of how to interpret the results. They believe that the public is not fully aware of the range of material on achievement tests, the skills that students are expected to demonstrate, and the inferences that test results can support. Furthermore, the public does not always see the link between assessment programs and school reform efforts. Helping the public better understand what is being tested and the rationale for testing could do much to garner public support for continuing to gather this information.
The release of NAEP items could also fulfill a second purpose. Even though the market basket set of items would be representative of NAEP, some state testing programs cover content similar to that assessed by NAEP. Therefore, NAEP's release of items could increase understanding of state and local assessments.
Curriculum specialists and school administrators observed that the release of a large number of items could stimulate discussion among teachers regarding the format and content of questions. Review of the items could facilitate discussions about how local curricula (particularly content coverage and the sequencing of course material) compare with the material covered on NAEP. Workshop speakers explained that it is often difficult to draw conclusions about their states' NAEP performance because it is not clear whether the material tested on NAEP is covered by their curricula or at which grade level it is covered.
State and local assessment directors suggested that a large-scale release
Page 65
of NAEP items and related test materials could improve state and local assessment programs. Many judge NAEP items to be of high quality. Allowing test developers to view large amounts of NAEP test materials could have a positive effect on the quality of item design for state and local assessments. Similarly, review of items by teachers could serve to improve classroom-based assessments.
While participants generally saw value in a large-scale release of items, some were concerned about the uses made of the items. Assessment directors and curriculum specialists worried that a large release might unduly influence local and state curricula or assessments. For instance, policy makers and educators concerned about their NAEP performance could attempt to align their curricula more closely with what is tested on NAEP. Because assessment, curricula, and instructional practices form a tightly woven system, making changes to one aspect of the system can have an impact on other aspects. Attempts to align curricula more closely to NAEP could upset the entire instructional program.
Percent Correct Scores
Nearly all speakers were skeptical about using percent correct scores to report performance and were doubtful that it would accomplish its intended purpose. Assessment directors and measurement experts commented that percent correct scores were not as simple as they might seem. For instance, would percent correct be based on the number of correct answers or the number of possible points? Furthermore, how could a percent correct score be compared to the main NAEP scale, given that main NAEP results are not reported on this metric? Several assessment directors commented that they had devoted considerable time to helping users understand achievement-level reporting and felt that their constituencies had become familiar with this reporting mechanism. Percent correct scores would require new interpretative assistance. In addition, while percent correct scores would be associated with the achievement levels (i.e., the percent correct at basic, proficient, and advanced), these percentages may not conform to public beliefs about performance at a given level. The percent correct required to be considered proficient, for instance, could turn out to be lower than the public would expect. Such a discrepancy could damage the public's opinion of NAEP.
Page 66
CONSTRUCTION OF THE CONSUMER PRICE INDEX MARKET BASKET
During the course of this study, the materials NAEP's sponsors provided to the committee described general ideas for the NAEP market basket but did not present firm proposals for its design. The committee believed it would be instructive to learn about summary indicators used in other fields. Because the NAEP market basket has been linked with the CPI from its inception, the committee thought it would be useful to learn more about how the CPI was constructed and how it might be applied in an educational setting. During the committee's workshop on market-basket reporting, Kenneth Stewart from the Bureau of Labor Statistics (BLS) described the processes and methods used for deriving and utilizing the CPI. Stewart's remarks are summarized below; additional details about the CPI appear in Appendix B.
Background and Current Uses of the CPI
The CPI is a measure of the average change over time in the prices paid by urban consumers in the United States for a fixed basket of goods in a fixed geographic area. The CPI was developed during World War I so that the federal government could establish cost-of-living adjustments for workers in shipbuilding centers. Today, the CPI is the principal source of information concerning trends in consumer prices and inflation in the United States. It is widely used as an economic indicator and a means of adjusting other economic series (e.g., retail sales, hourly earnings) and dollar values used in government programs, such as payments to Social Security recipients and to Federal and military retirees. The BLS currently produces two national indices every month: the CPI for All Urban Consumers and the more narrowly based CPI for Urban Wage Earners and Clerical Workers, which is developed using data from households represented in only certain occupations. In addition to the national indexes, the BLS produces indexes for geographic regions and collective urban areas. Compositions of the regional market baskets generally vary substantially across areas because of differences in purchasing patterns. Thus, these indexes cannot be used for relative comparisons of the level of prices or the cost of living in different geographic areas.
Page 67
Collection of Data on Consumer Expenditures
The BLS develops the CPI market basket on the basis of detailed information provided by families and individuals about their actual purchases. Information on purchases is gathered from households in the Consumer Expenditure Survey, which consists of two components: an interview survey and a diary survey. 3 Each component has its own questionnaire and sample.
In the quarterly interview portion of the Consumer Expenditure survey, an interviewer visits every consumer in the sample every 3 months over a 12-month period. The Consumer Expenditure interview survey is designed to collect data on the types of expenditures that respondents can be expected to recall for a period of 3 months or longer. These expenditures include major purchases, such as property, automobiles, and major appliances, and expenses that occur on a regular basis, such as rent, insurance premiums, and utilities. Expenditures incurred on trips are also reported in this survey. The Consumer Expenditure interview survey thus collects detailed data on 60 to 70 percent of total household expenditures. Global estimates—i.e., expense patterns for a 3-month period—are obtained for food and other selected items, accounting for an additional 20 percent to 25 percent of total household expenditures.
In the diary component of the Consumer Expenditure survey, consumers are asked to maintain a complete record of expenses for two consecutive one-week periods. The Consumer Expenditure diary survey was designed to obtain detailed data on frequently purchased small items, including food and beverages (both at home and in eating places), tobacco, housekeeping supplies, nonprescription drugs, and personal care products and services. Respondents are less likely to recall such items over long periods. Integrating data from the interview and diary surveys thus provides a complete accounting of expenditures and income.
Both the interview and diary surveys collect data on household characteristics and income. Data on household characteristics are used to determine the eligibility of the family for inclusion in the population covered by the Consumer Price Index, to classify families for purposes of analysis, and to adjust for nonresponse by families who do not complete the survey.
3 Much of the material in this section is excerpted from Appendix B of Consumer Expenditure Survey, 1996-97, Report 935, Bureau of Labor Statistics, September 1999.
Page 68
Household demographic characteristics are also used to integrate data from the interview and diary components.
Construction of the CPI Market-Basket System
The BLS prices the CPI market basket and produces the monthly CPI index using a complex, multistage sampling process. The first stage involves the selection of urban areas that will constitute the CPI geographic sample. Because the CPI market basket is constructed using data from the Consumer Expenditure survey; the geographic areas selected for the CPI for All Urban Areas are also used in the Consumer Expenditure survey. Once selected, the CPI geographic sample is fixed for 10 years until new census data become available. Using the information supplied by families in the Consumer Expenditure surveys, the BLS constructs the CPI market basket by partitioning the set of all consumer goods and services into a hierarchy of increasingly detailed categories, referred to as the CPI item structure. Each item category is assigned an expenditure weight, or importance, based on its share of total family expenditures. One can ultimately view the CPI market basket as a set of item categories and associated expenditure weights.
Updating and Improving the CPI Market Basket
Because of the many important uses of the monthly CPI, there is great interest in ensuring that the CPI market basket accurately reflects changes in consumption over time. Each decade, data from the U.S. census of population and housing are used to update the CPI process in three key respects: (1) redesigning the national geographic sample to reflect shifts in population; (2) revising the CPI item structure to represent current consumption patterns; and (3) modifying the expenditure weights to reflect changes in the item structure as well as reallocation of the family budget.
CONCLUSIONS AND RECOMMENDATIONS
It is apparent from the discussion in this chapter that all decisions about the configuration and features of the NAEP market basket involve tradeoffs. Some methods for configuring the market basket would result in simpler procedures than others but would not support the desired inferences. Other methods would yield more generalizable results but at the
Page 69
expense of simplicity. The simplest methods would use parallel short forms for data collection and observed scores for reporting, but this configuration may not yield forms and scores generalizable to the larger content domain. The most generalizable results would be based on a system of arbitrary forms with performance reported as the estimated proficiency score (i.e., latent trait estimates), as is currently done with NAEP. However, this is also one of the most complex configurations.
If NAEP's sponsors decide to proceed with designing a market basket, decision making about its configuration should be based on a clear articulation of the purposes and objectives for the market basket. The needs the market basket will serve and the intended uses should guide decisions about its features.
RECOMMENDATION 4-1: All decisions about the configuration of the NAEP market basket will involve tradeoffs. Some methods for configuring the market basket would result in simpler procedures than others but would not support the desired inferences. Other methods would yield more generalizable results but at the expense of simplicity. If the decision is made to proceed with designing a NAEP market basket, its configuration should be based on a clear articulation of the purposes and objectives for the market basket.
CPI Market Basket Versus A NAEP Index: Parallels and Contrasts
The task of building an educational parallel to the CPI is formidable and appears to differ conceptually from the current NAEP market-basket development activities. It is unknown how well the final market-basket instrument, in whatever format, will serve its major goal of better informing the American public regarding the educational accomplishments of its students. The eventual attainment of this goal must begin with a definition of educational accomplishments along with serious consideration of the psychometric properties of the instruments that must be in place to support the desired score inferences.
In considering the proposals to develop and report a summary measure from the existing NAEP frameworks, the committee realized that the proposals for the NAEP market basket differ fundamentally from purpose and construction of the CPI market basket. Although the NAEP frameworks are developed by committees of experts familiar with school-level curricula,
Page 70
they are not descriptive; that is, they are not based on surveys of what schools actually teach.
Implementing a market-basket approach for NAEP, analogous to that used by the CPI, would thus necessitate major operational changes. The design that would most directly parallel that of the CPI would call for surveying classrooms to determine the content and skills currently being taught to students. This is analogous to surveying households to find out what consumers are buying. In the CPI context, the household surveys create a market basket of goods. In the NAEP context, the surveys would lead to a “market basket” of instructional content that would need to reflect regional differences in what is taught. Test forms would be constructed to represent this instructional content and administered to evaluate students' mastery of the material. The resulting scores would indicate how much students know about the currently taught subject matter. Hence, if the NAEP market basket were constructed to parallel the CPI market basket, it would include items representing what survey data show is currently taught in classrooms.
CONCLUSION 4-1: Use of the term “market basket” is misleading, because (1) the NAEP frameworks reflect the aspirations of policy makers and educators and are not purely descriptive in nature and (2) the current operational features of NAEP differ fundamentally from the data collection processes used in producing the CPI.
RECOMMENDATION 4-2: In describing the various proposals for reporting a summary measure from the existing NAEP frameworks, NAEP's sponsors should refrain from using the term “market basket” because of inaccuracies in the implied analogy with the CPI.
RECOMMENDATION 4-3: If, given the issues raised about market-basket reporting, NAEP's sponsors wish to pursue the development of this concept, they should consider developing an educational index that possesses characteristics analogous to those of the Consumer Price Index: (1) is descriptive rather than reflecting policy makers' and educators' aspirations; (2) is reflective of regional differences in educational programs; and (3) is updated regularly to incorporate changes in curriculum.


