
4
The Navigation Feasibility Study
This chapter examines the economic, environmental, and engineering aspects of the U.S. Army Corps of Engineers' draft feasibility study of the Upper Mississippi River–Illinois Waterway (UMR–IWW) system, based on the most recent and complete information that was available to the committee. As mentioned, the committee reviewed and commented on a draft of the feasibility study, as well as on other important, supporting studies the committee was directed to by the Corps. The committee's report thus may not reflect the Corps' final navigation feasibility study.
As described in its charge, the committee focused its review on the Corps' economic analyses, as well as other relevant water resources planning considerations. Thus, most members of this committee were economists, and the committee devoted most of its efforts toward assessing the economics portions of the Corps' study. The Corps' draft feasibility study contained three main topical areas: economics, engineering, and environment (see Figure 1.2 ). The quality and detail of the analyses conducted within each of these topics varied. For example, the structure and logic of the economics sections were more coherent and more sophisticated than the environmental study components. This report's treatment of economics, engineering, and environmental issues in the feasibility study therefore reflects the committee's charge, the disciplinary expertise of committee members, and the varying levels of analysis between different sections of the Corps' draft report.
PROJECT SCOPING, ALTERNATIVES, AND INTEGRATION
Plan Formulation
The Principles and Guidelines require that combinations of measures be considered in order to identify the environmentally acceptable water resources development plan that produces the greatest net benefits to the national economy. Identifying this National Economic Development (NED) plan involves assessing the economic and environmental impacts of a range of different capacity-enhancing and demand-management measures, alone and in combination with other measures. It is important to recognize that the Principles and Guidelines also provide that. “Other plans which reduce new NED benefits in order to further address other Federal, State,
local, and international concerns not fully addressed by the NED plan should also be formulated” (US WRC, 1983).
As described in Chapter 3 , the 1970 Flood Control Act authorizes the Corps to consider navigation, flood control, and water supply project operation alternatives, as well as alternatives focused on improving environmental quality. However, the study purpose and scope in the UMR–IWW navigation draft feasibility study was framed in comparatively narrow terms (USACE, 2000b):
The Navigation Study is a feasibility study addressing navigation improvement planning for the UMR–IWW System for the years 2000–2050. This study assesses the need for navigation improvements at 29 lock and dam sites (35 locks) on the UMR and 8 locks on the IWW and the impacts of providing these improvements. More specifically, the principal problem being addressed is the potential for significant traffic delays on the system within the 50-year planning horizon, delays that will result in economic losses to the Nation.
The study was conducted to determine whether navigation improvements were justified and, if so, the appropriate navigation improvements, sites, and sequencing for the 50-year planning horizon. The feasibility study effort also included the preparation of a system Environmental Impact Statement (EIS) (USACE, 2000a).
This statement of study scope does not include consideration of alternatives aimed at enhancing environmental quality. Instead, it focuses solely on capital investments, with little attention devoted to facility operational alternatives. Moreover, environmental considerations are relegated to the status of constraints, rather than considered as planning objectives. The Corps thus ignored guidelines that allow them to address a wider array of environmental issues.
The committee notes that the Corps has recently addressed the extent to which environmental improvement may be used as a planning objective toward which alternatives may be formulated and evaluated. Chapter 2 of the Corps' Civil Works Planning Guidance Notebook defines a National Ecosystem Restoration (NER) objective, defining NER outputs as “increases in the net quantity and/or quality of desired ecosystem resources” (USACE, 2000a). This planning guidance was released well after the Corps began its feasibility study. Thus, rather than holding the Corps and the draft feasibility study to these recently-released standards, the committee suggests that this and other recent guidance be followed in future revisions to the feasibility study.
Another provision of this internal Corps planning guidance is the following:
Measurement of NER is based on changes in ecological resource quality as a function of improvement in habitat quality and/or quantity and expresses quantitatively in physical units or indexes (but not monetary units). These net changes are measured in the planning area and in the rest of the Nation. Single purpose ecosystem restoration plans shall be formulated and evaluated in terms of their net contributions to increases in ecosystem value (NER outputs), expressed in
non-monetary terms. Multipurpose plans that include ecosystem restoration shall contribute to both NED outputs and NER outputs (emphasis added).
In addition to these higher-level considerations of project scope, Chapter 2 of the Principles and Guidelines contains additional guidance on scoping and alternatives that does not appear to have been adequately considered in the UMR–IWW study planning process. As Chapter 3 described, the P&G provide abundant advice regarding nonstructural alternatives for helping relieve congestion on inland waterway systems. The Corps ' draft feasibility study, unfortunately, contains no explanation as to why these types of nonstructural alternatives were ignored (except for helper boats).
The P&G offer adequate flexibility for the Corps to investigate a wide range of planning options, as does the Corps' own internal guidance. It appears, however, that only a relatively narrow range of navigation project planning alternatives was considered in the draft feasibility study. As a result, the Secretary of the Army should ensure that the environmental consequences of proposed construction and operating practices be analyzed along with the National Economic Development account. In the committee's judgment, environmental issues will continue to grow in importance. By restricting its study to remediating the incremental changes caused by lock extensions, the Corps is creating future problems for the project. The Corps should address a wider range of environmental issues in the UMR–IWW feasibility study, rather than limiting the study to mitigating the environmental damage caused by lock extensions and the resulting incremental increases in barge traffic.
Given the relatively narrow range of alternatives considered for addressing waterway congestion on the UMR–IWW, Congress should instruct the Corps to first consider nonstructural options for improving traffic management as the baseline condition for the NED alternative. Lock extensions should not be considered until nonstructural measures for waterway traffic management have been examined thoroughly. A careful assessment of the benefits and costs of nonstructural options for improving waterway traffic should also be conducted.
Finally, the committee is concerned that possible enhancements of environmental resources on the UMR–IWW may not have been adequately considered. The Corps should thus reconsider the issues regarding problem/opportunity definition on the UMR–IWW.
The role of Congress is important in implementing this report's recommendations: full exploration of nonstructural approaches and proper inclusion of environmental assessments in the UMR–IWW feasibility study will require Congress to agree to this approach and studies, and then provide backing and adequate resources for the Corps to implement them.
Environmental Context of UMR–IWW Planning
The Corps' failed to consider explicit environmental improvements during the scoping processes in the UMR–IWW feasibility study. The Corps' draft study has been conducted
within the context of several programs for improving environmental research and quality in the Upper Mississippi River basin, including the federal Upper Midwest Environmental Sciences Center (formerly the Environmental Management Technical Center) in La Crosse, Wisconsin, the interstate Navigation Environmental Coordination Committee (NECC), and the interstate Upper Mississippi River Conservation Committee (UMRCC). Both interstate groups consist of representatives from state environmental protection and conservation agencies in the five upper basin states (Illinois, Iowa, Minnesota, Missouri, and Wisconsin). The Corps has been and continues to be instrumental in these programs: to date, the Corps has allocated more than $181 million to the Upper Mississippi River System Environmental Management Program and intends to allocate future resources to this program.
The Corps is not ignoring environmental considerations in the UMR –IWW system. The committee is concerned, however, that the outputs of these interstate and federal initiatives have not been integrated adequately into a “systems” view within the UMR–IWW study. A true systems view of the UMR–IWW would acknowledge that a thorough understanding of the current state of the Upper Mississippi River and floodplain ecosystem must be related to structural modifications in the Upper Mississippi River basin, to operations of the UMR–IWW navigation system, and to ecosystem responses to a range of natural and anthropogenic influences within the Upper Mississippi River basin. The feasibility study would also benefit from a clarification of the roles of the environmental studies in the decision-making process regarding lock extensions.
ECONOMICS
The Corps' economic evaluation of lock extensions consists of two basic activities. First, the number of barges expected to use the lock is forecast, along with the congestion or delays that this traffic is expected to experience at the lock. Second, projections of traffic volumes and delays are then translated into estimates of the national economic development (NED) benefits of the lock improvement. The committee generally supports the NED theoretical framework that the Corps uses to estimate the benefits of lock improvements, but it has serious reservations about the methods used to forecast traffic volumes at the lock, and the empirical model used to estimate benefits.
Traffic Demand Forecasts
Waterway traffic demand forecasts are central to economic evaluation of proposed navigation improvements on an inland waterway system. The higher the volume of traffic that might use the waterway, and the less sensitive that traffic is to barge tariffs or costs, the greater the potential NED benefits from increasing waterway capacity (all other factors being held constant). If traffic volumes are growing and are relatively insensitive to barge tariffs, then the waterway will become increasingly congested over time, and shippers, and the economy more generally, will benefit from capacity improvements. Conversely, the lower the traffic growth and the more sensitive shippers are to barge shipping rates, the lower the overall NED benefits.
As part of the UMR–IWW study, the Corps endorsed the use of spatial equilibrium models to estimate future levels of waterway traffic. Spatial equilibrium models recognize that freight flows represent a response to spatial variations in commodity prices and in the costs of transportation between points where prices differ. For example, Illinois corn is exported to Japan when the prevailing price of corn in Japan is high enough to cover the cost of buying the corn and then transporting it to Japan. The exports affect the supply and demand for corn in Illinois and Japan, driving corn prices up in Illinois and down in Japan.
In a key report of the UMR–IWW Economics Work Group (USACE, 1998), the Corps explained the advantages of a spatial equilibrium approach:
The consensus of this literature is that the economic impacts of transportation systems are best analyzed as components of larger spatial price economic models. Analyzing transportation systems or their individual components myopically can lead to erroneous conclusions regarding economic impacts and values of the transportation system and its components. Spatial price economic models may be characterized as models where consumer demands and producer's supplies of goods and services are identified by their location in spatially geographic regions called markets.
The Corps' endorsement of the theoretical concept of spatial equilibrium is commendable, because accepted theoretical concepts will form a more credible basis for benefit estimation than the approaches formerly used by the Corps. Unfortunately, possibly because of limited time and data, the specific models the Corps developed for waterway traffic forecasts in the UMR–IWW study are inadequate. The models failed to forecast the correct direction of grain exports between 1995-2000. Moreover, the models contain no structural variables (underlying forces that determine directions and levels of grain exports; e.g., weather, income, government policies, changes in technology, and others) that engender confidence in the models' projections beyond 2000. Indeed, the shortcomings are so serious that the current results from the export forecasting model and the empirical ESSENCE model (used to model waterway traffic, levels of congestion, and changes in shipping rates) should not be used in the feasibility study.
Steps in Traffic Forecasting
To understand the Corps' waterway traffic forecast models, it is helpful to separate the various components typically involved in traffic forecasting. For simplicity, we use the example of corn shipments, because corn, soybeans, and other agricultural products account for an important part of the traffic on the UMR–IWW. The same framework applies, with some minor modifications, to other types of commodities typically shipped on a waterway.
The barge traffic forecast for any given year can be viewed as involving the following five steps, as shown in Figure 4.1 (Beesley and Kemp, 1987; Meyer and Straszheim, 1971; Ortuzar and Willumsen, 1994):
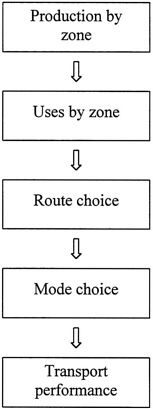
FIGURE 4.1 Typical steps in demand forecasting.
-
Forecast corn production in the area served by the waterway.
-
Forecast the uses and destinations of the corn. How much of the corn will be used as domestic animal feed, for example, and where are those pig farms located? How much will be exported and to which countries?
-
Forecast the routes by which the corn will be transported to its various uses. Will corn bound for export to Asia be shipped via New Orleans, for example, or via a West Coast port?
-
Forecast the mode, or combination of modes, that will be used to ship the corn on each route.
-
Forecast how the performance of each mode and route is affected by the traffic volumes carried. If large volumes of corn are moving through a waterway, rail line, or port, then congestion may increase, pushing up costs and transportation tariffs.
These five steps are described here sequentially, when in fact they are nearly simultaneous. For example, an Illinois farmer would not consider planting an acre of corn without some idea of the price likely to be received. In turn, that price depends on how that corn is likely to be used and what the costs of shipping the corn to market are likely to be. Moreover, the steps must all be
consistent with one another. For example, prices for corn in Illinois should reflect and be consistent with the costs of transporting corn to each market where it is sold. If the costs of shipping corn from Illinois were to rise significantly because of congestion on the UMR–IWW for example, Illinois corn might cease to be competitive on world markets. Illinois corn prices would have to fall to regain competitiveness in the world market, which would lower farm incomes and eventually lead to decreasing production.
Transportation forecasts usually have a high degree of spatial detail. The area served by the transportation facility is usually divided into zones, and estimates of production and uses (in steps 1 and 2) are provided for each zone. The analyses of the choice of routes and modes (in steps 3 and 4) and transport congestion and costs (step 5) are then done separately for each pair of zones that has traffic flowing between them. The more detailed the zone system, the more burdensome it is to calibrate and use the forecasting model. But because production, uses, transportation tariffs, and congestion can vary significantly over space, spatial detail is usually required to assure a reasonably accurate forecast.
Demand Models in the UMR–IWW Feasibility Study
The UMR–IWW feasibility study essentially divides the five steps described above into three groups (USACE, 1998):
-
steps 1 and 2 (forecasts of total production of the commodity and its uses and destinations),
-
step 3 (route choice), and
-
steps 4 and 5 (mode choice and transportation system performance).
Commodity Production and Uses
Corn and soybeans bound for export are the major commodities carried on the UMR–IWW; the Corps developed two methods to estimate these flows. The first forecasts were based on projections of the amount of acreage along the waterway that would be planted in these crops and of the yield per acre of those crops (based on past years and projections). Estimates of domestic consumption of these crops were derived from historical trends in domestic consumption for various uses. The difference between production and domestic consumption was assumed to be exported. When this approach was shown to overestimate recent exports, the Corps' consultants (Jack Faucett Associates (JFA) of Bethesda, MD) instead adopted projections of agricultural exports for the region prepared by the U.S. Department of Agriculture (USDA) (JFA. 2000).
Route Choice
Spatial equilibrium models examine the routes between the origins and destinations of the commodities to be shipped. However, the major routing issue in the UMR–IWW draft study is whether the corn and soybeans exported from the study area will be exported through the ports on the Gulf of Mexico, U.S. West Coast or the U.S. East Coast. The Corps assumes that each port will retain its historic share of exports from each agricultural producing area. In practice, this means that almost all the corn and soybeans exported from the UMR –IWW study area will continue to pass through the port of New Orleans.
A spatial equilibrium model answers these questions without the need to make an assumption about the share of each port. Having decided to use a spatial approach, it is unclear why the Corps decided to abandon the spatial model in favor of historical trends.
Mode Choice and Transportation Congestion
Forecasts of commodity flows by route are inputs into ESSENCE, a simulation model that forecasts how much of the traffic will be carried by barges, the levels of waterway congestion, and the resulting increase in barge costs. The ESSENCE model describes the performance of the waterway system in great detail, but it makes rather simple assumptions about alternative modes of shipping. The ESSENCE model has two main components 1 :
-
a lock performance submodel that calculates delays and barge costs as a function of traffic levels at the locks, and
-
a waterway market share submodel that calculates how much of the traffic moving in the corridor served by the waterway will be carried by barge.
ESSENCE is implemented using an Excel spreadsheet, and these two submodels are reconciled using Excel's “solver” function. The market share submodel assumes that certain towboat movements that do not pass through any locks are not sensitive to lock congestion. In addition, shipments moving by rail—where rates are below barge rates—are not sensitive to waterway congestion because they move by rail. For all other movements, the tonnage using the waterway in the forecast year, Q, is assumed to be a function of the relative tariffs for barge and the next-best-alternative mode:
Q = [(R - y) / (R - W0)]N * Q0 (4.1)
In equation 4.1, R is the rate for the alternative mode, and the maximum that the barge company can charge, y is the estimated barge tariff, W0 is the observed barge tariff in the base year (1994), Q0 is the estimated tonnage that would be carried by barge in the forecast year if barge rates remained at W0, and N is an empirically determined constant.
|
1 |
There is a third component that calculates the net economic benefit from the waterway. |
The sensitivity of waterway tonnage to barge tariffs depends strongly on the values of R and N (see Figure 4.2). R sets an upper bound on the tariffs that the barges can charge while N determines how sensitive levels of barge tonnage are to changes from the base year barge tariff, W0. If N is greater than 1, barge traffic is very sensitive to changes in tariffs around W0, but if N is less than 1, barge traffic is relatively insensitive.
Strengths of the Corps' Models
The demand models the Corps developed for the UMR–IWW feasibility study represent important advances over past Corps practice. In particular, using a systems approach in which improvements to all locks in the system are considered simultaneously, with consistent input data and with explicit consideration of project timing and other interdependencies, is commendable. Investment decision studies of comparable geographic and temporal scope are (unfortunately) rare for other freight transportation modes. Also, the recognition that a shipper's willingness to pay for navigation services is more complex than simple next-least-expensive mode calculations, and that it might even involve alternative markets or other types of business decisions, is an advance over previous methods. These theoretical developments are most welcome, and efforts to transform these concepts into useful decision support models should continue.
Weaknesses of the Corps' Models
The Corps' models should be improved in four areas: (1) the forecasting of domestic and foreign commodity production and use, (2) determining the sensitivity of waterway tonnage to barge tariffs, (3) calculating NED benefits, and (4) modeling lock congestion. All four areas affect the results of the evaluations of improvements on the Upper Mississippi River–Illinois Waterway, but the first two are particularly important.
Forecasts of Domestic and Foreign Commodity Production and Use
The Corps' initial forecasts (JFA, 1997), and the USDA projections (on which the Corps now relies) of U.S. crop production, consumption, and exports are based largely on simple extrapolations of past data. The initial projections of grain transported and exported were made in 1994. The 1995–2000 forecasts were incorrect; in fact, these forecasts called for increases in grain exports, but total exports of corn and wheat trended downward for this five-year period, with an expectation for continued declines in the near term. This led the committee to have no confidence in the forecasts beyond 2000. This model assumes that importing countries will buy all residual U.S. grain supplies remaining after domestic consumption. These exports were then allocated to importing countries based on historical shares.
The most recent projections used by the Corps are USDA projections (USDA, 2000) that are also based on extrapolating past production, consumption, and exports into the future. Nei-
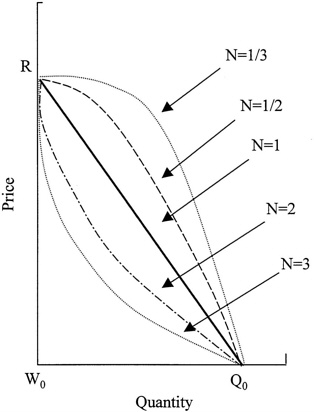
FIGURE 4.2 The Barge Shipment Demand Curve in the ESSENCE Model. SOURCE: USACE, 2000a.
ther the initial JFA projections nor the large-scale agricultural sector models—including the USDA model—adequately recognize world supply and demand factors. As a result, the export forecasts and projections do not fully recognize recent huge increases in world grain production. These forecasts underestimate the impacts of new technologies (e.g., biotechnology, irrigation, mechanical and chemical inputs) adopted around the world, as well as the expansion of agricultural lands in South America and in the rest of the world and the increasing resistance of consumers to genetically modified grains. These forecasts implicitly assume that all grain exports are in the bulk form (i.e., not packaged). Increasing exports of high-value grains and grain products are typically shipped in containers by rail to East Coast or to West Coast export ports and are not available for barge movements. Major exceptions include high-oil corn and white corn.
Models that base projections largely upon past trends, without adequately accounting for changes in supply and demand for grain in the rest of the world, do not provide reliable forecasts. The Corps' model failed to recognize shifts in importing country demands. For example, recent increases in meat exports from the United States to Japan, Taiwan, and South Korea are direct
substitutes for U.S. corn exported to these three nations that are the largest importers of U.S. corn. This substitution is occurring as these three countries decrease the number of animals fed (because of outbreaks of contagious foot-and-mouth disease) and as feed efficiency increases in livestock production (a result of confined animal feeding operations and improved feed formulation).
Jack Faucett Associates was asked to determine whether the difference between the actual and initial forecasted exports was the result of short-term phenomena or long-term trends. JFA identified the short-term phenomena that affected the export volumes from 1995–2000. The Mississippi River floods of 1993, the loss of acreage planted because of the flooding, the closing of the river to navigation during the 1993 floods, and “hot spots” in grain shipments were all identified as short-term phenomena not likely to reoccur. The Asian financial crisis of 1997, an increased world supply of grain, and restrictions on grain exports to Europe were also offered as rationale for decreased or steady volumes of barge traffic.
But the fact that the fastest-growing market for U.S. corn is the domestic market, including uses such as wet and dry corn milling and increased usage of corn as animal feed (USDA, 2000), was not acknowledged. Furthermore, rapid growth in grain production in the rest of the world (because of increased yields per acre and increased acreage) is clearly reducing U.S. export growth potential. The evaluation of long-run versus short-run impacts seemed to ignore such trends.
JFA abandoned its initial method and projections and substituted extrapolations of USDA corn and soybean export projections. The basic premise of this attempt is inappropriate. In fact, in its initial report, JFA downgraded the USDA Baseline Projections to 2005 by stating, “The USDA further states in this publication that the projections are not intended to be a Departmental forecast of what the future will be, but instead a description of what would be expected to happen with an extension of 1990 agricultural law as amended. These statements are reflective of existing long-term materials to which comparisons might be made and also indicative of the problems in doing so” (JFA, 1997). Yet, JFA relied almost solely on this projection for its second set of forecasts. For years, the USDA has stated that their projections are not forecasts. Instead, it is a conditional, long-run scenario about what would be expected to happen under the 1996 Farm Act and specific assumptions about external conditions. This procedure ignores a downward trend in U.S. grain exports since 1980.
JFA's second set of forecasts is tempered by the supply and demand conditions offered by the USDA, even though these conditions are assumed to exist for only the next 10 years. However, the second set of projections for 50 years into the future was obtained by simply extrapolating the 10-year USDA projections an additional 40 years. An additional problem is that the forecast is affected by the choice of which data to use for the regression analysis. Moving the baseline year toward the present results in a forecast of low traffic growth. When an arbitrary decision as to which year to use as a baseline has a substantial effect on forecasts, one clearly cannot have confidence in the forecast.
There is no economic, statistical, theoretical, or empirical basis for extrapolating the USDA projections. A spatial equilibrium model, including detailed supply and demand functions for individual importing and exporting countries, is an integral part of this modeling analysis. This would likely require major modifications of existing large-scale agricultural sector
models, supplemented by inputs from advisory groups and verified by sophisticated trend analyses.
Sensitivity of Waterway Tonnage to Barge Tariffs
Another serious problem is that there is little empirical basis for the Corps' estimate of how much of the grain will moved by barge, and how this will be affected by waterway congestion and the consequently higher shipping costs. The Corps' calculation is based on the ESSENCE model, which assumes an unusual functional form to forecast demand for barge transportation, as shown in Equation 4.1. The form is not necessarily wrong, but because it is unusual, it is harder to compare it to more conventional formulations and to understand the implications of different values of its parameters.
Corps economists originally argued that N in equation (4.1) was likely to be equal to 2. based on elegant but simple reasoning about the spatial distribution of commodity prices near a waterway. The economists hypothesized that agricultural products are loaded at a point on the waterway and that the point is surrounded by farmland producing a constant yield per acre. Each farmer has a choice between shipping the crop to export from the waterway port and selling it for local uses. If the costs of transporting the product to the port are proportional to the distance between the farm and the port and all farmers have the same alternatives, then the area shipping to the port will be a circle centered on the port. The size of the circle will expand or contract as barge rates at the shipping point fall or rise. Because the amount shipped on the waterway is proportional to the area of the circle, this implies that N is 2.
Although the reasoning is elegant, some of the assumptions used are not realistic. If loading points are close, for example, then the drawing area (the trade area in which transportation costs to a given loading point are lower than those to any other loading point) for each river port cannot be a circle, because the drawing areas will overlap—which implies a lower value of N. Similarly, the costs of transporting the grain to the loading point are not proportional to distance, because the loading–unloading charge is fixed. Finally, the supply of grain is not uniform across all farms, and the farmers face somewhat different local alternatives. Theoretical issues aside, the important issue is that the Corps made no effort to assure that its assumptions about N were consistent with historical data on shipper behavior. Studies based on actual shipper behavior suggest that, contrary to the ESSENCE model, price responsiveness of freight demand varies greatly by commodity and by location (Small and Winston, 1999).
The ESSENCE model implies that farmers that will choose to ship by barge lie within a circle centered on the loading port. As relative barge rates decline, the radius of the circle expands, since farmers further from the port can afford the shipping costs to the port, and vice versa. ESSENCE also implies that farmers close to the port (well inside the radius of the circle) are insensitive to price, since it is cheaper for them to ship by barge. Similarly, farms far away from a port (well outside the radius) are insensitive to price since they will almost never ship by barge. However, farmers that find that the cost of shipping by barge is almost identical to shipping by a different mode (or selling the corn for a purpose other than export) are extremely sensitive to small changes in price, such as that from one month to another.
Alternative Demand Curve Specifications, Willingness to Pay Concepts, and Calculation of NED Benefits
The ESSENCE model assumes that every shipment is sensitive to price, with an even distribution of willingness to pay (WTP) from the maximum willingness to pay (usually the alternative mode shipping cost) down to the market price of barge service. This contrasts with prior approaches, where each shipment that uses the barge mode is assumed to have the maximum willingness to pay. This maximum is usually assumed to be the alternative mode cost.
The Corps is to be commended for adopting a model where barge demand is modeled with users having a distribution of willingness to pay. However, we note that this distribution is assumed rather than measured. In fact, the Corps has stated that no study resources were directed toward identifying the distribution of willingness to pay for commodity movements. This is a crucial omission. Obtaining data on the actual willingness to pay distribution is of high priority, because so much of the estimated benefit comes from the willingness to pay calculation. This benefit estimate should be based on data, not just unsupported theory.
Although the Corps endorsed the theoretical concept of a spatial equilibrium model with multiple origins shipping to multiple markets, linked together by commodity prices and transportation rates, these fundamental concepts are missing from the ESSENCE model. The only market in the ESSENCE model is New Orleans, Louisiana. The model contains no specific production areas, no alternative markets, and no market prices. Because there are no specified production areas, the model cannot link the production areas with alternative markets, including New Orleans. Thus, the ESSENCE model is not a spatial equilibrium model.
To conduct a meaningful analysis, it is important to include sub-regions in the study area that are connected by transportation costs/rates to various markets. One would expect each region to be linked by rates and prices to all alternative markets. When river traffic, congestion, and barge rates increase, it may be best to ship by alternative modes or to alternative markets. If a model does not allow for this to occur at numerous sub-regions throughout the study region, the resulting analysis will not be meaningful.
A major reason for the failure to include alternative modes, markets and routes, was the lack of appropriate data. Some of the problems with the data used in the grain export analysis in the UMR–IWW draft feasibility study are described below.
Origin Data. The ESSENCE model includes no information on specific origins (e.g., points from which grain is shipped). Rather, the quantities of corn, wheat, and soybeans are, in effect, piled at one location at each navigation pool. In the real world, the farmer makes the first decision that determines grain flows. Because there are no specific origins in the ESSENCE model, the impacts of the initial logistic decisions on lock extensions cannot be estimated.
Alternative Ports. Although the Corps allocates the historical shares of exports to other export ports, there are no alternative markets that include export ports in the ESSENCE model. Because the New Orleans market is the only port of export in the model, the model does not allow shippers to react to congestion by shipping to other markets. Because the cheapest way of relieving congestion may be to ship to other markets, ESSENCE probably tends to overstate the estimated costs of congestion.
Market Prices. Failure to include alternative markets in the model means that one of the two principal determinates of grain flows—prices—was not permitted to function in the model to determine grain flows.
Transportation Rates. The transportation rates used in the ESSENCE model are based on a confusing combination of rates and estimated costs (TVA, 1996). The Corps' Rock Island district office contracted with the Tennessee Valley Authority's (TVA) Water Resources Project and Planning Division to provide rate analysis for the UMR–IWW draft study. Estimated barge rates for grain and feed ingredients were correctly based on “percents of tariff” from the Waterway Freight Bureau Tariff 7 (this tariff was canceled, but the percentages of rates from this tariff have been the standard basis trading benchmarks since July 1979). However, the TVA “purged the data of anomalous or transitory influences. As part of all shipper surveys and interviews, respondents were directed to ignore temporary market disruptions and provide information reflective ofs ‘normal' operating conditions” (TVA, 1996).
These comments notwithstanding, the only normal thing about barge rates is their variability. The Tennessee Valley Authority, however, removed all variability in the barge rate data. In reality, barge rates generally vary from 80 percent to 400 percent of the tariff (Merchants Exchange of St. Louis, 1979). Except for areas close to the Mississippi River, barge rates above 180 percent are typically higher than rail rates. These high barge rates often create huge temporary demands for rail cars. A classic example of high barge rates and rail car shortages occurred in the last half of 1995 and the first quarter of 1996. Barge shipping rates were higher than rail shipping rates during this entire period. Because barge rates are usually lower than rail rates, removing the barge rate variability essentially assumes that rail rates will always exceed barge rates. Because actual barge rates are often above rail rates, an assumption that this is not the case will result in overestimating the NED (since the assumption will divert actual traffic from rail to barge).
Railroad rates were obtained from a nonrandom sample of shippers and receivers, apparently mostly barge shippers and receivers. However, because much of the rail rate data were incomplete, rail rates were also estimated using the Reebie Rail Costing Model (Reebie Associates, 1999). These estimates were “inflated to reflect rail carrier market power in order to produce a final estimate of the most likely tariff ” (Reebie Associates, 1999). However, the TVA report did not specify what it meant by market power or what procedures were used to adjust the rail rates used in the ESSENCE model. This problem might have been avoided by extracting railroad rates from published railroad tariffs available on the Internet.
That report further states that the lower of the tariff rate or the estimated rail rate was actually used in the analysis (the tariff rate is a publicly-posted price available to all takers who are able to meet conditions specified in the tariff, such as size and time of shipment, on a take it-or leave it basis). However, it is not clear to the committee how the TVA could compare estimated rates with “incomplete information” rate data to select the appropriate rail rate for inclusion in the model. Moreover, the TVA analysis excluded new railroad technologies in the railroad rate analysis. For example, the TVA excluded contract rates—the dominant rail rates used in much of the U.S. Midwest—guaranteed car supply agreements, shuttle and cycle train rates, new and larger covered hopper rail cars, and new highly fuel-efficient alternating current railroad loco-
motives. Failure to include these technical and pricing innovations biases the rail rates upward and overestimates the NED benefits.
Matching Rates and Quantities. The greatest problem with the data on quantity (of grain shipped by barge) and rates (rates charged for those shipments) is that the quantity data are for 1991 and the rates charged are from September 30, 1994. Thus, the quantity and rate data used in the ESSENCE model do not match. The 1991 quantity data are the result of a different set of rates than those used in the model, and the 1994 rate data generated a different set of quantities than the 1991 quantities used in the model. There is thus no meaningful relationship between the quantity and rate data. In this instance, the 1991 and 1994 data were significantly different, but this is beside the point. The point is that a demand curve cannot be properly constructed with price and quantity data from different years.
Lack of Intra-annual Rate Variability. Barge and rail transport rates, and quantities shipped, often vary enormously within and between years. Yet the rate data used in the ESSENCE model are for one day—September 30, 1994. Given the huge variability in rates and quantities within years, the data should have been collected for and the model run for several time periods within each year. Failure to allow for rate variability eliminates the possibility of barge rates exceeding rail rates in the model and biases the calculation of NED benefits upward.
Absence of Spatial Data. A major reason for the absence of spatial equilibrium characteristics (e.g., no specific origins of grain in the model) in the ESSENCE model was that the Corps did not identify and estimate supplies of grain available in local areas. The Corps also did not:
-
collect rate data from local supply regions to alternative markets,
-
collect price data at alternative markets to enable local supply regions to select the most profitable markets at different time periods within the year, and
-
specify maximum quantity constraints at nonbarge alternative markets.
Nonagricultural Commodities. As is true for agricultural shipments, the ESSENCE demand equation was used to forecast waterway transport demand for nonagricultural commodities as a function of the alternative mode rate and the water transportation rate. The two basic inputs to this process are the other mode cost (i.e., rail) and the demand curve N value (see equation 4.1). Other-mode costs were estimated by TVA, based on in-depth analysis of a sample of existing UMR–IWW waterway shipments. For each shipment, TVA relied on industry data and published rates, supplemented by a total cost assessment that included load/unload costs, linehaul rates, and handling costs. In all cases, rail, truck, or combination moves were analyzed as the other mode, with allowances for modal access conditions at each end of the existing water move. In some cases, combination land-water moves, or moves to alternative destinations, were analyzed as the next-lowest-cost alternative. The sample results were used to develop linear regression models for extrapolation of the sample results to the population of all waterway movements. Unfortunately, the data used in the mode and route analysis for nonagricultural products suffer from many of the problems encountered in the grain analysis, including:
-
Estimated barge costs, rather than actual barge rates, were used. Fewer than 35 barge companies operate covered hopper barges (CHB) on the Mississippi River system, and five of these firms operate almost 70 percent of the CHBs. One of these companies operates about a third of the CHBs. These market shares indicate a moderate level of concentration for barge transport. Rail transport operations are more concentrated. While there are approximately 350 railroad companies in the U.S., about 95 percent of the nation's grain shipped a significant distance is carried by the top five large, Class I railroad companies. This high concentration in the railroad industry and the moderate concentration in the barge industry means that neither industry is close to being purely competitive. Therefore, long-run marginal costs are not a reasonable proxy for rates.
-
Barge companies may be comparatively few (and continue to decline to number), but a particular barge-loading elevator typically has access to more than one barge company on the Upper Mississippi River. While inland country grain elevators typically have access to only one railroad (if at all), they have access to many trucks (trucks are today have the largest share of grain shipments of all three modes). This certainly provides major competition to those railroads that serve inland country grain elevators. Rail rates were estimated from the Reebie Rail Costing Model plus a markup based on shipper information and/or the Interstate Commerce Commission (ICC) Waybill Sample data. It is not clear to the committee how shipper information could be used to determine railroad markups. Moreover, the ICC and the Surface Transportation Board (the successor to the ICC) specifically state that waybill data should not be used to make rate comparisons because of disguised rail rates in the sample. Grain sales and shipment decisions are made on the basis of commodity prices and transportation rates, not long-run railroad, barge, and truck marginal costs. Although long-run marginal costs may approximate truck rates because of the large number of trucking companies, they certainly do not approximate rail or barge rates.
-
Rate and quantity data that do not match temporally. The quantity data are based on a sample of 1991 shipments whereas the rail and barge rate estimates were for September 30, 1994. This distorts the demand curve for barge traffic. A meaningful economic analysis requires that the rate and shipment data be for identical time periods.
-
Exclusion of technological innovations and the impacts of regulatory changes on rail operations and pricing biases rail rates upward.
-
No alternative origins and/or destinations are considered.
-
No transportation rates to or from the alternative origins or destinations are considered.
Another important issue is whether the analysis properly captures actual alternatives faced by waterway shippers. If the waterway were not available, would shippers shift to the next-lowestcost mode, and if so, would they continue to ship the same quantity? If this is really the shipper's second best choice, then the other-mode cost is the willingness to pay, and the NED benefit of the waterway is the applicable consumer's surplus (i.e., willingness to pay minus water equilibrium price). However, the shipper has other alternatives: ship the product to another market or sell it for another use, produce less, or even go out of business if the other-mode cost is too high. The highest net revenue from these other responses defines the actual willingness –to pay for this shipper. Again, this is an empirical question. All real alternatives to shipping by water have a net revenue that can be estimated.
There are some data, based upon historical experiences with lock chamber closures for rehabilitation projects, that shippers will continue to ship by water even in the face of higher prices and that shippers will even shift to the next-higher-cost mode in order to keep shipments arriving at their production or export facilities. However, these are short-run responses, and there are no known long-run responses, as data on shipper impacts were not collected in those few instances where a waterway was entirely or partially closed to commercial navigation.
The data requirements for the draft navigation feasibility study are large and could be very costly. A crucial aspect of planning the study is for the Corps to allocate its resources carefully among the study components and to assess whether to request additional funding because important data cannot be acquired with current funding. In many instances within the navigation study, the Corps made good decisions about allocating study resources. In some instances, however, data were gathered that were of little use in evaluating the benefits and costs of lock extensions. For example, the rate and quantity data for different years were of no use in the study, as no inference can be drawn from these data. Much of the data collected for the environmental studies were also of very limited value: while some of the individual environmental studies may have been scientifically sound, it is not clear how the results from those studies affect the decision regarding lock extensions. This committee was not charged to design the best way to conduct a $50 million study, nor were resources made available to do so. We can only point out that the Corps did not always spend its money wisely and specify the additional data that are needed.
Modeling Lock Congestion
The Corps used a relatively simple queuing model to represent the increase in delays at UMR–IWW locks in response to traffic increases. However, most of the Corps' district and division offices and research centers have determined that simulation modeling (rather than queuing theory) is the preferred approach to analyzing lock performance, and that it canaccount for the mix of vessel types and operating phenomena that occur. Several such models are available (e.g., Dai, 1993; USACE, 1993). With a series of locks 10–30 miles apart, and with most traffic attempting to pass through these locks without interruption, random arrivals assumed in the Corps' queuing model do not match the actual traffic pattern. Finally, simulation models are much better suited for determining benefits of operational improvements (such as lockage scheduling or industry self-help), as suggested elsewhere in this report. It is unlikely that a queuing model will be able to provide good delay-reduction estimates for these types of measures.
Treatment of Uncertainty
The inherent uncertainties in forecasting barge shipments up to half a century into the future are well known ( Box 4.1 describes problems caused by placing too much faith in waterway traffic projections). Without treating uncertainty explicitly, the Corps ' analysis might conclude that the benefits of extending locks on the UMR–IWW are 10 percent greater than costs,
|
BOX 4.1 UNCERTAINTIES AND COMPLICATIONS OF WATERWAY TRAFFIC FORECASTS Waterway Traffic Projections on the Mississippi River: The Lock 26 Replacement Project The Lock 26 replacement project, which constructed Melvin Price Lock and Dam, is a mixed story in terms of the ability to forecast waterway traffic levels. Table 4.1 compares the actual traffic passing through Melvin Price's two lock chambers in 1999 to two projections, the first made in 1975 and the second made in 1982. TABLE 4.1 Projected Traffic Flows Through an Expanded Lock 26 vs. Actual 1999 Traffic Flows
Source: 1975 Projected traffic flows complied from Corps of EngineersLock and Dam 26. Replacement Design Memorandum No. 11, Vol. 1, Table3-52, as quoted in U.S. Department of Transportation, The Replacement of Alton Locks and Dam 26: An advisory Report of theDepartment of Transportation to the Senate Commerce Committee, 1975,p. 13. The 1999 figures are interpolated from 1985 and 2000 trafficprojection. The 1982 projection from Technical Report A, Navigationand Transportation, Comprehensive Master Plan for the Managementof the Upper Mississipi River System, prepared for the Upper MississippiRiver Basin Commission by U.S. Department of Army, Corps of Engineers.Figures are an interpolation of 1990 projections from Table 1.8 and2000 projections from Table 1.9. The 1999 actual tonnages are fromCorps of Engineers, U.S. Waterway Data, Lockage Statistics. Table 4.1 shows that both the 1975 and the 1982 projections greatly overestimated the amount of traffic that actually passed through Lock 26 in 1999. Traffic was expected to be 63 percent higher in 1999 than it actually was. The source of the overestimate of traffic is different between the two years. The 1975 projections of grain movements through Lock 26 were absolutely on target, with 44 million tons of grain projected to move through the expanded lock and 44 million tons actually moving through the main and auxiliary chambers. The reason that the 1975 forecast missed the target so badly was that projections of other types of traffic were not as accurate. A particular disappointment is that only one-tenth as much petroleum and petroleum products actually moved through the system as was expected. In fact, only half as much petroleum moved through Lock 26 in 1999 as was moved through the old unexpanded lock in 1966. Industrial chemical movements also declined after 1966 rather than increasing, as was expected. Coal movements in 1999 were at the same level as 1969, rather than more than doubling as forecast in the original traffic projections. |
||||||||||||||||||||||||||||||||
|
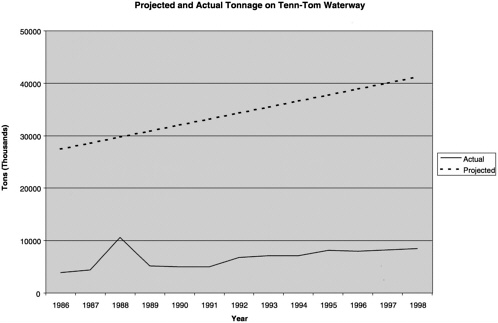
Lower Mississippi have attracted the limited amount of Kentucky coal traffic to the more circuitous route. In the project's first year of operation, only 500,000 tons of coal were shipped on the canal, rather than the 17 million tons that had been forecast. In 1998, coal tons on the Tennessee–Tombigbee had increased to 2,500, but the short-fall between actual tons and projected tons, which were expected in the original traffic projection to grow rapidly, continues to increase. The main commodity shipped on the Tennessee –Tombigbee waterway today is wood chips, not coal. Criticisms of the Tennessee–Tombigbee navigation project rest squarely on overly optimistic traffic projections. In order to avoid such problems in the future, waterway traffic projections for new projects should be examined far more carefully to eliminate the possibility of upwardly biased forecasts. |
and that construction needs to begin in 2001 in order to help grain farmers avoid the high barge rates that will make them less competitive in the world market. An uncertainty analysis might lead to the following conclusion (this is purely hypothetical, as the committee did not conduct its own uncertainty analysis): there is a slightly greater chance (55 percent) that benefits will exceed costs, rather than the reverse (45 percent). Greater information about the nature of the uncertainty comes from the distribution: it is somewhat likely (10 percent probability) that lock extensions would have costs 70 percent greater than the benefits, or that benefits would be 20 percent greater than costs. The extended locks might have annualized benefits greater than annualized costs as early as 2015 or as late as never.
For example, the initial analysis done by the Corps relied on forecasts by Jack Faucett Associates for the period 1995–2045 (JFA, 1997). However, the first five years of this forecast—the period in which forecasts would be expected to be the most accurate—show falling, rather than rising, exports. In an analysis that does not treat uncertainty explicitly, this forecasting failure is shocking and casts doubt on the entire analysis. If the uncertainty analysis encompasses the possibility of declining use during a period, the analysis would be more credible.
Another example is the construction cost of Lock and Dam 26 (Melvin Price Lock and Dam) at Alton, Illinois. Originally budgeted to cost $350 million, the final cost of Lock and Dam 26 was $1.05 billion. The Corps has a standard contingency of 25 percent for cost overruns. Without an explicit uncertainty analysis concerning costs, Congress might conclude that the Corps cannot do competent engineering, or at least cannot estimate costs competently. The committee understands that other factors entered to increase the costs almost 3-fold. However, for large construction projects, particularly ones that involve environmental considerations, delays and project changes are likely and which almost inevitably increase the costs. An explicit cost analysis informs Congress and other parties about what might occur. If setting out the uncertainties explicitly erodes support for the project, perhaps the project should not have been built.
The fault lies not in getting the forecasts wrong. It is impossible to accurately forecast barge movements 50 years into the future or to forecast the costs of a large construction project. Rather, the fault lies in not treating the forecasts as highly uncertain. In Chapter 5 , we set out the current state of the art in modeling the uncertainty associated with forecasting future events. Comparing the year 2000 actual barge movements with the forecast movements, or the forecast costs of building Lock and Dam 26 with actual costs, is humbling for the analyst. We point out the differences not to imply that Corps analysts are deficient, but rather to point out the inherent
uncertainty in these forecasts. The differences point out the need for explicit treatment of uncertainty, with full recognition that it is impossible to predict the future with precision. Rather than setting out precise values for future barge movements and other relevant events, the Corps should have examined the uncertainty explicitly, commenting on the range of values and the conditions under which demand was high enough to lead benefits to exceed costs.
ENVIRONMENT
In 1991, following the initial reconnaissance studies conducted on the Illinois and Mississippi rivers, the Corps determined that the UMR–IWW navigation draft feasibility study would take a system-wide approach in addressing navigation problems common to both the Illinois and Upper Mississippi waterways. However, instead of examining adverse environmental conditions created by the existing navigation system and proposed improvements, the Corps chose to focus narrowly on only those effects associated with increases in barge traffic. However, it bears repeating that the 1970 Flood Control Act does not require the Corps to seek improvements in environmental quality when it considers changes in existing project operations. Rather, the 1970 act authorizes the Corps to seek these improvements as they see fit.
In the early 1990s, there were requests to broaden the scope of the environmental studies, including a request from the Navigation Environmental Coordinating Committee to assess the long-term impacts of operating and maintaining the navigation project on the Upper Mississippi River. The Corps' justification for limiting its environmental analysis to incremental effects of additional waterway traffic was apparently fiscal in nature: “A broader multipurpose environmental effects study proposed by a number of agencies and organizations would require a 50/50 cost sharing by the states or other sponsors” (USACE, 2000b, p. 9).
In the Corps' draft navigation feasibility study, environmental components were developed to meet specific planning objectives consistent with the Corps' analysis of the navigation system, and consistent with the analysis of incremental effects of increased barge traffic on river ecology. The primary environmental objective was to assure that any recommended actions were consistent with protecting the nation's environment by avoiding, minimizing, or mitigating significant environmental, cultural, or social impacts. This objective was subject to a planning constraint that directed environmental investigations specifically to assess impacts of the construction and to assess incremental traffic effects of any potential navigation improvements (USACE, 1997b). Other environmental investigations and studies also were considered separate from the draft navigation feasibility study.
Environmental studies tasks in the navigation feasibility study included (1) developing data management/mathematical modeling strategies for extrapolation of impact data to the Upper Mississippi River system, (2) analyzing physical effects of field data previously collected by the Illinois State Water Survey, (3) conducting physical effects studies at the Corps' Waterways Experiment Station in Vicksburg, Mississippi, (4) evaluating navigation traffic effects on sedimentation of side channels and backwaters and on bank erosion, (5) developing a geographic information system (GIS) database covering representative river reaches and habitats, (6) evaluating navigation impacts on fish, wildlife, and biota, including plants and mussels, and (7) comparing
the impacts of recreation craft with commercial navigation impacts (USACE, 2000b). Fiscal constraints required prioritization of study efforts and elimination of lower-priority studies (Figure 1.2 illustrates cost estimates for the various components of the feasibility study).
The feasibility study has been conducted on a river system that has been the subject of many environmental studies and assessments. There is a long history of physical, chemical, and biological studies for both the Upper Mississippi and Illinois rivers (Belrose et al., 1979; Galloway, 2000; Hart, 1895; Nelson et al., 1998; Scarpino, 1985; Sparks, 1977). For example, the Upper Mississippi River Basin Commission conducted studies and developed a master plan to help the U.S. Congress resolve conflicts between commercial navigation and other groups and interests in the region (UMRBC, 1982). The Upper Mississipp River Basin Commission master plan recommended a habitat rehabilitation and enhancement program, a long-term resource monitoring program, a computerized inventory and analysis system, and recreation projects.
The 1986 Water Resources Development Act (WRDA) responded to these UMRBC recommendations by establishing the Environmental Management Program (EMP) for the Upper Mississippi River. As mentioned in Chapter 1 , two of the main programs within the EMP are habitat restoration and ecosystem monitoring (the latter is known as the Long Term Resource Monitoring Program, or LTRMP). The Corps is responsible for habitat restoration, while the U.S. Geological Survey (USGS) coordinates the LTRMP (in 1996 ecosystem monitoring and other biological services were transferred from the U.S. Fish and Wildlife Service to the U.S. Geological Survey). As part of the Environmental Monitoring Program, the Upper Midwest Environmental Sciences Center in La Crosse, Wisconsin, has monitored water quality, sedimentation, fish, vegetation, and invertebrates, as well as land cover and land use in the basin (USACE, 1997a; USGS, 1999). In a 1997 Corps of Engineers evaluation, the EMP was described as “fundamental to successful comprehensive management of the system” (USACE, 1997a). The Corps furthermore stated, “The EMP has come to be the single most important and successful program authorized by the Federal government for the purposes of understanding the ecology of the [Upper Mississippi River System] ” (USACE, 1997a).
Lock and Dam 26
The authorization, construction, and environmental effects of Lock and Dam 26 (also known as Melvin Price Lock and Dam) at Alton, Illinois, figured prominently in the establishment of the Environmental Management Program, as well as in the establishment of several environmental initiatives leading up to the navigation feasibility study.
In the 1970s, a proposal to replace and increase the navigation capacity of Lock and Dam 26 generated a great deal of controversy. Lock and Dam 26 had one 600-foot lock and a 360-foot auxilary chamber; the proposal was to replace these with a new dam and with two 1,200-foot locks. In 1978, Congress authorized construction of one 1,200-foot lock and requested the Upper Mississippi River Basin Commission to conduct a study and make recommendations regarding further navigation expansion and environmental implications. The UMRBC Master Plan recommended (among other things) that Congress authorize a second, but only 600-foot, lock.
The 1986 WRDA, however, contained authorization for a second 1,200-foot lock at Lock
and Dam 26 (as mentioned, the 1986 WRDA also authorized the EMP). To assess the environmental effects of this second lock, the Corps created a Plan of Study (POS), which was designed with the full participation of several agencies (see Appendix A for a list of participating agencies). The POS called for a 10-year studyof the second lock's environmental effects, with an estimated cost of $27 million (USACE, 1991).
In its 1997 Project Study Plan, the Corps stated that the UMR–IWW navigation study would take no further administrative actions on studies of the effects of the second lock at Melvin Price (USACE, 1997b): “Concerning the Second Lock Plan of Study, no further administrative action will be taken. The environmental studies and analyses under way as a part of the UMR–IWW System Navigation Study will provide a rational basis for decision making.”
Results from the study could have greatly increased the understanding of the environmental effects of lock construction. These results would have been especially valuable as input to the ongoing feasibility study. Unfortunately, the second lock study at Lock and Dam 26 today merely represents a foregone opportunity to enhance understanding of human impacts on the Mississippi River system.
Environmental Data, Modeling, and Related Analyses
The environmental analyses in the navigation feasibility study are supported by the Corps' draft environmental impact statement (DEIS). The feasibility study also draws heavily from the environmental analysis in the Corps' 1997 Project Study Plan, which used information as part of the federal National Environmental Policy Act (NEPA) process and also used information from ongoing studies conducted within the EMP's Long-Term Resource Monitoring Program.
The foundation for the Corps' draft environmental impact statement was a risk analysis. This risk analysis first developed a conceptual model outlining the nature and sources of stress to ecological resources, identified ecological resources potentially at risk, specified ecological impacts of concern regarding these resources, identified relevant data and information, and suggested models and methods of analysis for estimating risks. Risk assessments were developed for fish, aquatic plants, and freshwater mussels. A report summarizing ecological models and the approach to ecological risk assessments (Bartell et al., 2000) was also issued.
The draft EIS examines only the effects of incremental increases in barge traffic, reinforcing the Corps' choice to limit its studies (dating back to 1991) to the effects of increased barge traffic, and not including the long-term effects of the operation and maintenance of the entire navigation system. As a result of this limitation, the detailed plans for analysis included only the ecological risk posed by commercial vessels to river banks (through erosion), and to submerged aquatic vegetation, freshwater mussels, and fish. The conceptual model developed in support of the risk analysis (Bartell et al., 2000) was therefore limited and did not address the full scale of risks to the UMR–IWW ecosystem. The risk assessment design focused on specific biological effects such as early life stage mortality of fish (e.g., through direct entrainment of fish larvae into the propeller jets of commercial vessels), degradation or loss of fish spawning habitat. physical breakage of submerged aquatic vegetation, impacts on the growth and reproduction of
submerged aquatic vegetation, and impacts on the growth and reproduction of freshwater mussels. Potential ecological risks posed by incremental increases in commercial traffic were then estimated using models that quantified the magnitude, extent, and duration of the physical forces produced by commercial vessels and using models that quantified the ecological effects of such physical forces. Alternative traffic scenarios provided input data (e.g., vessels per day, and vessel and barge configuration, direction, speed, and draft) for the physical forces models used in the Corps' risk assessment. Results from the physical forces models were used as inputs to the ecological models used to estimate the corresponding impacts for each traffic scenario. The general findings were that (1) during any site-specific construction activities, some habitats would be lost, (2) species- or reach-specific impacts are not expected to negatively affect sport fish abundance or catch, (3) with the exception of paddlefish and sturgeon, no potential impacts to the commercial fishery are anticipated, and (4) that since operations and maintenance practices would remain the same, it is not envisioned that any permanent changes would occur to rivers in the system (USACE, 2000b).
In addition to the shortcomings mentioned earlier, the committee found two major flaws of the UMR–IWW feasibility study documentation: (1) a comprehensive evaluation of navigation-related effects in the UMR–IWW system has not yet been conducted and (2) although it is conducting a system wide study, the Corps has failed to complete a systematic study aimed toward integrating engineering, economic, and environmental issues.
Deficiencies of the Navigation Feasibility Study
Some groups, such as the U.S. Fish and Wildlife Service, conclude that the current Corps analyses are deficient in that, despite the studies and progress made under the EMP, a comprehensive evaluation of navigation-related effects is incomplete. For example, the U.S. Fish and Wildlife Service (USFWS), in an August 31, 2000 letter, argued that comprehensive evaluation would examine both direct and indirect effects of passing towboats as well as the effects of operation and maintenance ( Appendix B ). The U.S. Fish and Wildlife Service further noted that a system wide study should be conducted to evaluate cumulative effects. In the USFWS letter, five major deficiencies in the Corps' impact analysis were listed: (1) the assessment of incremental traffic effects is inadequate, and site-specific assessments are incomplete, (2) an assessment of baseline traffic effects in the “no action” alternative is needed, (3) an assessment of impacts from operation and maintenance activities is needed, (4) an assessment of traffic impacts and mitigation for the Second Lock (Lock and Dam 26) was never completed, and (5) a comprehensive mitigation plan that addresses all effects of the 9-foot channel is lacking.
Other critiques of the feasibility study stem from comparisons with the 1997 Project Study Plan studies and with studies recommended by the interagency team in the 1991 Plan of Study for the second lock at Lock and Dam 26. The Second Lock Plan of Study (USACE, 1991) was the outcome of state and federal agency cooperation encouraged by the UMRBC in its master plan. The proposed studies included 15 work units, seven of which were given highest priority. The high-priority work units included analysis of (1) basic physical forces, (2) side channel/ backwater sedimentation, (3) physical and biological effects of traffic in representative backwa-
ters, (4) effects of navigation traffic on adult fish, (5) impacts on early life stages of fish, (6) navigation effects of suspended sediments on aquatic plants, and (7) navigation impacts on freshwater mussels.
The 1991 Second Lock Plan of Study has not been implemented, but elements were included with the UMR–IWW Project Study Plan (USACE, 1997b), which had a narrower focus and called for study completion in six rather than ten years. One outcome of this narrower study focus is that the possibility of gathering biological data necessary to support comprehensive river management decisions was greatly reduced. Reflecting some of the difficulties in biological assessment, there was a shift in the project study plan's environmental studies from an assessment necessary to improve understanding of both short-term and long-term biological conditions and ecological interactions, to the collection of physical data, such as hydraulic and hydrodynamic effects of towboat passage. Although these physical data have been useful in impact modeling and risk assessments, model application to the entire UMR–IWW system is still limited by the inadequacy of the biological and ecological data needed for model calibration.
Even though the EMP has improved the ecosystem database, the ecological information needed for a full assessment of model sensitivities, and to evaluate risk predictions in system-wide impact analyses, is not available. For example, while knowledge of river hydrodynamics has been improved, there are only very limited data to adequately model—on a systemwide basis—the relations between river hydrodynamics, towboat passage effects, and biological responses. The lack of this type of interdisciplinary, systemwide understanding is a weakness of the draft navigation feasibility study and reflects the fact that no systemwide study of the long-term effects of the navigation system and its operations—including the ecological effects of the creation of a system of navigation pools —has yet to be conducted. A systemwide study assessing the operation and maintenance impacts associated with the Upper Mississippi River and Illinois Waterway system project should be conducted.
Lack of Systematic and Integrated Analyses
Although the Corps' navigation system feasibility study is ambitious, it does not provide adequate information on which to base important environmental decisions. Furthermore, the documentation provided to date does not effectively integrate the results of wide-ranging project study plan studies. The Corps has addressed systemwide issues in the draft navigation feasibility study, but as mentioned, it has yet to complete a systematic study of the UMR–IWW system that effectively relates continuing ecological responses from past navigation system improvements with incremental effects and construction impacts in a realistic context that recognizes the influences of land uses in the watershed.
A common thread in criticisms of the navigation feasibility study environmental analyses (e.g., from the NECC and USFWS) is that individual elements of the feasibility study remain disconnected from the environmental analysis. This critique focuses on the lack of integration across engineering, economic, and environmental findings that would provide a systematic assessment of the long-term environmental effects of the navigation system's operation and maintenance. For example, the study of the effect of physical forces on fish or plants appears not to
address the consequences of (a) spills from passing towboats, (b) indirect effects of habitat alteration on food or space limits in target and nontarget fish and mussel species, or (c) cumulative effects of multiple factors associated with increased barge passage, increased risk of spills, and increased operations and maintenance of the lock system. The absence of integrative analysis in the draft feasibility study to date is a concern of this committee.
The Corps should connect all elements of the feasibility study in order to provide both a systemwide and a systematic analysis of project consequences. The final analysis should fully integrate economic forcing functions of barge transportation needs with systemwide consequences to the environment of both changed navigation use and the short-and long-term consequences of navigation system construction, maintenance, and operation.
In summary, the UMR–IWW draft navigation feasibility study, although somewhat of a landmark in the history of contemporary Corps of Engineers water resources project planning studies, did not conduct the environmental analyses necessary to provide information on, as stated in the 1970 Flood Control Act, “improving the quality of the environment in the overall public interest.” The focus is on environmental studies that consider only incremental traffic effects, leaving a more comprehensive analysis of system-level consequences, and any studies directed to the improvement of environmental quality, to other efforts that would utilize other authorities and cost-sharing requirements. Furthermore, the draft feasibility study sought to avoid, minimize, or mitigate significant environmental impacts, which addresses only specific actions in specific locations, and left system-wide assessments to other efforts under different authorities.
ENGINEERING
Approximately 25 percent of the cost of the feasibility study supported the efforts of the engineering work group. This work group evaluated the current navigation system and the anticipated without-project operations and maintenance, rehabilitation, and replacement needs. It also conducted engineering and cost-estimating efforts to support plan formulation activities and evaluation of alternatives. The committee 's review of this work was limited to examining whether the work provided an adequate basis for the economic assessment of the proposed system improvement alternatives. That is, the committee did not attempt to review in detail the engineering analyses performed, but did consider whether the scope and depth of the analyses were consistent with efforts normally required at the feasibility study stage, and whether the engineering judgments and the conclusions reached were supported by the data displayed in the draft report.
Lock and Dam Rehabilitation
For some alternatives, a significant portion of the benefits of lock chamber extensions comes from savings in anticipated major rehabilitation costs for the existing structures. It is thus important to review how these rehabilitation cost savings were estimated.
The draft feasibility study report details two different methods that were used to assess rehabilitation costs for the “without project ” condition. The first entailed an in-depth review of the costs and results of the current system rehabilitation program. Table 4.2 (from the draft feasibility study) shows the extent of this program. As shown, projects were carried out over the past 20 years at 36 sites, at a total cost of $905 million, an average of $25 million per site. Consistent with the current engineering policies of the three Corps District offices involved, it was concluded that additional rehabilitation projects would be needed at 25-year intervals to allow the
TABLE 4.2 Lock and Dam Rehabilitation Projects
|
Location |
Date |
Project Cost |
|
UMR |
(actual $'s in millions) |
|
|
Lock and Dam 25 |
1994-2001 |
$25.9 |
|
Lock and Dam 24 (multiple stages) |
1996-2007 |
$70.0 |
|
Lock and Dam 22 |
1987-1990 |
$15.1 |
|
Lock and Dam 21 |
1987-1990 |
$14.6 |
|
Lock and Dam 20 |
1986-1994 |
$43.7 |
|
Lock 19 |
FY04 |
|
|
Lock and Dam 18 |
1988-1993 |
$15.0 |
|
Lock and Dam 17 |
1988-1993 |
$14.9 |
|
Lock and Dam 16 |
1991-1994 |
$17.8 |
|
Lock and Dam 15 |
1993-1996 |
$19.2 |
|
Lock and Dam 14 |
1996-2000 |
$30.6 |
|
Lock and Dam 13 |
1993-1997 |
$22.5 |
|
Lock and Dam 12 |
2000-2004 |
|
|
Lock and Dam 11 |
2001-2005 |
$40.3 |
|
Lock and Dam 10 (multiple stages) |
1991-2005 |
$25.9 |
|
Lock and Dam 9 (multiple stages) |
1993-2004 |
$28.2 |
|
Lock and Dam 8 (multiple stages) |
1992-2002 |
$25.9 |
|
Lock and Dam 7 (multiple stages) |
993-2005 |
$32.2 |
|
Lock and Dam 6 (multiple stages) |
1991-2002 |
$25.9 |
|
Lock and Dam 5A (multiple stages) |
1992-2002 |
$24.4 |
|
Lock and Dam 5 (multiple stages) |
1990-2001 |
$36.1 |
|
Lock and Dam 4 (multiple stages) |
1989-2003 |
$30.0 |
|
Lock and Dam 3 (multiple stages) |
1988-2003 |
$32.7 |
|
Lock and Dam 2 (multiple stages) |
1987-2003 |
$32.5 |
|
Lock and Dam 1 (multiple stages) |
1983-2003 |
$56.2 |
|
Lower St. Anthony Falls |
- - - |
- - - |
|
Upper St. Anthony Falls |
- - - |
- - - |
|
IWW |
||
|
Starved Rock (w/o miter gates) |
1981-1984 1981-1984 |
$13.3 $16.7 |
|
Dresden Island (w/o miter gates) |
||
|
Lockport (w/o lock walls) |
1983-1987 |
$22.7 |
|
Brandon Road (w/o miter gates) |
1984-1988 |
$23.7 |
|
Marseilles Dam |
1985-1990 |
$15.7 |
|
Peoria Dam |
1987-1991 |
$23.2 |
|
LaGrange Dam |
1987-1991 |
$21.5 |
|
Lockport Lock (lock walls) |
1993-1996 |
$13.0 |
|
Brandon Road (miter gates) |
1993-1996 |
$6.5 |
|
Dresden Island (miter gates) |
1993-1996 |
$6.0 |
|
Marseilles (miter gates) |
1993-1996 |
$6.0 |
|
O'Brien Lock and Dam |
FY03 Start |
$19.3 |
|
TOTAL |
$904.7 million * |
|
|
* Note: Project costs and totals represent actual expenditures that are not adjusted for price levels. SOURCE: USACE, 2000a. |
||
existing structures to perform satisfactorily for the 50-year study period. The anticipated typical costs of a rehabilitation project on a lock or dam are listed in Table 4.3
The specific years that rehabilitation would be needed were based upon consideration of the number of lockage cycles that had occurred prior to the current rehabilitation program, and the number of years that it would take to accumulate a similar number of lockage cycles under the projected traffic. This analysis is summarized in Table 4.4 . A schedule of lock rehabilitation expenditures showing project costs of $25 million or $30 million at each site on two occasions during the 50 years was developed (see Table 4.5 ). For example, Lock 25 would require a $30 million rehabilitation in 2020 and a $25 million rehabilitation in 2045.
The second method of estimating rehabilitation needs was an application of probabilistic risk assessment, using event trees to capture potential failure modes and repair costs. In this analysis, the engineering work group focused on 18 components of the locks and dams and projected their reliability to see if replacement or rehabilitation was economically justified before those components failed and needed to be replaced. Using a 1993-1995 version of the risk assessment model, no rehabilitation work appeared to be economically feasible for any component, leading to a “fix as you go” policy that would not repair aging parts until they failed. The findings were not believable given the historic record of needed repair and rehabilitation. For example, only $1,000 was estimated as being needed for the next 50 years of miter gate repairs for all sites—a drastic understatement of real needs, given the past history of repairs. The repair estimates also did not cover the costs of restoring paint at even one site for hydraulic steel structures over the entire planning period (USACE, 2000a). Hence, this method was abandoned in favor of the analysis of historical lock and dam rehabilitation expenditure data described above. While the probabilistic risk assessment failed for the present study, the approach seems to have promise, particularly for analyzing circumstances that might arise that are not covered adequately by a historical record. The committee encourages the Corps to pursue this topic further as a research project, with a strong emphasis on using historical data to inform the theoretical analysis. The aim of this research should be to develop better analytical risk assessment methods that can be combined with other, improved planning and economic models to insure that maintenance policies and rehabilitation projects, and related risk assessments, are given proper weight in future feasibility studies, as directed by the Corps ' planning guidance.
For the “with project” condition, where new lock construction is involved, rehabilitation cost savings arise because most of the major rehabilitation items will be included as part of the new construction. For example, damaged concrete will be repaired, lock machinery and filling and emptying components will be replaced or modified, and lock gates will be replaced. Hence, the first cycle of major rehabilitation in the “without project ” schedule can be deferred. The rehabilitation costs thereby avoided are legitimately counted as a project benefit. Rehabilitation projects will still be needed for the extended locks, but they will occur later than in the “without project” condition. In the case of Lock 25, for example, the first major rehabilitation would be scheduled for 2035, rather than 2020 (see Table 4.2 ).
The importance of rehabilitation cost savings caused the Corps to closely evaluate the timing of the lock chamber extension projects, under the “optimal timing” analysis reported in the draft feasibility study, to ensure that the proposed lock construction would coincide with the timing of the first rehabilitation cycle. Ideally, lock construction would be delayed until near the
TABLE 4.3 Future Rehabilitation Project Costs Per Site (FY 1997 Price Levels
|
Feature |
Project Cost |
|
Lock w/only localized concrete repairs |
$25,000,000 |
|
Lock w/complete chamber concrete resurfacing |
$30,000,000 |
|
Dam |
$15,000,000 |
|
SOURCE: USACE, 2000a. |
|
TABLE 4.4 Number of Cycles Versus Rehabilitation Years
TABLE 4.5: Scheduled Lock Rehabilitation Expenditures ($ Millions)
|
Lock 25 |
Lock 24 |
Lock 22 |
Locks 20 & 21 |
|||||
|
Year |
Without Project |
With Project |
Without Project |
With Project |
Without Project |
With Project |
Without Project |
With Project |
|
2010 |
- |
- |
- |
- |
- |
- |
- |
- |
|
2015 |
- |
- |
- |
- |
30 |
- |
30 |
- |
|
2020 |
30 |
- |
25 |
- |
- |
- |
- |
- |
|
2025 |
- |
- |
- |
- |
- |
- |
- |
- |
|
2030 |
- |
- |
- |
- |
- |
- |
- |
- |
|
2035 |
- |
25 |
- |
- |
- |
25 |
- |
- |
|
2040 |
25 |
25 |
25 |
25 |
||||
|
2045 |
25 |
30 |
- |
- |
- |
- |
- |
|
|
2050 |
- |
- |
- |
- |
- |
- |
- |
- |
|
2055 |
- |
- |
- |
- |
- |
- |
- |
- |
|
2060 |
- |
35 |
- |
- |
- |
35 |
- |
- |
|
2065 |
35 |
30 |
30 |
35 |
TABLE 4.5 (continued)
|
Locks 15 – 18 |
Lock 14 |
Peoria & Lagrange |
||||
|
Year |
Without Project |
With Project |
Without Project |
With Project |
Without Project |
With Project |
|
2010 |
- |
- |
- |
- |
- |
- |
|
2015 |
- |
- |
- |
- |
30 |
- |
|
2020 |
30 |
- |
- |
- |
- |
- |
|
2025 |
- |
- |
30 |
- |
- |
- |
|
2030 |
- |
- |
- |
- |
- |
- |
|
2035 |
- |
- |
- |
- |
- |
- |
|
2040 |
25 |
25 |
25 |
25 |
||
|
2045 |
25 |
- |
- |
- |
- |
- |
|
2050 |
- |
- |
25 |
- |
- |
- |
|
2055 |
- |
- |
- |
- |
- |
- |
|
2060 |
- |
- |
- |
- |
- |
- |
|
2065 |
35 |
35 |
30 |
35 |
||
|
SOURCE: USACE, 2000a. |
||||||
scheduled rehabilitation date, butnot so long as to require rehabilitation to maintain lock efficiency and safety. Specifically, it was assumed that the without-project rehabilitation cannot be avoided if construction of lock improvements begins more than five years beyond the date of the scheduled rehabilitation. This analysis showed that delaying the extension projects to allow capture of the rehabilitation cost savings would have positive benefits in all cases. This has the further advantage of delaying the construction expenditure, thus reducing its discounted present value. A proposed delay in project timing is consistent with the committee's recommendation to not consider irreversible construction commitments until nonstructural alternatives are first carefully considered—a measure that will allow time to determine if projected lock traffic increases are actually materializing.
The Corps conducted a thorough analysis in considering rehabilitation costs and benefits, and the draft feasibility study report adequately documents this effort. The avoided rehabilitation costs are a legitimate part of the estimated benefits of the lock extension projects. The feasibility report could be improved by showing explicitly that the project construction cost estimates do, in fact, include costs for the major rehabilitation that will be conducted as part of lock extension projects.
This committee's assessment comes with an important caveat. It is clear that rehabilitation cost savings are tied closely with the proposed timing of the rehabilitation projects, which, in turn, is tied to the number of lockage cycles projected to occur to serve forecast demand. This committee has been critical of the demand forecast. If new waterway traffic demand forecasts are developed, it will be important to revisit the rehabilitation costs analysis to ensure consistency with the revised traffic demand forecasts.
Construction Costs
Because construction costs are uncertain, the Corps includes a standard “contingency” factor of 20 percent to account for possible cost escalation. The percentage allocated for contingency in the draft navigation feasibility study has varied from 20 percent to 35 percent. Since the Corps chose a construction method not used previously on the UMR–IWW, the contingency was raised to 35 percent. Subsequent design modifications, which eliminated some of the previously proposed innovative design and construction techniques, led the Corps in July 2000 to conclude that a 25 percent contingency figure was justified. Also, by July 2000, the Corps felt it had become more knowledgeable about site conditions and that more information was available on the proposed construction methods, thereby supported the decision to reduce the contingency figure to 25 percent. Regarding site conditions, when the Corps revised the contingency figure, the Corps reported that it was able to analyze results from successful field tests and subsurface investigations at some specific sites. Furthermore, it was reported that the Corps had information (from hydraulic modeling of the sites at Locks and Dams 22 and 25 and from emptying and filling models obtained from the Corps' Great Lakes and Ohio River division) that further supported the decision to reduce the contingency factor to 25 percent.
Based on the information provided to this committee, a slightly higher contingency figure (25 percent, rather than 20 percent) may be warranted for the new construction method. However,
a recent construction effort on the UMR–IWW—construction of a second lock at Lock and Dam 26–cost nearly three times the estimated cost. Clearly, a 20 percent contingency was too small in that case. In construction projects, there are many factors that can raise costs far beyond the original estimate, as demonstrated at Lock and Dam 26. The committee judges the risks of cost escalation to be far greater than the 20 percent or 25 percent estimates that the Corps has been using. If lock extensions on the UMR–IWW are sensitive to construction costs being no more than 25 percent above the Corps' estimate, it is likely that escalating costs will greatly reduce the project's net benefits.
The Value of Independent Peer Review
Large and important projects such as proposed lock extensions on the UMR–IWW would benefit from a second opinion. Whether the issue is surgery, revising the Head Start program, or extending locks, issues such as these are too important to not receive an independent judgment on the merits of the various approaches and a careful scrutiny of the analysis. There are nearly always different possible approaches to achieving a goal; decision-makers need assurance that the analysis was conducted carefully and is state-of-the-art. Before embarking on important decisions—particularly ones involving more than $1 billion of construction—an independent peer review is crucial. The final feasibility study of the UMR–IWW system should be given a thorough independent peer review by an interdisciplinary panel of experts from outside the Department of Defense. The committee notes that Section 216 of the Water Resources Development Act of 2000 (WRDA 2000) mandated a National Academies review of the Corps' procedures for independent peer review of feasibility reports. This upcoming study should help broaden and strengthen the Corps' peer review procedures, which ultimately should lead to better feasibility studies.


