
Page 167
APPENDIX B
Designing a Comprehensive National Report on Effectiveness of Care: Measurement, Data Collection, and Reporting Strategies
Elizabeth A. McGlynn, Ph.D.,1 Paul G. Shekelle, M.D., Ph.D.,1, 2 and Robert H. Brook, M.D., Sc.D.1, 3
INTRODUCTION
This is an excerpt from a paper that was commissioned by the Institute of Medicine (IOM) Committee on the National Quality Report on Health Care Delivery to identify potential measures of effectiveness to include in a National Health Care Quality Report for Congress and the American public (McGlynn et al., 2000a).
One of the questions to consider in designing the report is how many measures to choose. We consider a continuum from a few (leading indicators) to many (comprehensive system) measures, which represent two conceptually distinct approaches to measuring quality nationally. Under the leading indicators approach, three to five specific measures of effectiveness would be selected across a few domains (for example, rates of mammography screening, prevalence of the use of beta-blockers, appropriateness of coronary angioplasty). This is the most common approach to quality measurement currently. Leading indicators may work well for drawing general conclusions about quality when they correlate highly with similar, but unmeasured, interventions and when repeated measurement and public reporting do not change the relationship of these indicators to unmeasured but related interventions. A leading indicator approach
1 The RAND Corporation.
2 Greater Los Angeles Veterans Affairs Healthcare System.
3 UCLA Center for Health Sciences.
Page 168
lacks face validity for summarizing performance because three to five specific measures will never satisfactorily represent care at a high level of aggregation (for example, care for chronic conditions). By contrast, a comprehensive system can represent the quality of care delivery on different dimensions by including a large number of measures applied to a population of interest and aggregated to produce index scores. A comprehensive system works well when there is evidence of variability within and between the diagnosis and management of different conditions and when the question being asked is framed at a high level (for example, how well the health system is helping the population to stay healthy; how much of a problem underuse is). Because the leading indicators approach is familiar, this appendix focuses on how a comprehensive approach to quality assessment for the National Health Care Quality Report might be implemented.
ASSESSING EFFECTIVENESS OF CARE
How good is the quality of care in America? That is the question many people would like to have answered if only the measures, the data, and the appropriate analytic framework were available. We begin by describing a new method for evaluating effectiveness that is under development at RAND because it offers a useful approach to assessing quality nationally.
Description of the QA Tools System
Under funding from public and private sponsors,1 RAND has developed a comprehensive system for assessing the quality of care for children, adults, and the vulnerable elderly. We call this system QA Tools. We briefly discuss how the clinical areas were selected, how the indicators were chosen, what is included in the system, and how the system is being implemented.
Selecting Clinical Areas
We reviewed national data sources to identify the leading causes of morbidity and mortality and the most common reasons for physician visits in the United States for different age and gender groups in the population.2Table B.1 shows the list of 58 clinical areas included in the QA Tools system by population group: 20 include indicators for children, 36 for adults, and 23 for the vulnerable elderly. The clinical areas, broadly defined, represent about 55 percent
1 Health Care Financing Administration, Agency for Healthcare Research and Quality, California HealthCare Foundation, Pfizer, and the Robert Wood Johnson Foundation.
2 Age or gender groups: 0–1, 1–5, 6–11, 12–17, 18–50 (men separate from women), 50–64, 65–75, over 75.
Page 169
of the reasons for ambulatory care visits among children; 50 percent of the reasons for ambulatory care visits and 46 percent of the reasons for hospitalization among adults; and about 50 percent of care for the vulnerable elderly.
Selecting Indicators
For each clinical area chosen, we reviewed the scientific literature for evidence that effective methods of prevention, screening, diagnosis, treatment, and follow-up existed (Asch et al., 2000; Kerr et al., 2000a,b; McGlynn et al., 2000a,b). We explicitly examined the continuum of care in each clinical area. For each clinical area, staff wrote a summary of the scientific evidence, and developed tables of the proposed indicators along with the level of evidence and specific studies in support of the indicator as well as the rationale for the indicator.
The indicators included in the QA Tools system are primarily process indicators. We deliberately chose such indicators because the system was designed to evaluate quality in the context of accountability, and process measures are frequently more suitable for such purposes. However, data are collected on a number of intermediate outcomes measures (for example, glycosylated hemoglobin, blood pressure, cholesterol) that could be used to construct additional clinical outcomes indicators. In many instances, the measures included in the QA Tools system examine whether interventions have been launched in response to poor performance on such measures (for example, whether persons who fail to control their blood sugar on dietary therapy are offered oral hypoglycemic therapy).
Expert panels were convened to evaluate the indicators and make final selections using the modified Delphi method developed at RAND and the University of California, Los Angeles (UCLA). The method has been shown to have a reproducibility consistent with that of well-accepted diagnostic tests such as the interpretation of coronary angiography and screening mammography (Shekelle et al., 1998a). It has been shown to have content, construct, and predictive validity in other applications (Brook, 1994; Kravitz et al., 1995; Selby et al., 1996; Shekelle et al., 1998b).
A total of eight expert panels were conducted on (1) children's care; (2) care for women 18 to 50 years old; (3) general medicine for adults; (4) oncologic conditions and human immunodeficiency virus (HIV); (5) cardiopulmonary conditions; (6, 7) selected conditions applicable to the vulnerable elderly; and (8) nursing home care. Panels were conducted as early as October 1995 (children's care) and as recently as April 1999 (vulnerable elderly). Table B.2 summarizes the distribution of indicators by type of care (preventive, acute, chronic); function of medicine (screening, diagnosis, treatment, follow-up, continuity); and modality (for example, history, physical examination, laboratory
Page 170
|
Clinical Area |
Children |
Adults |
Vulnerable Elderly |
|
Acne |
X |
||
|
Adolescent preventive services |
X |
||
|
Adult screening and prevention |
X |
X |
|
|
Alcohol dependence |
X |
||
|
Allergic rhinitis |
X |
||
|
Asthma |
X |
X |
|
|
Atrial fibrillation |
X |
X |
|
|
Attention deficit/hyperactivity disorder |
X |
||
|
Benign prostatic hyperplasia |
X |
||
|
Breast cancer |
X |
||
|
Cataracts |
X |
||
|
Cerebrovascular disease |
X |
X |
|
|
Cervical cancer |
X |
||
|
Cesarean delivery |
X |
X |
|
|
Chronic obstructive pulmonary disease |
X |
||
|
Colorectal cancer |
X |
||
|
Congestive heart failure |
X |
X |
|
|
Coronary artery disease |
X |
||
|
Dementia |
X |
||
|
Depression |
X |
X |
X |
|
Developmental screening |
X |
||
|
Diabetes mellitus |
X |
X |
X |
|
Diarrheal disease |
X |
||
|
End-of-life care |
X |
||
|
Falls and mobility disorders |
X |
||
|
Family planning and contraception |
X |
X |
|
|
Fever of unknown origin |
X |
||
|
Headache |
X |
||
|
Hearing impairment |
X |
||
|
Hip fracture |
X |
||
|
Hormone replacement therapy |
X |
||
|
Hospital care |
X |
||
|
Human immunodeficiency virus |
X |
||
|
Hyperlipidemia |
X |
||
|
Hypertension |
X |
X |
|
|
Immunizations |
X |
X |
X |
|
Ischemic heart disease |
X |
||
|
Low-back pain |
X |
||
|
Malnutrition |
X |
||
|
Orthopedic conditions |
X |
||
|
Osteoarthritis |
X |
X |
|
|
Osteoporosis |
X |
||
|
Otitis media |
X |
||
|
Pain management |
X |
X |
|
|
Peptic ulcer disease and dyspepsia |
X |
||
|
Pharmacologic management |
X |
||
|
Pneumonia and influenza |
X |
X |
|
|
Prenatal care and delivery |
X |
X |
|
|
Pressure ulcers |
X |
||
|
Prostate cancer |
X |
||
|
Tuberculosis |
X |
X |
|
|
Upper respiratory tract infections |
X |
||
|
Urinary incontinence |
X |
||
|
Urinary tract infections |
X |
X |
|
|
Uterine bleeding and hysterectomy |
X |
||
|
Vaginitis and sexually transmitted diseases |
X |
X |
|
|
Vision impairment |
X |
||
|
Well-child care |
X |
||
|
TOTAL |
|||
|
Number of Clinical Areas |
20 |
36 |
23 |
Page 171
test, medication) (Malin et al., 2000; Schuster et al., 1997; Sloss et al., 2000). The categories are those selected by the research team and reflect terminology commonly used by health services researchers to describe different aspects of health service delivery. They also reflect the categories of care for which we sought to develop quality indicators ( Table B.3 presents some sample indicators by type of care). However, a significant benefit of the QA Tools system is its adaptability to other frameworks.
Several projects to test the feasibility and utility of this approach to quality measurement are currently underway. Under funding from the Health Care Financing Administration (HCFA), data from medical records were collected in two health plans (one group model, one independent practice association [IPA]) for the 20 clinical areas related to women's health care. The preliminary analyses show variation in performance within and between health plans. Aggregate scores have been constructed in the categories described in Table B.2. Under funding from the Agency for Healthcare Research and Quality (AHRQ), data are being collected from two different managed care plans (one group model, one IPA) for the adult clinical areas. Under funding from the California HealthCare Foundation (CHCF), data will be collected from three medical groups in California for the children's and adult's clinical areas. Under funding from Pfizer, the set of quality indicators selected to assess the care of vulnerable elders is being pilot-tested in two managed care organizations. A separate set of indicators for evaluating nursing home quality was developed and will be tested under funding from CHCF. Finally, under funding from the Robert Wood Johnson Foundation (RWJ), we are testing a community-based implementation of this approach to quality measurement called the Community Quality Index (CQI) in
Page 172
12|
Population |
||||
|
Aspect |
Children N (%) |
Adults N (%) |
Vulnerable Elderly N (%) |
Total N (%) |
|
Type of Care |
||||
|
Preventive care |
133 (32) |
83 (14) |
— |
— |
|
Acute care |
175 (43) |
188 (31) |
— |
— |
|
Chronic care |
102 (25) |
340 (56) |
— |
— |
|
Function of Care (Domain) |
||||
|
Screening or Prevention |
88 (21) |
40 (7) |
62 (25) |
190 (15) |
|
Diagnosis |
126 (31) |
216 (35) |
51 (21) |
393 (31) |
|
Treatment |
143 (35) |
280 (46) |
92 (37) |
515 (41) |
|
Follow-Up |
53 (13) |
75 (12) |
22 (9) |
150 (12) |
|
Continuity |
— |
— |
20 (8) |
20 (2) |
|
Modality |
||||
|
Physical Exam |
55 (13) |
90 (15) |
30 (12) |
175 (14) |
|
History |
90 (22) |
78 (13) |
29 (12) |
197 (15) |
|
Laboratory or Radiology Test |
96 (23) |
163 (27) |
13 (5) |
272 (21) |
|
Medication |
58 (14) |
144 (24) |
77 (31) |
279 (22) |
|
Other Intervention |
78 (19) |
117 (19) |
51 (21) |
246 (19) |
|
Other Contact |
33 (8) |
19 (3) |
49 (20) |
101 (8) |
|
TOTAL |
410 (100 %) |
611 (100 %) |
247 (100 %) |
1268 (100 %) |
communities that are participating in the Community Tracking Study. RWJ is funding RAND to conduct another round of this project, which will begin in February 2001. It will enable us to examine change in quality over time and will add a national sample to allow us to make national estimates of quality. The experience with this project provides considerable insight into the use of this tool for a National Health Care Quality Report.
Page 173
|
Category |
Sample Indicator |
|
Preventive care |
Patients who have one or more first-degree relatives with colorectal cancer should be offered at least one of the following colon cancer screening tests beginning at age 40:
Systolic and diastolic blood pressure should be measured on patients otherwise presenting for care at least once each year. |
|
Acute care |
Persons with hip fractures should be given prophylactic antithrombotics on admission to the hospital. If a patient has symptoms of urethritis, he should be tested for both chlamydia and gonorrhea or receive proper treatment for both. |
|
Chronic care |
If a child is started on pemoline, the health care provider should document the absence of hepatic disease prior to the start of therapy by history and baseline liver function tests. Patients with an FEV1 or PEFR ≤70% of baseline (or predicted) after treatment for an asthma exacerbation in the physician's office should be placed on an oral corticosteroid taper. Patients in any risk group with stage 2–3 hypertension should be offered pharmacotherapy. |
NOTES: FEV1 = forced expiratory volume at 1 second; FOBT = fecal occult blood test; PEFR = peak expiratory flow rate.
Page 174
Implementation of the QA Tools System for a National Health Care Quality Report
In this section, we discuss the methods by which the QA Tools system could be implemented to produce a national report on quality. In particular, we consider development of a sampling strategy, estimated sample sizes, data collection strategies, analysis and reporting, “actionability” of the information for policy makers, and the applicability of the system to special populations.
Developing a Sampling Strategy
The sampling strategy depends largely on the questions that the National Health Care Quality Report seeks to answer. If the purpose of the report is to provide a general snapshot of quality of care in America, a simple random sample of persons could be drawn. If the national report seeks to answer questions about variations in quality by region, race or ethnicity, urban versus rural, type of insurance, and so on, either a very large simple random sample would have to be drawn or a stratified sampling strategy would have to be developed. If one is interested in developing state-specific estimates, equal-sized samples could be developed for each state using either a random or a stratified approach and a national estimate produced from a weighted average.
Sample Sizes
Based on data from one of our pilot studies, we have estimated sample sizes for implementing the QA Tools system for a National Health Care Quality Report. Because the current state of information systems requires that we access paper copies of medical records, a clustered sampling design would enhance data collection efficiency. For example, a national snapshot sample could be concentrated in 12 metropolitan areas, as has been done with the RWJ-funded effort described above. The system is scored as the number of eligible care events received divided by the number of eligible events. If the summary score for a particular area (for example, quality of care for acute conditions, quality of care for hypertension) had an average adherence rate of 50 percent, a national sample of 500 persons would produce estimates with a 95 percent confidence interval (95% CI) ranging from 48.2 to 51.8 percent. Doubling the sample size increases the precision by one-tenth of a percentage point, which does not justify the additional costs.
To move beyond the simple national snapshot, a sample size of 500 might be selected for each subgroup of interest in the population. For example, if detecting a 1.8 percentage point difference in quality between men and women was adequate, a total sample of 1,000 people would be required (500 in each group). Similarly, if the national report included estimates about the quality of
Page 175
care experienced by people with particular chronic conditions, we might want to select 500 people with hypertension and/or 500 people with diabetes, in addition to the national snapshot sample. For some subgroup analyses, lower levels of precision might be adequate to identify differences in care that raise significant policy concerns.
To make state-level estimates of quality, adequate sample sizes would have to be drawn in every state. Because cluster sampling might not be used at the state level, a sample size of 400 has a 95% CI of ±1.2 percentage points. Using 100 cases per state would allow differences of 2.4 percentage points to be detected. Multiples of these sample sizes would have to be collected for each subgroup of interest at the state level.
Data Collection Strategies
We consider here how a supplement to the Medical Expenditure Panel Survey (MEPS) could be used to generate national quality-of-care scores using the QA Tools method. MEPS is a national probability survey of health care use, expenditures, sources of payment, and insurance coverage for the general U.S. population; a separate component of MEPS surveys nursing homes and residents of nursing homes as well. Detailed information about MEPS can be found on the AHRQ web site (Agency for Healthcare Research and Quality, 2000).
AHRQ and the National Center for Health Statistics (NCHS) could add collection and/or abstraction of medical records to the existing design. The current design of the RWJ study is similar to that of MEPS—data that provide information on utilization and financing of care are collected at the household and individual levels. Participants volunteer information about their health care providers and sign consents to release copies of medical records for research purposes. Because MEPS is a national probability sample, the addition of medical record data would allow national estimates of quality to be linked to information about utilization, expenditures, and insurance coverage. The National Health Care Quality Report could also take advantage of the indicators related to the vulnerable elderly as applied to both the household component subsample (adults with functional impairments) and the nursing home sample.
Analysis and Reporting
The basic approach to scoring starts with determining whether or not each person in the sample is eligible for each indicator in the set. This is simplified considerably by the way in which data are collected. Among those who are eligible for an indicator, we then determine whether the patient received the recommended care (or did not receive care that is contraindicated).
To create category scores, we take two approaches. The first is an indicatorbased approach that sums all passes and divides by all eligibilities. It can be
Page 176
~ enlarge ~
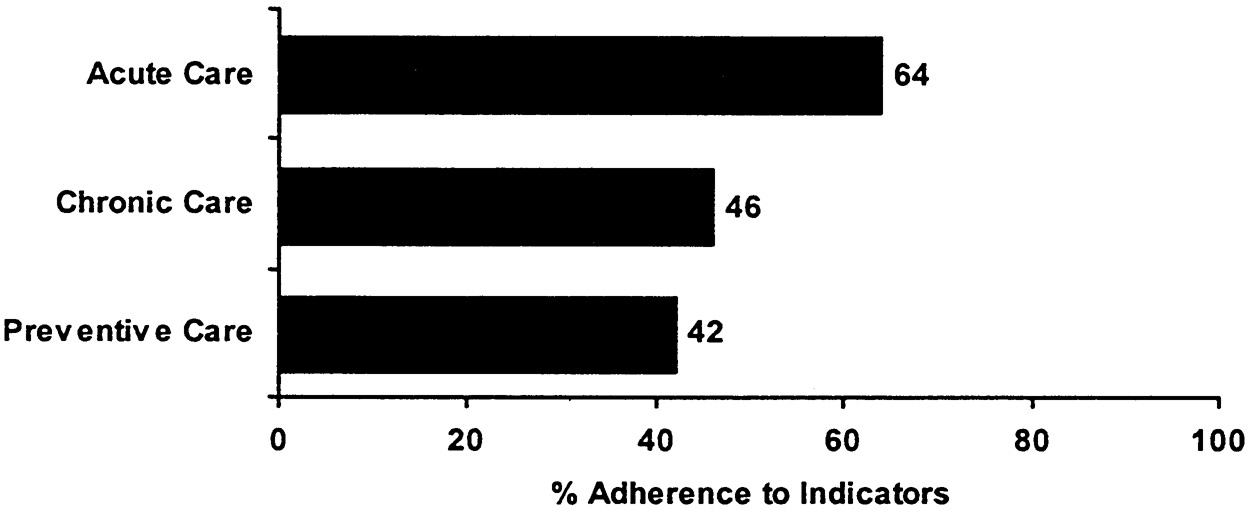
FIGURE B.1 An illustration of how to present QA Tools summary results.
characterized as the proportion of recommended care events that were received. The second is a patient-based approach that creates a summary score at the level of an individual patient. This can be characterized as the average proportion of recommended care received by an individual. The first approach allows individuals to be counted multiple times in the summary score if they have multiple eligible encounters with the system, which means that persons with more health problems and/or more serious problems will be weighted more in the score. The second approach makes individuals equal in their contribution to the score. In our pilot data, we have done the scoring both ways and find few differences in scores by the method used. Where we have found differences, they have been in both directions (i.e., the patient-based score can be higher or lower than the indicator-based score). Because different information is communicated using the different scoring approaches, both should be calculated. Figure B.1 and Figure B.2 illustrate how the results from this approach might be presented.
“Actionability” by Policy Makers
The potential for using the results of this work to inform policy is significant, particularly if data are collected in a way that facilitates linking aspects of the organization and financing of care, as well as demographic characteristics, to variations in quality. If the QA Tools system were implemented at the individual health system level (for example, a managed care plan), certain conditions could be oversampled (for example, diabetes) to provide a focal point for quality improvement activities.
Page 177
~ enlarge ~
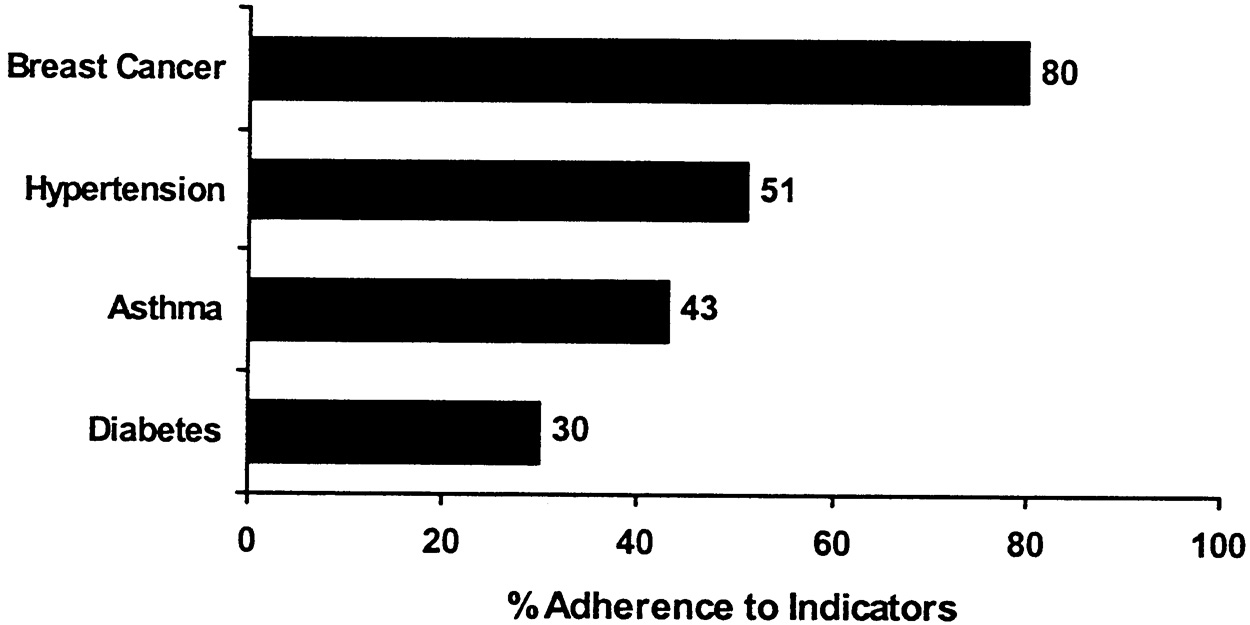
FIGURE B.2 An illustration of how to present condition-specific scores within chronic care categories.
Application to Special Populations
The QA Tools system includes a specific set of indicators targeted at the vulnerable elderly, a group responsible for significant health care utilization and expenditures. The system can also be applied to persons with chronic conditions and can facilitate comparisons of the care for chronic conditions among those with different insurance arrangements, socioeconomic status, and living in different areas of the country. The tool was developed to evaluate quality for a large portion of care and, as such, has focused on common conditions more often than rare conditions. However, the methodology and the software have been designed to facilitate the addition of new clinical areas, as well as to update existing indicators. Future work could add modules for persons with additional health problems (for example, pediatric cardiac illnesses).
CONCLUSION
The QA Tools system represents a feasible alternative to the leading indicators approach to quality measurement. This comprehensive approach is well suited to the requirements of a national report on quality and could be implemented by augmenting an existing national database.
REFERENCES
Agency for Healthcare Research and Quality (AHRQ). Home Page. [on-line] Available at: http://www.ahrq.gov [Dec. 11, 2000].
Page 178
Asch S.M., E.A. Kerr, E.G. Hamilton, J.L. Reifel, and E.A. McGlynn, eds. 2000. Quality of Care for Oncologic Conditions and HIV: A Review of the Literature and Quality Indicators. MR-1281-AHRQ. Santa Monica, Calif.: RAND.
1994. The RAND/UCLA appropriateness method. Clinical Practice Guideline Development: Methodology Perspectives, eds. K.A. McCormick, S.R. Moore, and R.A. Siegel. , Rockville, Md.: Public Health Service.
Kerr E.A, S.M. Asch, E.G. Hamilton, and E.A. McGlynn, eds. 2000a. Quality of Care for Cardiopulmonary Conditions: A Review of the Literature and Quality Indicators. MR-1282-AHRQ. Santa Monica, Calif.: RAND.
Kerr E.A., S.M. Asch, E.G. Hamilton, and E.A. McGlynn, eds. 2000b. Quality of Care for General Medical Conditions: A Review of the Literature and Quality Indicators. MR-1280-AHRQ. Santa Monica, Calif: RAND.
, , , , 1995. Validity of criteria used for detecting underuse of coronary revascularization. Journal of the American Medical Association 274(8): 632–638.
, , , and . 2000. Evaluating the quality of cancer care: Development of cancer quality indicators for a global quality assessment tool. Cancer 88: 701–707.
McGlynn E.A., C. Damberg, E.A. Kerr, and M. Schuster, eds. 2000a. Quality of Care for Children and Adolescents: A Review of Selected Clinical Conditions and Quality Indicators. MR-1283-HCFA. Santa Monica, Calif: RAND.
McGlynn E.A., E.A. Kerr, C. Damberg, and S.M. Asch, eds. 2000b. Quality of Care for Women: A Review of Selected Clinical Conditions and Quality Indicators. MR1284-HCFA. Santa Monica, Calif.: RAND.
, , and . 2000. Designing a National Report on Effectiveness and Appropriateness of Care: Measurement, Data Collection, and Reporting Strategies. Commissioned Paper for the Institute of Medicine Committee on the National Quality Report on Health Care Delivery.
, , , 1997. Development of a quality of care measurement system for children and adolescents: Methodological considerations and comparisons with a system for adult women. Archives of Pediatrics and Adolescent Medicine 151: 1085–1092.
, , , 1996. Variation among hospitals in coronary-angiography practices and outcomes after myocardial infarction in a large health maintenance organization. New England Journal of Medicine 335: 1888–1896.
, , and . 1998a. Assessing the predictive validity of the RAND/UCLA appropriateness method criteria for performing carotid endarterectomy. International Journal of Technology Assessment in Health Care 14(4): 707–727.
, , , 1998b. The reproducibility of a method to identify the overuse and underuse of medical procedures. New England Journal of Medicine 338: 1888–1895.
, , , 2000. Selecting target conditions for quality of care improvement in vulnerable older adults. Journal of the American Geriatric Society 48(4): 363–369.


