
Page 102
4
Private Wealth and Income Security: International Comparisons
Income security during retirement is a primary social achievement of the 20th century. As individuals retired from work at younger ages and life spans increased, the period between the formal end of work and death became one of the most significant stages of life. This enormous accomplishment, however, was accompanied by fundamental public policy challenges associated with the risks posed by population aging. The two most basic challenges were (1) that individuals would have sufficient income security during their retirement years so that retirement did not necessarily imply a substantial decline in living standards and (2) that individuals would have protection against the increasing risks of falling into poor health.
During the last century, industrialized nations responded to the problem of having sufficient income to achieve a decent standard of living during retirement by developing the now-familiar three-tiered system: the primary role of the public tier is to guarantee through governmental transfers at least a minimum income standard during retirement; the second tier is based on employer-provided pensions; and the third tier consists of wealth accumulation through private household savings (see also Chapter 3). As discussed below, individual countries in North America, Europe, and Asia have placed differing emphasis on these three tiers in devising their own unique schemes. Yet despite this cross-country diversity in policy, it is generally recognized that collectively, people in all of these countries are much better able now than they were 50 or even 25 years ago to enjoy reasonable income security during their old age.
At the same time, it is also widely acknowledged that whatever their past successes, the systems currently in place must eventually be substan-
Page 103
tially revised if the goal of adequate income security is to continue to be met in this century. Some of the challenges to the current systems stem from the demographic forces discussed in Chapter 2. First, the large baby boom cohorts born after World War II in various countries will be entering their retirement years during the first few decades of the 21st century. Issues associated with the sheer size of these cohorts are compounded by large increases in older-age life expectancy throughout Asia, Europe, and North America, which now face the new demographic reality of a constantly declining ratio of workers to retirees. This new demography implies that the financial costs of maintaining the existing income benefits of the old pay-as-you-go public-tier systems are not sustainable.
The major domestic political challenge of the 21st century concerns how countries will adapt their old-age income security and health insurance systems to meet this challenge. In this chapter we do not advocate any particular system over others. However, one option that most countries are likely to consider involves relying on individual private savings and wealth accumulation to offset any reductions that may take place in the level of public-tier support. How realistic is it to assume that individuals will save sufficiently over their lifetime to contribute significantly to their own income needs during retirement? To answer this question, one must first understand the basic motivations for household wealth accumulation. Why do some households save so little while others—even those with similar incomes—appear to accumulate so much wealth? Do individuals save primarily to leave bequests to their heirs; to reconcile differences in the timing of income and consumption over the life cycle; or to insure against future uncertainty regarding income, unemployment, or health? What role do financial inheritances play in perpetuating wealth inequalities across generations? These are basic and important research questions that require good theoretical and empirical scholarship, as well as high-quality data on household savings and wealth.
A central question regarding income security for the aged is whether individuals and families will assume greater responsibility for their own retirement if current government programs are scaled back because of budgetary pressures. In particular, will households accumulate more private wealth during their working years to finance their retirement years? A promising research strategy for answering this question is based on international comparisons. As suggested above, there is a great deal of variation in the way different countries finance the retirement of their older populations, placing differing weights on publicly provided pensions, private or employer-provided pensions, and private savings. For example, as a general rule the countries of continental Europe place much more emphasis than the United States on income security through a public-tier system. Yet some European countries rely almost exclusively on
Page 104
an integrated public tier, while others, such as the United Kingdom, use a combination of private- and public-sector resources. These combinations may produce quite different rates of income replacement during retirement, and therefore have differing implications for the incentives for private savings. For example, a public-sector benefit that provided almost complete income replacement would reduce and possibly even eliminate incentives for private retirement savings.
To address these basic questions, the panel pursued the following strategy. Because there exists much less research in Europe than in the United States on these issues, we commissioned papers from four European countries, selected on the basis of the following criteria: (1) they currently had wealth data from household surveys that were of sufficient quality to allow something useful to be learned about patterns of household wealth accumulation in the country; (2) differences in household savings across these countries span most of the variation that exists within Europe; and (3) distinguished researchers with impressive backgrounds on these topics were available to write the papers. The four countries selected were the Netherlands (Alessie and Kapteyn, 1999), Italy (Jappelli and Pistaferri, 1999), Germany (Börsch-Supan, 1999), and the United Kingdom (Banks and Tanner, 1999). To extend the comparisons beyond Europe, we also commissioned a paper on Japan (Kitamura and Takayama, 2000), a country with relatively high rates of household wealth accumulation that is experiencing population aging at a very rapid rate.
The remainder of this chapter is organized as follows. The first section highlights the main theoretical issues that arise with household savings and wealth accumulation. As we demonstrate, these theoretical questions transcend national boundaries. The second section describes the most important wealth surveys now in place in the United States, the above four European countries, and Japan and reviews the relevant data quality and measurement issues. The third section documents the most salient patterns of household wealth accumulation in the United States, Europe, and Japan, based on the data from these surveys. The final section presents the panel's recommendations regarding the policy and research questions in the domain of wealth accumulation that should be of highest priority, as well as the steps necessary to establish the research infrastructure required to address them.
WEALTH ACCUMULATION: RESEARCH FRAMEWORK AND KEY QUESTIONS
A number of questions must be addressed in examining aggregate rates of savings across countries. For example, are the reasons for savings
Page 105
unique to nations, or do some motivations transcend national boundaries? Are the citizens of some countries savers, while those of others are spenders? Do institutions and national policies matter for aggregate national savings?
An immense literature now exists on motives for wealth accumulation and savings (for an excellent survey, see Browning and Lusardi, 1996). The starting point for a wealth accumulation framework is typically the life-cycle model (or life-cycle hypothesis), which emphasizes savings (and dissavings) to deal with timing issues surrounding non-coincidence in income and consumption (see Box 4-1). According to this theory, individuals will tend to want to smooth consumption (to keep the marginal utility of consumption constant across periods), so that they will save when income is high and dissave when income is low. Browning
BOX 4-1Difficulties with Data on ConsumptionGiven the importance attached to consumption in various models, the reader might expect this chapter to emphasize the value of collecting consumption data. However, while consumption is an important variable for measuring well-being and for understanding the dynamics of asset change, this report focuses on the measurement of income and assets, partly on grounds of practicality. The problem is that the collection of reliable consumption data typically takes several hours of survey time; is subject to substantial bias (the consumption level is usually underestimated); and effectively precludes adequate attention to such critical areas as health status, labor force participation, detailed measurement of income and assets, and measurement of family structure and transfers. Thus while we recognize that consumption is a useful indicator of well-being, we do not think it feasible to include a direct measure of consumption in a dataset designed to provide the most useful, policy-relevant data on aging. There is a method of collecting consumption data that does not use up all the available survey space. This method has been used on an experimental basis, with results that can fairly be described as promising. The idea is to collect consumption data indirectly, by measuring income level, asset change from one period to the next, and capital gains over the same period. Consumption is measured as the difference between income and savings, and savings is measured as the change in net worth plus (or minus) capital losses (gains). The problem with this indirect method of measuring consumption is that, while it appears to provide an unbiased measure of consumption, it is subject to extremely large measurement errors. The first difference in net worth is a highly noisy variable, net worth in each period has a substantial measurement error, and the difference in net worth has an even larger measurement error. |
Page 106
and Lusardi (1996) provide a concise summary of some of the major implications of the theory in its purest form (the certainty-equivalence model): the path of consumption should be independent of the path of income, the elderly should run down their assets, and anticipated changes in income should have no effect on consumption. All three of these fundamental implications have been disputed empirically: consumption appears to be too sensitive to income, the elderly may not dissave since wealth profiles appear not to turn down (perhaps), and much work has been done in an attempt to separate anticipated from unanticipated income changes.
These failures of the life-cycle model have led to a number of attempts to extend or enrich the theory so these facts can be explained. A good deal of this recent work has incorporated uncertainty into the model, adding risk aversion (or precautionary savings) as a primary savings motive. At least under some conditions, uncertainty causes individuals to discount future incomes more heavily and to place a high value on social insurance schemes (such as public pension annuities) that reduce risk. Uncertainty about future income will tend to increase current savings, and, at least in earlier portions of the life cycle, consumption will tend to follow income.
In one important variant of this model, impatience for the present duels with prudence as individuals attempt to maintain a “buffer stock” of a small amount of wealth to deal with future uncertainty. The buffer stock remains small because of impatience. Another avenue explored in recent work involves liquidity constraints, i.e., the idea that individuals cannot borrow and lend at the same interest rate. Given these constraints, individuals will not be able to borrow as much as they might want to finance their current consumption. Once again in this case, consumption will tend to follow income more closely.
Another motive for saving involves bequests. Tests of a bequest motive are of three types. The first is based on the main prediction of the lifecycle hypothesis: that in the absence of a bequest motive, bequeathable wealth should decline at sufficiently advanced ages. The second type of test is based on variation in the rate of wealth change as a function of covariates that are assumed to be related to the strength of a bequest motive. An example is provided by comparing the rates among those with and without children; a consistent finding is that there is little difference. One difficulty in testing for the importance of bequest motives relates to the distinct possibility that some considerable proportion of bequests are “accidents” (see Yaari, 1965). Since individuals cannot foresee with certainty the time of their deaths, they may run the risk of dying too late, having run out of resources to finance their consumption. To guard against this risk, they will accumulate wealth; thus those who die early will leave bequests even though they do not have a bequest motive
Page 107
per se. As a practical empirical matter, however, it has proven difficult to distinguish between altruistic and accidental bequests. A third type of test is based on direct questions about savings motives. For example, Alessie et al. (1995) found that people who say they have thought about leaving a bequest save more than others.
A related but somewhat different aspect of bequests involves the extent to which past inheritances can explain the diversity in current wealth holdings by households. It turns out that financial inheritances received represent but a fraction of total net worth, so that levels and distributions of wealth would be largely the same even if the maximum contribution of financial inheritances were taken into account. For example, in the U.S. Panel Study of Income Dynamics (PSID), it was found that only one in five households had received any financial inheritances as of 1984. Smith (1999b) estimates that inheritances would account for only 13 percent of PSID 1984 wealth values, as well as 13 percent of the increment in wealth between 1984 and 1994.
Another branch of the recent literature rejects rationality in its traditional form as applied to savings behavior. Some of this literature stems from a discouragement with our ability to explain the wide diversity in savings and wealth among individuals. The nonrational theories take a number of forms, including separate mental accounts (e.g., Thaler and Shefrin, 1981) and hyperbolic discounting (Laibson, 1997).
In the context of this summary of the theory, a number of key research questions arise that could be addressed by cross-national analysis. These questions include the following:
- 1. Do the elderly dissave (a key prediction of the life-cycle model)? The lifecycle model does not imply that in the presence of uncertainty, one should start running down assets immediately after retirement, as has been stressed, for instance, by Hurd (1998). If and when individuals start depleting their wealth holdings depends on family composition, mortality risks, utility parameters, and the possible presence of a bequest motive. Thus in a formal sense, simply looking at whether the elderly dissave after retirement is not sufficient to determine the validity of the life-cycle hypothesis. However, absent a bequest motive, the hypothesis does imply that wealth should start declining sooner or later. The evidence on this matter is mixed. Hurd (1987) and Alessie et al. (1999) present evidence that this is indeed the case. Others, however—most notably Börsch-Supan and Stahl (1991) and Börsch-Supan (1992)—find no evidence for dissaving at all. Börsch-Supan and Stahl offer as an explanation that at some point, the elderly are simply no longer able to consume as much as they had originally planned because of physical (and perhaps mental) restrictions. In terms of economic theory, this would represent an unanticipated
Page 108
change in tastes. 1 More generally, unanticipated shocks (e.g., a runup of the stock market) may throw consumers off their planned consumption paths. To shed further light on this research question, one would clearly need accurate knowledge of the actual assets and liabilities of households over time. In addition, however, one would need information about the state of physical and mental health of individuals within those households and the extent to which this state was anticipated. Similarly, one would need to know the extent to which households' capital gains or losses were anticipated. There is a clear role for cross-country comparisons here, since stock markets and housing markets are certainly not perfectly correlated across countries; thus differences in movement may be exploited to identify different types of (anticipated or unanticipated) shocks.
- 2. Is there an important bequest motive for savings? One would like to know more about the various potential beneficiaries of bequests—not just relatives, but also charities. A particularly important heir is likely to be the spouse, if present. Given differential mortality between men and women, it is important to know the extent to which household planning of consumption takes into account the needs of the longest-living spouse (usually the woman) (Hurd, 1998). Cross-country comparisons are important here as well in view of the vastly different tax treatments of bequests in different countries and the variations in living arrangements that exist across countries.
- 3. Do social insurance programs for retirement income have the effect of reducing household savings and wealth? What is the effect on national savings? This is a research subject with a lengthy history (see, e.g., Feldstein, 1974; Browning and Lusardi, 1996). The main problem in investigating this issue is how to deal with individual unobserved heterogeneity. In many countries, public pension benefits are related to an individual's earnings history. Thus people who have spent much of their lives in the labor force will generally receive higher benefits than those with a less consistent labor market history. The former individuals may also be the ones who, by personality or habit, save more. They may, for instance, be more risk averse than people whose labor force attachment is looser. The result is a spurious positive correlation between savings and public pension benefits, whereas the life-cycle hypothesis would suggest a negative relationship. The use of panel data (as by Alessie et al., 1997) may circumvent this problem to some extent, as one can allow for fixed individual effects. However, use of these data leads to inaccurate results, since the remain
1Even if consumption constraints are fully anticipated, it is conceivable that wealth will increase in old age. This may occur if one cannot borrow against future annuity income and if annuity income is higher than the upper limit on consumption.
Page 109
ing variation in public pension entitlements across individuals is too limited to allow for statistically significant conclusions. A more promising approach may be that taken by Kapteyn et al. (1999), who exploit the fact that different cohorts have lived (and are living) under different expectations about their retirement provisions. According to the life-cycle hypothesis, this variation in expectations should translate into different wealth accumulation patterns across generations. The results obtained by Kapteyn et al. suggest that this is indeed the case. Also here, one would like to exploit differences in institutional arrangements across countries to obtain more reliable estimates of the effect of public pension provisions on national savings rates. The effect of survivor provisions in public pension programs on savings rates of multiperson households warrants special attention.
- 4. What is the interaction between private pensions on the one hand and private savings and wealth accumulation on the other? The issues under this question are similar to those with public pensions, except that there is generally greater individual freedom in the choice of private versus public pension arrangements. Thus the possibility of spurious positive correlations between individual wealth accumulation and pension rights is even stronger: people who save a great deal also tend to have more generous pension arrangements. Comparisons across countries open up additional identification possibilities. For instance, in the Netherlands most private pensions are tied to one's occupation, thereby severely limiting individual freedom of choice, whereas in the United States individual choice is much greater. Comparison of savings rates across such institutional arrangements would provide insight into the interrelationships between institutions and savings. For both this and the previous research question, it is of paramount importance to collect adequate (possibly administrative) data on individual work histories, characteristics of pension plans, fiscal treatment of such plans, and the like.
- 5. Is consumption smooth before and after retirement? On the one hand, the answer to this question is a crucial test of the life-cycle hypothesis, since retirement is generally fully anticipated; hence according to the lifecycle hypothesis, consumption should not be affected by retirement except for the effects of the new way of life (more leisure and possibly fewer work-related expenses). Yet empirical evidence appears to suggest that consumption declines considerably after retirement (see, e.g., Hamermesh, 1984; Banks et al., 1998). The fact that, for example, Health and Retirement Survey (HRS) data indicate that about a quarter of U.S. households arrive at (or close to) retirement with only modest amounts of wealth (less than $30,000; see Lusardi, 1999) in itself suggests that many households do not plan adequately for retirement. Generally, tests of income smoothing around retirement are hampered by the fact that hardly any reliable
Page 110
panel dataset exists that would allow one to follow consumption patterns before and after retirement closely. The collection of such data is of clear importance.
- 6. What is the effect of capital gains on active savings? If capital gains were fully anticipated, posing this research question would amount to asking what is the marginal propensity to consume out of wealth. Estimates of this marginal propensity are large enough to entail substantial risk of an economic recession if, for instance, the stock market were to suffer a major setback. Conceivably, the uncertainty involved in the value of stock holdings may reduce the tendency to consume out of capital gains. Nevertheless, Juster et al. (1999) find that $1.00 of capital gains in stocks reduces active saving by about 0.17 (see also Poterba, 2000). They also find that this effect is large enough to explain the dramatic decline in active saving in the United States since the 1980s. In view of the obvious importance of active saving to provide for old age in the future, more detailed analysis of the relationship between capital gains and active savings in different countries is required. Next to the availability of excellent wealth data, the first priority would be to have data on the extent to which capital gains are anticipated and how certain individuals feel about the value of their stock holdings. As indicated with respect to research question 1, movements in stock market prices and real estate values show enough variation across countries that these differences can be exploited to learn more about the effect of capital gains on savings.
- 7. What are the effects of health shocks on wealth accumulation and vice versa? The robust positive relationship between health and wealth is a much-studied phenomenon, but a single comprehensive explanation for this relationship appears to be lacking (see, e.g., Smith, 1999a). The effects of health shocks on wealth accumulation may be quite different across countries. In countries where individuals are generally fully insured against any major adverse health event, out-of-pocket health-related expenditures cannot be an important mechanism for the translation of adverse health shocks into lower wealth accumulation. Under those circumstances, health shocks would instead have an indirect effect, for instance through a less successful labor market history. Here as before, one runs into the problem of disentangling unobservable individual traits and observable factors. For example, people with potentially poor health may generally have less energy; hence even before a major illness occurred, they would already have earned less (and accumulated less) than other observationally equivalent individuals. Thus to shed light on the exact mechanisms involved, accurate earnings and illness histories are necessary. Cross-country comparisons can then help in identifying the exact role played by institutions. Regarding the effect of wealth, or more generally socioeconomic status, Hurd et al. (1998) find only weak evi-
Page 111
dence for a causal link between socioeconomic status and changes in health over a 2-year period, controlling for various health status measures at the beginning of the period. On the other hand, they do establish a statistically quite significant effect of health status on wealth changes over the same period. Their findings suggest that at least at older ages, differential access to health care is not a major factor in explaining the correlation between health and wealth. As Hurd et al. suggest, the fact that one does see a strong relationship between socioeconomic status and morbidity and mortality in a cross section of the elderly population may point to unobserved genetic and behavioral factors that influence both socioeconomic status and health at later ages. Clearly, one would like to be able to identify these factors, for which one would again need accurate earnings and illness histories. Further, the effect of health and wealth is likely to interact with living arrangements and family situations, which again points to the need for a multidisciplinary approach to data collection.
- 8. What is the effect of tax-preferred savings vehicles on household savings? This is a research question with a long history, especially in the United States (see, e.g., Venti and Wise, 1989, 1990, 1991; Gale and Scholz, 1994). The importance of the issue hardly requires amplification. Tax subsidies on savings may easily involve very substantial amounts; hence the effectiveness of these instruments must be evaluated carefully. To this end, one would need household panel data (among other things, to be able to correct for unobserved individual heterogeneity). A related issue has to do with the composition of household portfolios (see Poterba, 1999). In many cases, income (positive or negative) from different assets (or liabilities) is taxed differently. Examples include whether capital gains are taxed and whether mortgage and other interest payments are deductible. The differential tax treatment of income relative to different assets and liabilities has significant effects on the composition of household portfolios (see, e.g., Hochguertel et al., 1997; King and Leape, 1998; Poterba and Samwick, 1999). It may be difficult to disentangle the effects of household income and taxes through empirical work, given the systematic relationship between marginal tax rates and income. Since understanding the role of institutions is even more crucial here than is the case for some of the other research questions, it would be desirable for the data to span time periods covering (several) policy changes and/or countries with different policies regarding the fiscal treatment of saving.
- 9. Do the elderly consume their housing wealth? Despite considerable research into this issue (e.g., Venti and Wise, 1989, 1990, 1991; Sheiner and Weil, 1992), the evidence appears to be mixed. Although there are some indications that the elderly may consume their housing wealth, a great majority may not do so. Reverse mortgage schemes have met with mixed success, and the factors that determine the success of such schemes are as
Page 112
yet incompletely understood. Beyond the collection of data on actual behavior, an obvious approach is to ask elderly individuals directly why (or why not) they would consider consuming their housing wealth.
- 10. How does household wealth interact with labor market (retirement) decisions? Such interaction occurs in at least two ways. Those who have accumulated significant amounts of wealth may be expected to retire earlier than others, simply because they can afford to. In economic terms, they are consuming part of their wealth in the form of leisure. Conversely, those arriving at retirement age without significant wealth holdings may decide to return to the labor market at least part time to supplement the annuity income they are drawing from public and/or other pensions. Modeling of the interplay between wealth accumulation and labor force participation is technically complex (see, e.g., Blundell et al., 1997). The technical complications of estimating a theory-consistent model usually force researchers to estimate models that are rather loosely related to theory. Here there appears to be considerable scope for the use of subjective information, obtained, for example, by asking individuals directly about preferences and constraints (e.g., whether a job would be available if they wanted one).
- 11. Are there demographic effects in the stock market? One of the explanations sometimes given for the sharply increasing stock market prices over recent years is that demographic demand is high. Put simply, the baby boomers have reached a stage in their life cycle at which they have both the resources and the need to save for old age. They invest their money in part in the stock market, thus driving prices up (e.g., Bergantino, 1997). If this explanation is quantitatively important, one may expect the opposite stock movement in prices once the baby boom generation starts retiring. As a result, the value of an individual's stock may be much lower in retirement than is currently anticipated. Apart from studying long-term movements in stock market prices (as does Bergantino, 1997), an obvious way of learning more about the potential importance of this phenomenon is by studying household portfolios on the basis of microdata and interviewing households about their investment motives and expectations for the future. Cross-national variation in stock market performance should be useful in identifying the salience of demographic effects.
DATA SOURCES
There has been renewed interest in the United States, Europe, and Asia in the measurement of and motives for household wealth accumulation and savings behavior. Recently, wealth data have proliferated in these three regions as some prominent surveys have incorporated wealth
Page 113
modules. Moreover, many of these surveys have panel designs so that changes in wealth and savings can be investigated. Encouraged by these newly available data, researchers have formulated theoretical models focused on fundamental hypotheses about why people save (Deaton, 1992). While the issues examined are extremely diverse, these models are linked by a common need: reasonably reliable wealth and savings data to test the models' basic implications. Indeed, data quality is an issue of longstanding concern among researchers interested in wealth accumulation (Curtin et al., 1989).
This section describes in detail some important new data sources for studying the process of household wealth accumulation that have emerged in the last two decades in the United States, the four European countries selected for study by the panel, and Japan. These surveys are listed in
Box 4-2. The approaches used to measure household wealth
United States Panel Study of Income Dynamics Health and Retirement Survey Asset and Health Dynamics Among the Oldest Old Survey Survey of Consumer Finances Survey of Income and Program Participation Netherlands Socio-Economic Panel CentER Savings Survey Italy Survey of Household Income and Wealth Germany Income and Expenditure Survey German Socio-Economic Panel Soll und Haben Survey United Kingdom Financial Research Survey British Household Panel Study Japan Family Saving Survey National Survey of Family Income and Expenditure Basic Survey of Japanese Living Conditions
BOX 4-2
Surveys of Household Wealth: United States, Four European Countries, and Japan
Page 114
differ significantly among these surveys, and a number of innovative measurement strategies have been introduced.
In all countries, assets are widely believed to be poorly reported in household surveys. Indeed, the rewards for collecting household wealth data have been considered so meager that in the past, many countries simply have not made the attempt. This pessimism stems from a number of sources. First, there has been a fear that asking sensitive questions about individuals' wealth would lead otherwise willing respondents to refuse to participate in household surveys. Second, item nonresponse has been pervasive, and reported values have apparently been subject to large errors. While a number of prominent surveys throughout the world have included wealth modules, their quality has been viewed with justified skepticism, partly because of numerous missing values. Third, it is widely known that in almost all countries, the distribution of wealth is highly skewed, with relatively small numbers of households possessing a relatively large fraction of the national wealth. Unless this extreme concentration of wealth is addressed in the survey design, large portions of national wealth will be missing in the household survey.
United States
In the United States, there has been tremendous growth and improvement during the last decade in household surveys that contain significant wealth modules. These surveys include the PSID, HRS, the Asset and Health Dynamics Among the Oldest Old (AHEAD) Survey, the Survey of Consumer Finances (SCF), and the Survey of Income and Program Participation (SIPP).
PSID has gathered almost 30 years of extensive economic and demographic data on a nationally representative sample of approximately 5,000 (original) families and 35,000 individuals in those families. PSID spans all age groups, making it possible to examine wealth data across the complete life cycle. Wealth modules were included in the 1984, 1989, and 1994 waves of the survey. Another wealth module was included in 1999 and will be used every 2 years thereafter. These wealth modules incorporate transaction questions about purchases and sales so that in principle, active and passive savings can be distinguished.
Two new surveys with wealth modules for selected age populations are HRS and AHEAD. HRS is a national longitudinal sample of about 7,600 households (12,654 individuals) in which at least one person is a member of the birth cohorts of 1931-1941 (51-61 years old at baseline). HRS's principal objective is to monitor economic transitions in work, income, and wealth, as well as changes in health status. The first wave of data was collected in 1992, with a baseline response rate of 82 percent.
Page 115
The first three HRS waves are now available, 2 and follow-ups are planned every 2 years.
The companion survey to HRS—AHEAD—includes 6,052 households (8,211 individuals) with at least one member from the birth cohort of 1923 or before, thus with at least one person aged 70 or over in 1993. The baseline AHEAD interview was conducted in 1993 using computer-assisted telephone techniques for respondents aged 70-79 and computer-assisted in-person interviews for those aged 80 and over. In both surveys, blacks, Hispanics, and residents of the state of Florida were oversampled at a rate of two to one. The baseline response rate was 81 percent, and as with HRS, a follow-up is planned every 2 years.
An important advantage of PSID, HRS, and AHEAD is that they include questions that measure many components of household wealth. In addition to housing equity (with separate detail for first and second homes), the following 11 categories are used in HRS: other real estate; vehicles; business equity; individual retirement account or Keogh; stocks or mutual funds; checking, savings, or money market funds; certificates of deposit, government savings bonds, or treasury bills; other bonds; trusts and estates; other assets; and other debt. The definition of personal net worth in PSID closely parallels that used in HRS and AHEAD, but fewer and somewhat broader categories are used.
A fourth microsurvey is SCF, whose primary purpose is to obtain detailed measures of all components of household wealth. Like PSID, SCF represents the full age distribution. Since it was designed primarily as a wealth survey, SCF no doubt provides the most detailed measurement of household wealth available from a household survey, with literally hundreds of questions on wealth holdings. Many of the balances that are combined in the other surveys (such as checking and savings accounts) are probed separately in SCF. For example, checking accounts alone are separately divided into as many as seven different accounts.
Because wealth holdings are known to be extremely positively skewed, SCF combines a representative area-probability sample with a special oversample of very high-income households. The oversample is obtained by a match with Internal Revenue Service (IRS) records. One problem with the oversample is that the initial response rate was low. Some minor revisions were incorporated in the over sampling used in the SCFs conducted in 1983, 1989, 1992, 1995, and 1998.
A final set of surveys is SIPP, which has included short wealth modules since its inception. The asset coverage of SIPP is similar to that of the
2The household survey has been linked to major administrative records—Social Security and, as the respondents age, their Medicare files. In addition, summaries of pension plans are being linked to HRS.
Page 116
other surveys (except SCF), and offers the advantage that one can track time-series changes in wealth holdings since the mid-1980s. In contrast to the other microsurveys, SIPP has not made use of follow-up brackets in its wealth module.
To evaluate the quality of household surveys, one must have a standard against which the survey data can be compared. One approach to monitoring household savings and wealth accumulation over time relies on yearly data provided by the Federal Reserve on household balance sheets (Flow of Funds [FOF]). FOF data not only track trends in aggregate household net worth, but also provide details on the components that make up these aggregates.
All of these microdatasets have unique features that need to be examined carefully to ensure comparability. HRS and AHEAD are large random samples of the aging population, while PSID, SCF, and SIPP include all age groups in their sampling frames. All studies but SIPP use innovative techniques to ensure high-quality financial data (Juster and Smith, 1997). For example, PSID was the first study to use the unfolding bracket technique to mitigate the missing data problem in the measurement of household assets, and HRS and AHEAD followed suit. SCF is designed to represent the full range of the wealth distribution through the use of special sampling frames that are known to represent all high-wealth households. None of the other microdatasets (PSID, HRS, AHEAD, or SIPP) has adequate representation at the upper end of the wealth distribution. Finally, SCF obtains great detail with over 100 questions, while all the other surveys rely on fewer than 15 questions.
Despite the recent growth and improvement in household surveys containing significant wealth modules, use of these instruments to measure household wealth is beset by a number of problems. Some of the most salient of these problems, along with some of the innovations used to resolve them, are listed in Table 4-1 and discussed below. What do we now know about the effectiveness of these innovations? The quality of household wealth data appears to have risen significantly over time. Better measures of wealth are related to the use of unfolding brackets that reduce item nonresponse, oversampling of very wealthy households, and the number of questions asked. On the other hand, some of the innovations bring new problems as well.
High Rates of Item Nonresponse
The problem of widespread nonresponse to wealth questions has always plagued surveys with wealth modules. Standard techniques for imputing missing values may not help if the nonresponses differ from the responses in unobservable ways. The impact of using unfolding brackets
Page 117
|
Problem |
Solution |
|
High rates of item nonresponse |
Unfolding brackets |
|
Extreme heterogeneity of wealth |
Oversampling of extremely wealthy |
|
Insufficiently comprehensive wealth concept |
Use of three definitions:
|
|
Psychometric measurement issues, such as anchoring |
Random entry brackets |
|
Repeated measurement issues in panel surveys |
Across-wave links |
to convert missing data on wealth components into a set of categorical brackets is dramatic. On average, 90 percent of households that report not knowing the value of their asset component are willing to provide answers to these categorical bracket questions, while almost 50 percent of households that refuse to provide an estimate are willing to answer the bracket questions. The value of unfolding brackets is not simply in reducing item nonresponse, but also in obtaining more accurate measures of asset values. Juster and Smith (1997) conclude that use of this simple device increases estimates of total nonhousing net worth in the population by amounts on the order of 20 percent for the HRS sample. As is almost always the case, increases in net worth estimates bring them more in line with external control totals, and this is a quality gain.
The only survey that has not used this technique is SIPP, whose asset values are considerably below estimates from all the other surveys. For this reason, some view SIPP's wealth module with suspicion.
Extreme Heterogeneity of Wealth
Given the extraordinary skew to the wealth distribution, estimates of mean wealth are quite sensitive to whether super-rich households are included in the sampling frame. For example, the top 1 percent of SCF households possess 34 percent of total household wealth, while the upper .1 percent possess 13 percent. Not surprisingly, then, since SCF makes a special effort to include very high-income households in its sample, mean
Page 118
wealth in that survey is quite a bit higher than that in the other household surveys.
Juster et al. (1999) have evaluated the impact of this oversampling of the rich in SCF. The wealthiest PSID household would fall in the 99.935th percentile of SCF; thus PSID represents none of the wealthiest 6 in 10,000 American households. Yet this is not an unambiguous gain. The extremely wealthy remain a very difficult population to sample, and SCF response rates in this subsample are often extremely low. The result is time-series estimates of mean household wealth that are much more variable in SCF than in any of the other household surveys (and more variable relative to the FOF benchmark). PSID and HRS should never be used to describe the savings and wealth behaviors of the always intriguing but somewhat elusive extreme elite, but they may be able to describe behavior well into the 99th percentile of the population.
Comprehensiveness of Wealth Concept
Variability in the comprehensiveness of the wealth concept reduces comparability across surveys. Given the widely different ownership rates of various assets and the differing distribution of values for each asset, estimates of total household wealth will be sensitive to how inclusive the measure of wealth is. For example, stock market wealth tends to be far more unevenly distributed than wealth held in checking and savings accounts. Thus measures of household wealth that exclude stock market equity will exhibit less inequality than measures that include it. It is therefore important that the measures of net worth used in household surveys be as comprehensive as possible. 3 The main issue that arises here concerns the number of questions that must be asked to obtain a comprehensive measure. The new U.S. surveys reviewed above vary a great deal in this regard, with SCF at one extreme (more than 100) and PSID at the other (7 nonhousing questions). Nonetheless, it appears that one can characterize total household wealth holdings for the overwhelming majority of households with a relatively moderate number of questions (see Juster et al., 1999). It may be noted that some components of household wealth are measured more easily than others. At least with relatively short wealth modules, it is especially difficult to distinguish between busi-
3The role (and thus measurement) of capital gains in this regard is important, but difficult to measure accurately and comprehensively. Obviously, realized rates of return are an important source for differences in wealth levels both within and across countries. Other than some data from PSID and HRS in the United States and data expected from the British Household Panel Study, we know very little about the capital gains component of portfolio composition.
Page 119
ness and property assets and to itemize the subcomponents of the financial wealth portfolio.
In addition to the need to obtain a comprehensive measure of household wealth, wealth distributions are extremely sensitive to whether employer-provided pensions and public pensions are included in the wealth measure (see also Chapter 3). This is particularly true of countries where households save little, but can expect to have generous pension and other social security benefits. Alessie et al. (1995), for example, report that median private wealth (net worth) in the age bracket 55-59 in the Netherlands is only approximately 11 percent of median total wealth (private wealth + social security wealth + pension wealth). In the age bracket 60-64, the share of private wealth in total wealth for the median household is even less—about 8 percent.
Psychometric Issues
A number of psychometric issues arise in the measurement of wealth. For example, there is a substantial methodological literature on what are termed anchoring effects. The idea is that respondents to a survey question will make inferences about the true state of the world from the specific phrasing of the question. In effect, for respondents who lack any idea of the size of their checking and savings accounts, a sequence that starts with $100 will convey the impression that small numbers are more likely to be correct than large ones, while a sequence starting with $100,000 will convey the opposite impression—that large numbers are more plausibly correct than small ones. Results based on HRS and AHEAD suggest that these anchoring effects are quite strong: the median asset value for subsamples given a low entry point is only half as large as the median for subsamples given a much higher entry point (Hurd, 1999).
The precise phrasing of wealth questions also matters. For example, when respondents in the HRS, AHEAD, and PSID are asked about the value of their asset holdings, the initial question is phrased, “Is it more than x?,” where the value of x depends on the asset. But there are alternative ways to phrase what is essentially the same question, with the obvious possibilities being, “Is it x or more?” or “Is it more than x, less than x, or what?” The distinction among these three questions lies in whether the rounded number specified by x is associated with a yes or a no response, and whether respondents have an opportunity to indicate that their asset holdings are just about the same amount as the rounded number, neither more nor less. With respect to a yes or no response, there is the risk of acquiescence bias, whereby respondents would rather agree than disagree with a statement. Thus an answer labeled “yes” will tend to be chosen more often than one labeled “no” (Hurd, 1999). On the basis of
Page 120
analyses of data from HRS and AHEAD, it appears that there is little difference between the “x or more” and “more than x” versions. But the balanced question (Is it more than x, less than x, or what?) appears to provide a somewhat different distribution of responses, with some respondents reporting that “just about x” is the correct answer. Thus, although the use of brackets has reduced item nonresponse dramatically (as discussed earlier), the ensuing psychometric problems of anchoring and acquiescence bias still need to be addressed.
Another recent innovation in HRS and AHEAD is combining the economic modules that deal with net worth and with income. The idea is that for some income sources, data quality is enhanced if questions about assets and income are combined into a single question sequence. The gain is in the reporting of income from assets; the usual practice of having an asset module followed some time later or preceded by an income module means that questions about asset holdings are asked at a different point in the questionnaire than questions about the income from those assets. In HRS-3 and AHEAD-2, a question sequence was tried that starts with assets, moves directly to questions about income from assets, and then proceeds to questions about income amounts and periodicity. Juster et al. (2000) report that rates of missing data on income from assets are cut roughly in half by this procedure, and that mean income representing the return on assets is almost doubled. This doubling of income appears to be a quality gain since it aligns reported income from assets with the national accounts.
Repeated Measurement in Panel Surveys
A final data quality issue concerns panel use of these wealth modules to evaluate household savings behavior. Panel estimates in the United States must rely basically on HRS, AHEAD, and PSID. When successive waves of wealth modules are used to compute the wealth accumulation and savings of households, the verdict on quality must be more cautious. This need for caution stems in part from the larger role often played by measurement error in a first-difference formulation. In addition, however, few systematic attempts have been made to improve wealth measurement in panel surveys by exploiting the fact that respondents may help resolve some of the large discrepancies that arise in asset values. This is indeed an area in which much work needs to be done.
Four European Countries and Japan
The situation in Europe and Japan with respect to the quality and availability of microdata on wealth is quite diverse. In the last decade, a
Page 121
number of attempts have been made in several countries to improve wealth measurement. Each of the five countries selected for inclusion in this study has followed a somewhat different approach to wealth measurement. The diversity of outcomes among the five countries may be informative about the value of alternative approaches.
The Netherlands
The research on the Netherlands commissioned for this study was based on the Socio-Economic Panel (SEP), a representative panel survey conducted by Statistics Netherlands (see Alessie and Kapteyn, 1999, for details). SEP covers about 5,000 households and is representative of the Dutch population, with the exception of those living in institutions such as nursing homes. It contains detailed information about a number of household demographic characteristics and collects data on household income and wealth. SEP has some desirable attributes: it has been conducted annually since 1984 so that time-series changes can readily be analyzed, and it is a panel so that individual changes over time can be isolated. As is common for most wealth surveys, wealthy households are not oversampled in SEP. Because of problems in collecting the data, no asset and debt information has been gathered on the self-employed since 1990.
In SEP, each respondent in the household is asked to complete a short questionnaire on his/her assets and liabilities. The form of the questions and the timing (May of each year) have been chosen to parallel the filing of tax returns. This in principle should help in obtaining data that are somewhat similar to tax data. Nevertheless, there is a fair amount of item nonresponse, which hampers the calculation of total wealth. An analysis by Alessie et al. (1993) shows that item nonresponse leads to an underestimation of total net worth of households in SEP. The underlying reason is simply that richer households must answer more questions and thus have a higher probability of missing an item. If one then deletes all households with at least one missing item, the rich households will be underrepresented and hence also their population characteristics, such as mean net worth. Alessie et al. find that this case-wise deletion depresses an estimate of mean net worth by approximately 10 percent.
The assets distinguished in SEP include (1) checking accounts; (2) savings and deposit accounts; (3) savings certificates (certificates of deposit); (4) bonds and mortgage bonds; (5) shares, mutual funds, options, and other securities; (6) value of the primary residence; (7) other real estate (not used for own residence); (8) value of car(s); (9) net worth of own company (for the self-employed); (10) life insurance mortgage; (11) other life insurance with a saving element (starting date of the insurance,
Page 122
insurance premium); and (12) other assets. These assets are reported at the current market value. The liabilities include (1) personal loans; (2) revolving credit; (3) debt with mail orders, retail debt; (4) other purchases on credit; (5) hire-purchase; (6) remaining mortgage debt; (7) collateral-based loans; (8) debt with relatives and friends; (9) other outstanding debt, unpaid bills; and (10) debt not already mentioned. These categories have varied somewhat across the duration of the panel. The definitions of net worth, housing equity, and financial assets are quite close to those used in the major U.S. surveys. No information is available on cash holdings or occupational pensions.
A second, smaller panel with wealth information is the so-called CentER Savings Survey (CSS). The panel covers roughly 2,000 households and has collected extensive information on assets and liabilities since 1993. CSS is actually part of the so-called CentER-panel, a panel of about 2,000 households that answer questions every week on their computers (either their own or ones provided by CentERdata, the survey research agency running the panel). The computers of the panel members are linked to the central computer at CentERdata (today via Internet, in the past directly via a modem). The setup of a computer panel allows for computer-assisted interviewing; panel members can answer questions when it is convenient for them, and it is easy to go back to households to collect more information if needed. For the purpose of collecting data on wealth, the flexibility of the instrument is of particular importance. There are no constraints on the length of the questionnaire (one simply spreads questionnaires over several weeks, if needed), which makes it possible to collect a vast amount of information on the same households. Also, it is easy to enrich datasets with new information by fielding new questions when needed. 4 Despite these potential advantages, it has taken a number of years to exploit the technology in a way that does lead to better data. Alessie et al. (1999) report satisfactory outcomes of the comparison of CSS data with external sources.
Italy
The main wealth data for Italy come from the Bank of Italy Survey of Household Income and Wealth (SHIW), whose main purpose is to collect detailed data on demographics, household consumption, income, and
4An important example of this is the addition of psychological modules. In addition to such objective information as wealth, income, and labor market status, CSS contains extensive information on expectations, savings motives, risk aversion, time preferences, and the like. Several questions in the psychological module were added after they proved valuable in other surveys (e.g., HRS).
Page 123
balance sheets. This survey is representative of the Italian population and has been fielded biannually since 1984, although financial wealth data have been publicly available only since 1989 (see Jappelli and Pistaferri, 1999). Beginning in 1989, some but not all of the households were reinterviewed in subsequent panels. For example, the panel component has increased over time: in 1989, 29 percent of the households were reinterviewed, and by 1995, 45 percent were reinterviewed. Net worth is the sum of household financial assets and net real assets. Financial assets include transaction and savings accounts, certificates of deposit, government bonds, corporate bonds, stocks, mutual funds, life insurance, cash value of defined-contribution pension funds, and foreign assets. Net real assets include real estate, business, valuables, and the stock of durables net of liabilities. Liabilities are the sum of mortgage and other real estate debt, consumer credit, personal loans, and credit card debt. Exact values are requested for real assets, but financial assets are only coded into categories.
Germany
The most useful source of household wealth data for Germany is the German Income and Expenditure Survey (EVS), which has a design roughly comparable to the U.S. Consumer Expenditure Survey. EVS has been conducted since 1963 every fifth year by the German Federal Statistical Office (see Börsch-Supan, 1999). It is representative of 98 percent of the German population, the remaining 2 percent comprising those living in institutions and the super-rich. Börsch-Supan (1999) reports that only those with a monthly net income of 35,000 DM (or roughly $17,000 per month) or less are included in the survey. The main purpose of EVS is to provide a comprehensive picture of the economic situation of private households. The data include information on basic household characteristics, income by source, flows of consumption and saving expenditures by detailed categories, home ownership, and stocks of wealth by asset categories and debt. Sample sizes are around 50,000 households in each wave so that quite large cell sizes exist in all age categories, even old ages. In the past, these data have been accessible only by special permission from the German Federal Statistics Office. However, the 1993 survey was provided to all researchers as a scientific file.
EVS is primarily a consumption survey. As with many such surveys, each household keeps a monthly and at times daily household book recording all income sources and important expenditures, including all savings flows. Unrealized capital gains remain unreported. The survey concludes with a final interview at the end of the survey year, during which the household is asked to report its financial circumstances (in
Page 124
particular, the stock of wealth) and public transfer payments. This interview also serves as a control on the information given during the survey period. For example, one can check stock figures against flow data, and it is possible to deduce interest income. The data allow for the construction of two savings measures: income minus consumption and the balance between purchases and sales of assets. When information is aggregated within age classes, both measures appear to match quite closely.
Another survey conducted in Germany, the German Socio-Economic Panel (GSOEP), is an annual panel study of some 6,000 households with a design that corresponds to the U.S. PSID. The panel started in 1984, and 14 waves through 1997 are currently available. In 1990, the West German panel was augmented by an East German sample, permitting analysis of the transition in East Germany. The data are used extensively in Germany and are available to all interested researchers at a nominal cost. 5
While the GSOEP data have proven to be extremely useful for examining income and employment dynamics, they have shortcomings for use in research on savings behavior and wealth accumulation. Savings behavior has not been a major focus of the GSOEP questionnaire, and the only information on wealth that has been requested systematically in a panel is the presence of a set of assets (stocks, bonds, savings certificates, mutual funds, life insurance contracts, building society savings contracts, other financial assets, and real estate). This set of dummy variables permits a simple analysis of households' asset choices over time. In addition, the 1988 wave included a set of questions on the amount of money held in the above assets. However, item nonresponse was unusually high, and the experiment has not been repeated.
A third dataset containing information on asset holdings of households in Germany is the Soll und Haben Survey commissioned by Spiegel-Verlag. The survey covers about 5,000 West German individuals in 1980, 1984, 1989, and 1995. In 1995, about 1,000 East Germans were also included.
United Kingdom
Despite its rich tradition of high-quality surveys on consumption and income and its position as one of the financial capitals of the world, the United Kingdom has only limited household surveys that collect good wealth data (see Banks and Tanner, 1999). The most useful is the Financial Research Survey, an ongoing survey that gathers information on
5Increasing interest in the GSOEP data in the United States prompted the construction of an English-language user file. Wagner et al. (1993) report on the usefulness of the German panel data and provide English-language code books.
Page 125
around 4,800 individuals per month. Information is obtained on all financial assets and liabilities held, with banded data on balances for most. The survey also has demographic variables relating to the household to which the individual belongs; some data on income; and summary information on other financial products, such as pensions, mortgages, and insurance. There is no oversampling of high-wealth households. Detailed information is collected on categories such as savings accounts and deposit accounts at the bank or building society, National Savings products, tax-favored vehicles (such as tax-exempt special savings accounts and personal equity plans), stocks and bonds, unit trusts, and investment trusts. Summary information relating to the ownership of housing wealth and mortgages, life insurance policies, private pensions, and loan and checking account balances is collected, but neither self-assessed wealth values nor the information required to impute estimates of these values is collected for these categories. Finally, no information is gathered on the value of fixed assets or business assets (for the self-employed); information on asset values is collected within categorical limits, rather than in exact amounts. Another distinguishing characteristic is that household data are collected at the individual, not the household level.
The British Household Panel Study does not collect information on stocks of wealth or savings as part of the regular annual questionnaire. However, wave 5 (1995) included a battery of questions on wealth and assets (Banks and Tanner, 1999).
Japan
Japan has three major microdata surveys that collect information on financial assets and liabilities: the Family Saving Survey, the National Survey of Family Income and Expenditure (NSFIE), and the Basic Survey of Japanese Living Conditions. None are panel surveys. Kitamura and Takayama (2000) conclude that for purposes of describing financial household behavior, NSFIE, conducted every 5 years since 1959, is the most reliable source of information. For their analysis, they were able to use four different cross sections of NSFIE: 1979 (53,000 observations), 1984 (54,000 observations), 1989 (59,100 observations), and 1994 (56,000 observations). The response rate in 1989 was 85 percent, which is quite a bit higher than that for other household surveys in Japan (for instance, the Family Income and Expenditure Survey had a response rate of about 55 percent in 1990).
Comparisons between aggregates obtained from NSFIE and FOF and National Accounts data suggest a 40 percent underreporting of financial assets in NSFIE. Kitamura and Takayama offer three explanations for the discrepancy: (1) selective nonresponse, since wealthy households are less
Page 126
willing to participate in the survey; (2) underreporting by self-employed households; and (3) statistical errors in the FOF and National Accounts data.
Since NSFIE measures assets, income, and expenditures, one can construct both a savings measure (income minus consumption) and a wealth measure from the data. Net worth is calculated as the sum of net financial assets, net housing assets, and consumer durables.
The Japanese wealth data have some unique characteristics relative to wealth data for other countries, and these characteristics help explain certain features of the Japanese data. Two factors should be borne in mind when comparing Japanese data with those from other countries. First, it is common practice in Japan for workers to receive several years' worth of earnings as a “going-away present” when they reach the age of 55 and are expected to leave the firm in which they have worked for many years. These payments, which can be thought of as similar to the value of a defined-contribution pension plan in the United States, are counted as part of household wealth since they represent financial assets owned by the household. In countries with defined-contribution pension plans, the value of such plans typically is not included in estimates of household wealth. However, since such payments usually go only to those 55 or older, they cannot explain any of the pre-age-55 patterns that also distinguish Japanese households from those of other countries. Second, a large proportion of Japanese wealth is held in the form of home equity; for example, about two-thirds of total net worth in Japan consists of housing equity. This is presumably due to the country's high housing prices.
Assessing the Content and Quality of United States Versus European and Japanese Surveys
Not surprisingly, many of the problems described earlier for U.S. wealth surveys also plague the surveys of Europe and Japan. If anything, there appears to be more concern in Europe that including questions on wealth in household surveys will make individuals more reluctant to participate in a survey at all and will also lead to high rates of attrition in panel surveys. For example, in the 1989 SHIW, 9,427 households refused to participate, compared with 8,274 that agreed to participate. However, this problem appears to be diminishing with time. In 1995, 3,653 households refused, compared with 8,135 that participated (Brandolini, 1999). This is still a high rate of refusal by the standards of most of the more prominent American surveys, but it is not at all clear what unique role the wealth module plays in this refusal to participate. It is remarkable, as noted above, that response rates on the financial survey in Japan appear to be better than those on other comparable household surveys.
Page 127
Another generic problem is overall high rates of individual item nonresponse to wealth questions. Most European and Japanese wealth surveys have not adopted the unfolding bracket techniques that have proven so successful in reducing item nonresponse in the United States. There are some exceptions, however: the British Household Panel Survey uses unfolding brackets after a “don't know” response, while the Financial Research Survey collects wealth values in bands (Banks and Tanner, 1999). It is not clear, however, whether this was done for the purpose of improving response rates. The Italian SHIW collected data on financial assets in 14 brackets in 1991, 1993, and 1995. For real assets, the exact value was elicited.
Table 4-2 provides a checklist for the surveys of the United States, Europe, and Japan in terms of their sample design and survey content. The surveys are quite comparable across many dimensions. First, with the exception of SCF, none of the other household surveys in Japan, Europe, or the United States have high-income or high-wealth oversamples. Second, with the exception of the British Financial Research Survey (which measures only financial wealth), the definition of household wealth is remarkably similar in all countries. Third, sample sizes in the European surveys are at a minimum at least as large as those of the best American surveys. 6
There are some differences as well. Many of the European countries, as well as Japan, have no panel wealth data, so individual-level decisions on wealth accumulation cannot be modeled. Moreover, most European and Japanese household surveys have not yet attempted to integrate measures of employer-provided pensions into their household data. Finally, the European surveys and the Japanese NSFIE have tended to be regarded as economic surveys only. As a consequence, they do not include other domains of life that may either affect or be strongly influenced by income and wealth. One notable domain largely absent from both the best European surveys and the Japanese NSFIE is health, which has been shown to interact strongly with economic status (Smith, 1999a). The Dutch .
6The American HRS has evolved into a number of interrelated surveys, each representing a different set of birth cohorts. For example, the original HRS sample with a sample size of 12,654 individuals represented the birth cohorts of 1931-1941. The original AHEAD cohort with a sample size of 8,211 individuals represented the birth cohorts of 1923 and earlier. In 1998, these samples were supplemented by two new cohorts: the so-called War-Babies (those born between 1942 and 1947, with 2,511 individuals) and the Children of the Depression (representing those born between 1924 and 1930, with 2,355 individuals). In the year 2004, a new cohort, representing the Early Boomers (those born between 1948 and 1954), will be added. A common instrument is now used in all surveys. The net result is a continuing survey design that will replenished itself so that all cohorts can be studied in their pre- and postretirement years.
Page 128
|
Europe |
||||||||||
|
United States |
Netherlands |
Italy |
Germany |
United Kingdom |
Japan |
|||||
|
HRS |
PSID |
SCF |
SEP |
CSS |
SHIW |
EVS |
FRS |
BHPS |
NSFIE |
|
|
Sample Frame |
||||||||||
|
Sample sizes |
7,600 |
5,000 |
2,000-3,000 |
5,000 |
2,000 |
8,000 |
50,000 |
58,400 |
5,500 |
50,000 |
|
Age groups |
51-61 |
All |
All |
All |
All |
All |
All |
All |
All |
All |
|
Wealthy oversample |
No |
No |
Yes |
No |
No |
No |
No |
No |
No |
No |
|
Panel features |
Yes |
Yes |
No |
Yes |
Yes |
Yes |
No |
No |
Not yet |
No |
|
Survey Content |
||||||||||
|
Income |
Yes |
Yes |
Yes |
Yes |
Yes |
Yes |
Yes |
Yes |
Yes |
Yes |
|
Housing equity |
Yes |
Yes |
Yes |
Yes |
Yes |
Yes |
Yes |
Yes |
Yes |
Yes |
|
Financial assets |
Yes |
Yes |
Yes |
Yes |
Yes |
Yes |
Yes |
Yes |
Yes |
Yes |
|
Consumption |
No |
No |
No |
No |
No |
Yes |
Yes |
No |
No |
Yes |
|
Unfolding brackets |
Yes |
Yes |
Yes |
No |
No |
No |
No |
No |
Yes |
No |
|
Employer-provided pensions |
Yes |
No |
No |
No |
Yes |
Part |
No |
No |
No |
No |
|
Health |
Yes |
Yes |
No |
No |
Yes |
No |
No |
No |
No |
No |
|
Individual (I) or household (H) assets |
H |
H |
H |
H&I |
H&I |
H |
H |
I |
H or I |
H |
NOTES: HRS = Health and Retirement Survey; PSID = Panel Study of Income Dynamics; SCF = Survey of Consumer Finances; SEP = Socio-Economic Panel; CSS = CentER Savings Survey; SHIW = Survey of Household Income and Wealth; EVS = Income and Expenditure Survey; FRS = Financial Research Survey; BHPS = British Household Panel Study; NSFIE = National Survey of Family Income and Expenditure
Page 129
CentER Savings Survey is an exception, having a limited set of questions on health (including life expectancy, phrased in terms of the chances that the respondent will survive to some target age; self-assessed health; smoking; drinking; height; and weight)
Comparisons with External Controls
United States
One check on the validity of household wealth data is to compare them with other aggregate national accounts of household wealth. In the United States, the most common comparison is with the FOF accounts. Such comparisons have been conducted for a number of household surveys, in particular PSID and SCF. For example, Juster et al. (1999) report that similarly defined SCF totals were quite close to those available from FOF in most years. In contrast, the PSID totals were about three-fourths of the FOF totals. Most of the discrepancy between PSID and SCF resulted from the latter's oversample of the extremely wealthy. For example, excluding that part of the SCF oversample, aggregate PSID wealth was more than 90 percent of the comparable SCF figure.
Comparisons with external controls have also been conducted on individual-level asset categories. The most detailed study to date is that by Curtin et al. (1989). In comparing the most complete U.S. household survey (SCF) with the federal FOF accounts, they find considerable variability across different asset categories in how closely figures from SCF match those from FOF. For example, the SCF estimates of net equity in housing are substantially higher than the FOF estimates, apparently because FOF data do not make an appropriate correction for land values. In contrast, survey estimates of wealth in checking and savings accounts, bonds, and money market shares are much lower than FOF at least in art because FOF household data include liquid assets held by non-corporate business. Interestingly, FOF and survey estimates of stock holdings are almost identical.
The Netherlands
The Dutch flow-of-funds account data do not include the stock of wealth and its composition. However, Statistics Netherlands produces publications on the composition and distribution of wealth based largely on tax records—the so-called Income Panel Survey (IPS) data. The Dutch tax records are informative about wealth holdings only for households in the higher income and wealth brackets. Hence Statistics Netherlands supplements these administrative data with survey data from SEP.
Page 130
Alessie and Kapteyn (1999) compare their own calculated wealth figures based on SEP with the figures published by Statistics Netherlands. Not surprisingly, the data match well for the lower wealth deciles (because Statistics Netherlands uses SEP for these figures as well). For the higher deciles, SEP indicates lower figures for total wealth holdings than those of IPS. For instance, at the 90th percentile, the SEP figures are 13 percent below those of IPS. At the 95th percentile, the discrepancy is 21 percent.
Alessie et al. (1999) compare CSS and IPS data. They find that the CSS data indicate a 12 percent higher average net worth than that suggested by the IPS data. This discrepancy is due in part to what appears to be an underestimation of home ownership in the IPS data. Moreover, the average house value in CSS may be somewhat of an overestimation. In comparison with IPS, CSS shows a balance in checking and savings accounts that is 20 percent lower. Ownership rates for stocks, bonds, and mutual funds are considerably higher (about twice as large) in CSS than in IPS, but the unconditional means of the total value of stocks, bonds, and mutual funds are about equal. Figures for consumer credit in the two sources match quite well.
Italy
Jappelli and Pistaferri (1999) compare aggregate savings rates and aggregate wealth-to-income ratios computed on the basis of SHIW with the same concepts derived from national accounts. Savings rates based on the SHIW microdata are typically some 60 percent higher than those based on the national accounts. For example, for 1989 the national accounts imply a savings rate of 16.3 percent, whereas SHIW implies a rate of 26.4 percent, although trends in these rates over time are quite similar. The discrepancy is attributable in part to the fact that savings in SHIW are measured as income minus consumption, but consumption is not well measured, leading to a systematic downward bias. The wealth-income ratio derived from SHIW corresponds much better with the national accounts data. If one assumes that income is reasonably measured, the implication is that wealth is also fairly well measured in SHIW, at least on average.
Germany
Börsch-Supan (1999) compares income and transfer data from EVS with aggregate data from the national income and product accounts (NIPA). For 1993 he finds that the EVS figures match the NIPA data quite well. For instance, gross labor income in EVS is on average about 98 percent of the corresponding figure in the NIPA. However, a comparison
Page 131
of 1983 EVS figures on the value of financial assets with financial assets held by private households as reported by the Bundesbank shows that the former are only 29 percent of the latter. There are several reasons for this discrepancy. First, the Bundesbank includes nonprofit organizations in its definition of private households. Correcting for this practice would probably raise the 29 percent figure to something on the order of 40-60 percent (Lang, 1997). Second, EVS does not cover cash, checking accounts, and the cash value of whole life insurance and private pension claims, which would represent about 33 percent of all financial assets held by private households. Third, stocks reported by EVS appear to include only 43.5 percent of all stocks held by private households. Undoubtedly, this is due largely to the fact that the top 2 percent of the income distribution is not represented in EVS. EVS appears to overestimate home ownership as well.
United Kingdom
Official United Kingdom data on wealth stem from two fiscal sources: wealth tax and inheritance tax. Estimation of the wealth distribution on the basis of this information is wrought with obvious problems. Since the microdata for the United Kingdom are relatively weak, a comparison of the two sources is likely to be unreliable.
Japan
As mentioned above, Kitamura and Takayama (2000) compare the NSFIE data with both flow-of-funds and national accounts data and find a difference of about 40 percent.
PATTERNS OF HOUSEHOLD WEALTH ACCUMULATION
As in the other four research domains addressed in this report, cross-national research on savings and wealth is an important tool for understanding why households save at such varying rates and why they have such different levels of household wealth. There are two reasons for the importance of such research on wealth. First, countries differ across many dimensions in their observed patterns of household savings and wealth. Even with similar national incomes, some countries have high levels of household wealth, while others exhibit little evidence of much private wealth accumulation. Second, there is also a great deal of variation across countries in the constraints, incentives, and institutions that affect the private savings decisions of households. For example, an important public policy question is how government programs that provide income
Page 132
security during retirement affect household savings and wealth accumulation. This is a difficult question to answer using data from a single country, since variation among the individual components of a country's public program are relatively rare, and within-country changes tend not to be dramatic. In addition, there is a legitimate question about the extent to which within-country changes in program parameters are exogenous. In contrast, variations across countries in the way income security during retirement is provided are much larger, and thus offer considerable statistical power in testing how the design of public income security programs affects household wealth accumulation.
This section first describes what the panel believes are the most salient patterns of household wealth accumulation in the United States. These are the basic facts that theories of household wealth accumulation and savings must be able to explain if they are to be taken seriously as keys to understanding household savings. We next present a parallel summary of the most salient patterns observed in Europe and Japan, based largely on research results summarized in the papers commissioned for this study. We then examine cross-country variations in wealth levels and wealth inequality and explore some of the explanations for these variations.
Patterns of Household Wealth Accumulation: United States
Figure 4-1 highlights some of the more salient attributes of wealth distribution in the United States. The figures shown are based on PSID data, which span the entire age distribution. It is clear, first, that wealth distribution is extremely unequal in the United States. Counting all assets (including net home equity), the net worth of the median household is about $50,000. In sharp contrast, the top 5 percent of households typically have more than 10 times that amount, while the bottom third have virtually no net worth at all. If anything, indeed, reliance on PSID leads to a substantial understatement of the extent of wealth inequality since it excludes the super-rich.
Inequality is even more dramatic in financial assets alone (see Figure 4-2). Most American households have very few financial assets, but a few have a great deal. Median financial wealth is only a few thousand dollars.
It is important to understand two basic patterns in household wealth holdings—the age profile and the relation of wealth to household income. Household wealth and household income have distinctive age gradients, but the gradient is much sharper for wealth than for income, so that wealth-income ratios increase over the life cycle. For example, wealth at age 50 is about twice as high as population wealth and about 10 times higher than the wealth of those household heads under age 35.
Page 133
FIGURE 4-1 Distribution of net worth in the United States: 1994. SOURCE: Smith (in press). 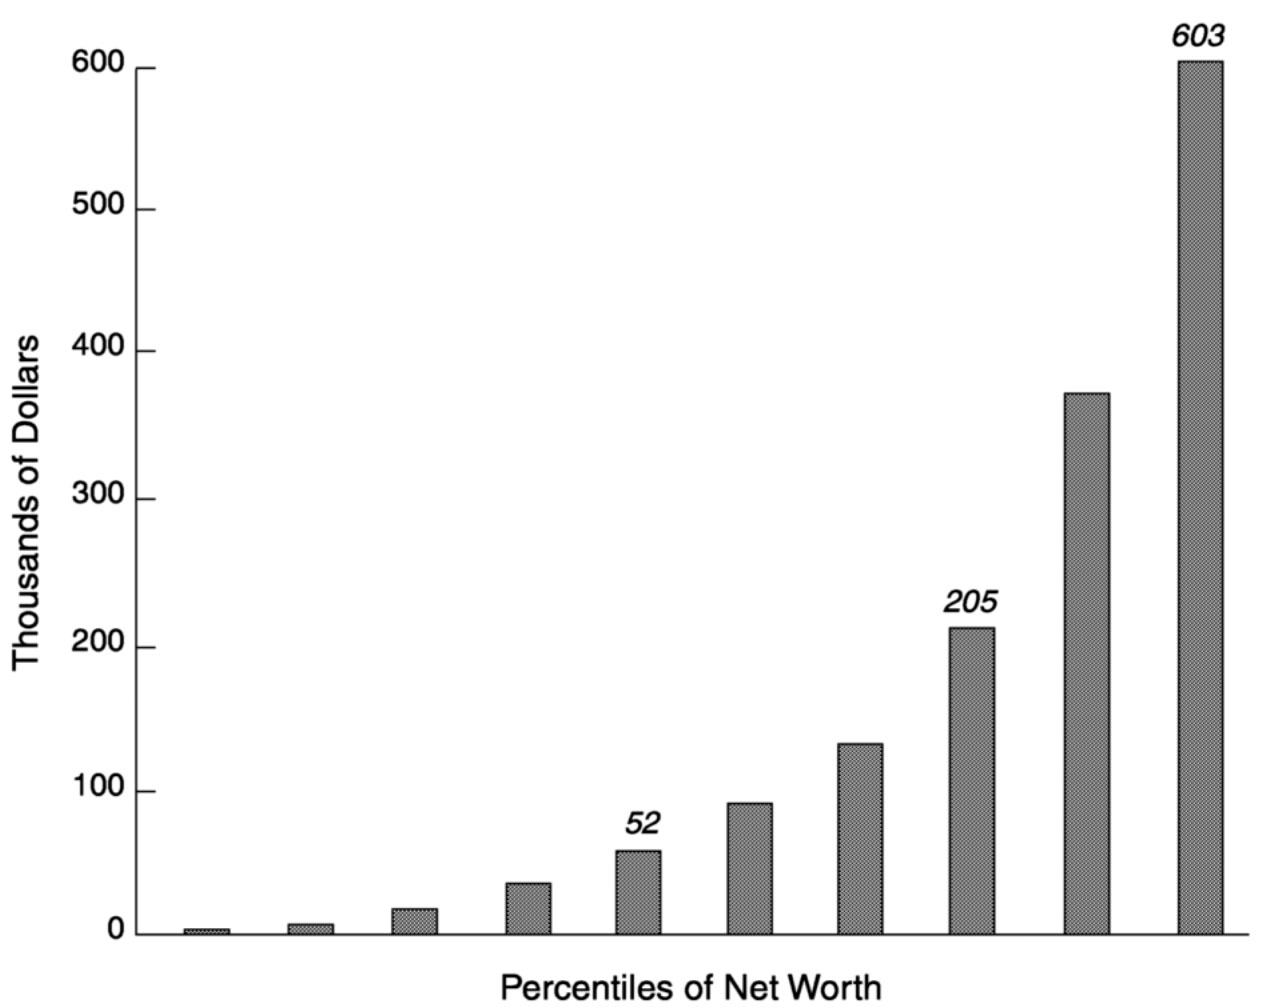
~ enlarge ~
FIGURE 4-2 Distribution of financial wealth in the United States: 1994. SOURCE: Smith (in press). 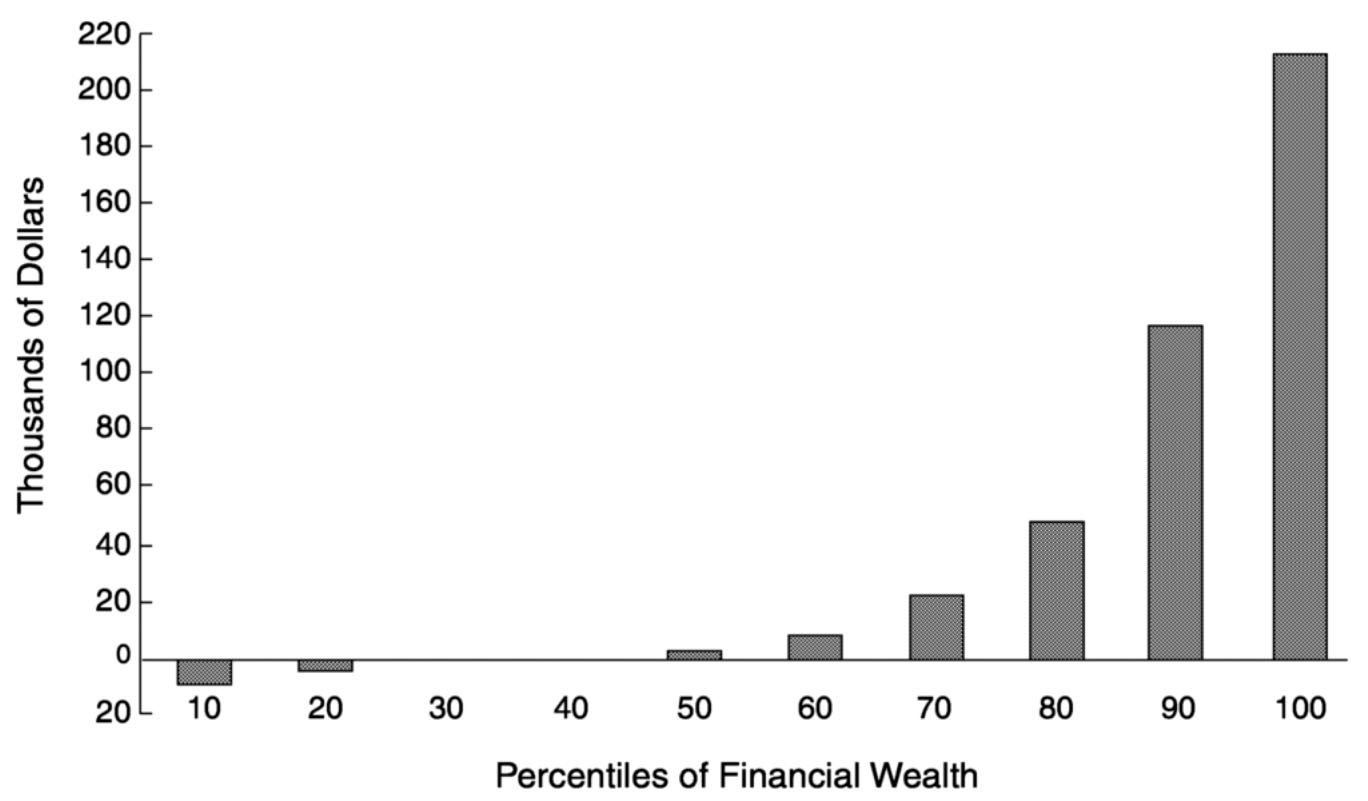
~ enlarge ~
Page 134
A critical question about the age-wealth gradient concerns whether wealth declines at older ages. A principal implication of the life-cycle model is that households will eventually dissave during the postretirement period as their consumption exceeds their income. Whether this is in fact the case is much in dispute, in part because of the small samples at this phase of the life cycle and the existence of other contaminating factors, including across-cohort increases in wealth and differential mortality by wealth. There is no dispute that just before and during retirement, the general pattern of extreme heterogeneity in wealth holdings continues to apply, with many households having almost no household wealth. This generalization is even more accurate with regard to financial assets.
To what extent can income disparities account for these large wealth disparities? Household income and wealth (as well as all key components of wealth) are strongly positively related, albeit in a highly nonlinear way. Financial assets and total net worth all increase at a more rapid rate than income as one moves from lower-income to higher-income households. To illustrate, in PSID, the median value of the total net worth of households in the median income decile is approximately $37,000. Net worth doubles between the 5th and 7th income deciles, doubles again between the 7th and 9th income deciles, and almost doubles once more between the 9th and 10th deciles. Households in the highest-income decile have six times the wealth of the median average-income household and almost 400 times as much wealth as those households in the lowest average-income decile. The increases in income across deciles are considerably smaller.
Yet it is easy to overemphasize the importance of income in determining household savings behavior and wealth. While not as frequently discussed, the diversity in wealth holdings even among households with similar incomes is enormous. Among median-income households, total net worth varies from $285,000 for those in the top 5 percent to only $8,400 for those in the bottom 20 percent. Similarly, financial assets for medianincome households vary from $105,000 (the top 5 percent) to $0 or less among the lowest 40 percent. The within-income diversity of wealth holdings holds true even among households in the lowest-income decile. About 1 in 10 such households has more than $80,000 in wealth, while more than half have $1,000 or less. At the other end of the spectrum, 1 in every 5 households in the top decile of average household income has accumulated less than $15,000 in financial assets.
Patterns of Household Wealth Accumulation: Europe and Japan
For a number of reasons, much less is currently known about motives and patterns of wealth accumulation in western Europe than in the United
Page 135
States. One reason is that European countries have lagged behind the United States in the collection of good household wealth data within their better household surveys. Fortunately, this situation is now changing rapidly in many (but not all) European countries. The panel took advantage of this positive development by encouraging new research on patterns of wealth accumulation and savings in several European countries. In addition, the Japanese NSFIE, conducted since 1959, provides invaluable information about savings and wealth patterns. We summarize the most important findings from these studies.
Cross-Country Variation in Wealth Levels and Wealth Inequality
Wealth Levels
Table 4-3 summarizes data from an OECD (1998) report on cross-country variation in household wealth accumulation. To standardize the comparison as much as possible, the data listed in the table are ratios of wealth to after-tax income for couples around age 55. The variation observed across the countries listed in this table can best be described as enormous. For example, the ratio of total household wealth to after-tax income (shown in Table 4-3 as total net worth) ranges from a high of 8 in Japan to a low of 2 in the Netherlands. 7 Even within Europe, the degree of variation is impressive. On the low end are Sweden and the Netherlands, with ratios around 2, while on the high end are France, Italy, and the United Kingdom, with average ratios of around 5. Considerable variation across these countries can also be observed in ratios of financial wealth to income. In Europe, Germany joins Sweden and the Netherlands in the lower tier, with mean levels of financial wealth representing a half-year or less of income.
Why do these countries at roughly similar levels of economic development differ so much in their private wealth holdings? Table 4-4 lists some basic summary statistics on household wealth in the five countries for which the panel commissioned papers. In light of the extreme skew that exists in most wealth distributions, both mean and median levels of household wealth are shown when available. Note that because financial wealth accumulation is of interest in its own right, this table, like Table 4-3, provides data for total net worth as well as financial wealth.
7It should be noted here that the Japanese NSFIE dataset excludes two significant categories of individuals: agricultural households and single-person households. This might be expected to produce an upward bias in the measure of total net worth shown in Table 4-3.
Page 136
|
Country |
Total Net Worth |
Financial Wealth |
|
France |
4.8 |
1.5 |
|
Germany |
3.0 |
0.5 |
|
Italy |
4.8 |
1.3 |
|
Japan |
8.0 |
1.7 |
|
Netherlands |
2.0 |
0.4 |
|
Sweden |
2.1 |
−0.1 |
|
United Kingdom |
6.0 |
0.7 |
NOTES: Data may not be strictly comparable because of different sample selection procedures (for example, the inclusion or exclusion of very-high-income households). Total net worth estimated by visual inspection.
SOURCE: Organization for Economic Co-operation and Development (1998).
Among the countries listed in Table 4-4, per capita income differences are relatively small. By comparison, however, cross-national household wealth differences are large. As suggested by Table 4-4, the lowest house-hold wealth levels are observed in the Netherlands—well less than half of the levels in Germany and a third of those in Italy. The disparities in financial wealth among the European countries listed are considerably
|
Measure |
Japan |
Netherlands |
Italy |
Germany |
U.K. |
U.S. |
|
Mean Net Worth |
4,291 (397,046) |
100,995 (46,458) |
154,385 (154,385) |
245,265 (130,194) |
N/A |
158,500 |
|
Median Net Worth |
2,733 (252,884) |
42,847 (19,710) |
92,909 (92,909) |
117,394 (62,317) |
N/A |
50,600 |
|
Mean Financial Assets |
1,279 (118,346) |
24,917 (11,462) |
20,377 (20,377) |
61,557 (32,677) |
7,136 (11,632) |
53,300 |
|
Median Financial Assets |
765 (70,785) |
7,240 (3,330) |
7,349 (7,349) |
33,751 (17,916) |
554 (903) |
4,200 |
NOTES: Amounts for Japan are in 10,000 1994 yen, for the Netherlands in 1987 guilders, for Italy in 1995 Euros, for Germany in Deutschmarks, for the United Kingdom in 1997 pounds, and for the United States in 1996 dollars. Figures in parentheses show the crude conversion to 1996 U.S. dollars. N/A = not available.
SOURCES: Kitamura and Takayama (2000); Alessie and Kapteyn (1999); Japelli and Pistaferri (1999); Börsch-Supan (1999); Banks and Tanner (1999); Smith and Smeeding (1998).
Page 137
smaller. For all countries listed, mean financial wealth is relatively small, amounting to little more than a year's income. Most dramatic, Japan has by far the largest mean and median wealth levels. The United States has the second-highest mean wealth levels, but this appears to be largely the consequence of a reatively small number of household having signifianct amounts of financial wealth is actually less in the United States than in Italy or Germany.
Wealth Inequality
The second salient aspect of household wealth holdings is that they are distributed quite unequally across households. The large differences between median and mean wealth in Table 4-4 suggest that inequality is a common characteristic of wealth holdings in all the countries shown. There are many ways to measure inequality, but two of the most common are the wealth share of the top 1 percent and the Gini coefficient. Table 4-5 lists these two summary measures for a number of countries. Just as there are large cross-national differences in wealth levels, there are correspondingly large differences in dispersion. The United States appears to be in a class by itself on this metric, with wealth inequality far in excess of that of any of the other countries listed. For example, one-third of household wealth in the United States is held by only 1 percent of the population. The country nearest to the United States on this metric is France, with 26 percent. At the other extreme, the most egalitarian country listed is Sweden, where the top 1 percent of the population controls 16 percent of household wealth—half the U.S. statistic.
Table 4-6 and Table 4-7 show in more detail the extent of inequality for the countries for which the panel commissioned papers that provided rel-
|
Country |
Wealth Share of Top 1% |
Gini Coefficient |
|
United States |
35 |
79 |
|
Canada |
17 |
69 |
|
France |
26 |
71 |
|
Denmark |
25 |
N/A |
|
Germany |
23 |
69 |
|
Sweden |
16 |
59 |
|
Japan |
N/A |
52 |
NOTE: N/A = not available.
SOURCE: Davies and Shorrocks (1999).
Page 138
|
Decile |
Japan |
Netherlands |
Italy |
Germany |
United States |
|
10 |
.13 |
.00 |
.07 |
.03 |
.00 |
|
20 |
.29 |
.07 |
.19 |
.10 |
.06 |
|
30 |
.50 |
.21 |
.42 |
.24 |
.24 |
|
40 |
.74 |
.47 |
.69 |
.51 |
N/A |
|
50 |
1.00 |
1.00 |
1.00 |
1.00 |
1.00 |
|
60 |
1.30 |
1.81 |
1.3 |
1.46 |
N/A |
|
70 |
1.70 |
2.83 |
1.77 |
1.92 |
2.41 |
|
80 |
2.25 |
3.99 |
2.40 |
2.42 |
N/A |
|
90 |
3.37 |
6.10 |
3.66 |
3.46 |
7.12 |
NOTE: N/A = not available.
SOURCES: Kitamura and Takayama (2000); Alessie and Kapteyn (1999); Japelli and Pistaferri (1999); Börsch-Supan (1999); Smith (in press).
evant data. To eliminate the local currency problem, a straightforward way of measuring inequality is to index wealth holdings at selected deciles relative to the median. This procedure is followed for total household wealth in Table 4-6 and for total financial wealth in Table 4-7.
All countries in these tables are characterized by considerable household wealth inequality, but there also exists much variation across countries in the extent of this inequality. Inequality in financial wealth is clearly much higher in the United States than in any of the other countries
|
Decile |
Japan |
Netherlands |
Italy |
Germany |
U.K. |
United States |
|
10 |
.16 |
−.65 |
.06 |
.02 |
0 |
−1.48 |
|
20 |
.36 |
.01 |
.14 |
.18 |
0 |
−.26 |
|
30 |
.55 |
.23 |
.39 |
.39 |
0 |
0 |
|
40 |
.76 |
.57 |
.66 |
.66 |
.22 |
N/A |
|
50 |
1.00 |
1.00 |
1.00 |
1.00 |
1.00 |
1.00 |
|
60 |
1.31 |
1.61 |
1.16 |
1.40 |
2.53 |
N/A |
|
70 |
1.75 |
2.60 |
2.23 |
1.91 |
3.98 |
6.52 |
|
80 |
2.48 |
4.30 |
3.74 |
2.74 |
9.12 |
N/A |
|
90 |
3.91 |
8.26 |
6.59 |
4.34 |
20.60 |
34.60 |
NOTE: N/A = not available.
Page 139
shown and is lowest in Japan, with Germany a close second. In the United States, for example, households in the 90th financial wealth percentile have 35 times as much wealth as the median household. In this ranking, the United Kingdom is a distant second, with households in the 90th percentile having 20 times as much financial wealth as the median household. Thus while wealth inequality is thought to be high in the other European countries and Japan, it is considerably lower than in either the United States or the United Kingdom.
One reason wealth inequality is higher in the United States is that income inequality is also higher, yet this is not a sufficient explanation for the extent of the difference between the United States and Europe on this measure. Once again, the issue is not so much the behavior of the typical household in these countries, but why the top fifth of U.S. households accumulate so much wealth relative to the top fifth in Europe or Japan. Possible answers certainly include the effects of the tax and welfare systems in the various countries.
There is also considerable divergence among these countries with regard to trends in wealth inequality during the last few decades. The trend in the United States is clearly toward increasing wealth inequality (Smith, 1999a), at an even more rapid rate than the growth in income inequality. In contrast, Alessie and Kapteyn (1999) demonstrate that wealth inequality has been declining in the Netherlands during the same period. The differing patterns in the two countries appear to be due to price trends for two different assets in the wealth portfolio. In the United States, rising wealth inequality is largely the consequence of a very rapid increase in equity prices (Juster et al., 1999). Stock market equities are a minor part of the wealth portfolio of middle- and lower-income households in the United States, but a much larger part of the portfolio of higher-income households. Consequently, the major beneficiaries of the stock market boom in the United States have been the wealthy. In contrast, the major asset driving inequality in the Netherlands has been the home. Between 1987 and 1996, housing prices in the Netherlands doubled. Over the same period, home ownership increased from 42.7 to 50.5 percent. Since housing represents a larger portion of the portfolio of not-so-rich households than of the rich, the dispersion of the wealth distribution has been somewhat compressed. With regard to the other countries shown in Table 4-6 and Table 4-7, Jappelli and Pistaferri (1999) report that in Italy, wealth inequality has risen slightly over the last decade or so. Kitamura and Takayama (2000) suspect that wealth inequality in Japan rose between 1984 and 1994, but they have not calculated a Gini coefficient for 1994.
Page 140
Explanations for Wealth Differences Across Countries
Income differences among countries are unlikely to explain much of the cross-national disparity discussed above since income per capita is roughly similar in all the countries examined. The explanation is more likely to lie in differences among the countries in their institutions and their incentives to save. These institutional differences may reside in housing or insurance markets or in the way income insurance schemes have been structured.
Home Ownership
In most countries, the single most important asset people possess is their own home. In the United States, for example, housing equity represents one-third of total net worth, but even this statistic severely understates the role of home equity for most Americans. Home ownership is even more salient for the typical household, often being its only asset of much value. The extent to which individuals can own and subsequently build up equity in their home is probably the most crucial determinant of the level and distribution of wealth in any country.
Home equity is influenced by several personal, market, and institutional factors that vary considerably across countries. At the personal level, the three most critical attributes are age, marital status, and income. Home ownership rates vary considerably with age: people typically save for a down payment when they are young, often upgrade their homes during middle age as their families and income grow, and perhaps move once again during their retirement to a smaller home with more location-specific amenities. Income is clearly a critical determinant of the value of the home one can afford, and marital status is the best single indicator of family formation. But in addition to these personal-level attributes, countries differ in their housing markets and credit institutions—differences that strongly impact the ability of households to own and finance a home. 8 Finally, country-specific housing market price cycles can create substantial capital gains or losses on the existing stock of homes.
Table 4-8 lists rates of home ownership for single and married couples at ages 55 and 67 for selected OECD countries. In most countries, more than 80 percent of couples own a home by age 55. The two principal exceptions to this widespread prevalence of home ownership are the Netherlands and Germany. Rates of home ownership have traditionally
8It might also be argued that in some countries more than others, cities are places people want to live in, and renting is more common as a result. Further, housing subsidies for the middle class differ by country.
Page 141
|
Age 55 |
Age 67 |
|||
|
Country |
All Singles |
All Couples |
All Singles |
All Couples |
|
Australia |
56.5 |
85.7 |
67.2 |
91.6 |
|
France |
65.0 |
80.0 |
65.0 |
84.0 |
|
Germany |
32.4 |
58.8 |
36.2 |
57.6 |
|
Italy |
69.5 |
83.2 |
63.4 |
82.4 |
|
Japan |
55.6 |
83.7 |
73.8 |
91.7 |
|
Netherlands |
32.8 |
59.7 |
18.6 |
40.8 |
|
Sweden |
44.2 |
84.2 |
39.9 |
75.0 |
|
United Kingdom |
45.7 |
75.1 |
42.3 |
66.2 |
|
United States |
56.3 |
89.8 |
65.8 |
88.3 |
SOURCE: Organization for Economic Co-operation and Development (1998).
been much lower in the Netherlands than in the rest of Europe because of a heavily regulated housing market for a long period after World War II. Now that the market is deregulated, ownership rates have been increasing rapidly in the last decade. As mentioned above, Alessie and Kapteyn (1999) report that between 1987 and 1996, the rate of home ownership increased in the Netherlands from 43 to 51 percent.
Italy is an important special case that illustrates the role credit market imperfections can play in wealth accumulation (see Jappelli and Pistaferri, 1999). Imperfections in the Italian housing mortgage market have been pervasive in the last few decades as compared with the situation in the rest of Europe. These imperfections are manifested in the form of very high down payments (40 to 50 percent of purchase prices), a shorter mortgage maturity (20 years), and higher interest rates. Italians still strive to own their own homes, but given these credit imperfections must rely more on their own savings (as well as transfers from their relatives) to meet down payment requirements. The result is a very low rate of home ownership among younger Italians as they struggle to save for this purpose. The relatively high rates of wealth accumulation in Italy shown in Table 4-4 can best be understood as a consequence of the high rates of household savings required for home ownership. As Italy has developed economically over the last two decades, capital markets in housing have improved, and the savings required to finance a home have decreased. Indeed, Jappelli and Pistaferri (1999) conclude that improvements in the Italian mortgage lending market are the most likely explanation for the steep decline in Italian savings rates that has taken place in the last decade.
Page 142
Cohort Trends
For the United States, the four European countries for which the panel commissioned papers, and Japan, one of the most salient patterns in household wealth accumulation is the very strong trends across cohorts. In all these countries, younger cohorts have considerably more household wealth than did older cohorts at the same age.
Figure 4-3 shows median net worth and financial wealth, respectively, by age and cohort for the Netherlands. Each line in the figure represents median net worth (top panel) or median financial wealth (bottom panel) of a 5-year birth cohort. For instance, the lines labeled 63 represent those born between 1961 and 1965. The figures illustrate a steep growth in net worth between 1987 and 1995 for all cohorts except the elderly. In part this reflects the rise in housing prices referred to earlier. Since home ownership is much less prevalent among the elderly than among the young, the median net worth of the elderly is less affected by a boom in the real estate market than is the net worth of other households. The figures also illustrate the misleading picture that a purely cross-sectional analysis would provide. For instance, the lower end of each line gives the median net worth of a birth cohort in 1987. If we connect the lower end of all lines, we obtain a cross-sectional age-wealth profile for 1987, which is nicely hump shaped as the life-cycle hypothesis would predict. Obviously, this is an artifact, as the cohort graphs clearly demonstrate. Financial wealth also exhibits substantial cohort effects, but they are less important in monetary terms.
Figure 4-4 illustrates cohort effects for Italy. Although these effects are clearly present here as well, a cross-sectional profile would be less misleading than in the Dutch case. Figure 4-5 illustrates the similarly strong cohort effects revealed by Japanese data between 1979 and 1994.
Income Replacement
There is considerable variation in the way different countries finance the retirement of their older populations. In particular, countries place differing weights on publicly provided pensions, private or employer-provided pensions, and private savings. Some European countries rely almost exclusively on an integrated public tier, while others, such as the United Kingdom, use a combination of private- and public-sector resources. These combinations may produce differing rates of income replacement during retirement, and therefore have different implications with regard to incentives for private savings. For example, a public-sector benefit that provided almost complete income replacement would reduce and possibly even eliminate incentives for private retirement savings.
Page 143
FIGURE 4-3 Median net worth and financial wealth by age of household head and cohort in the Netherlands: 1987 to 1996. SOURCE: Alessie and Kapteyn (1999). 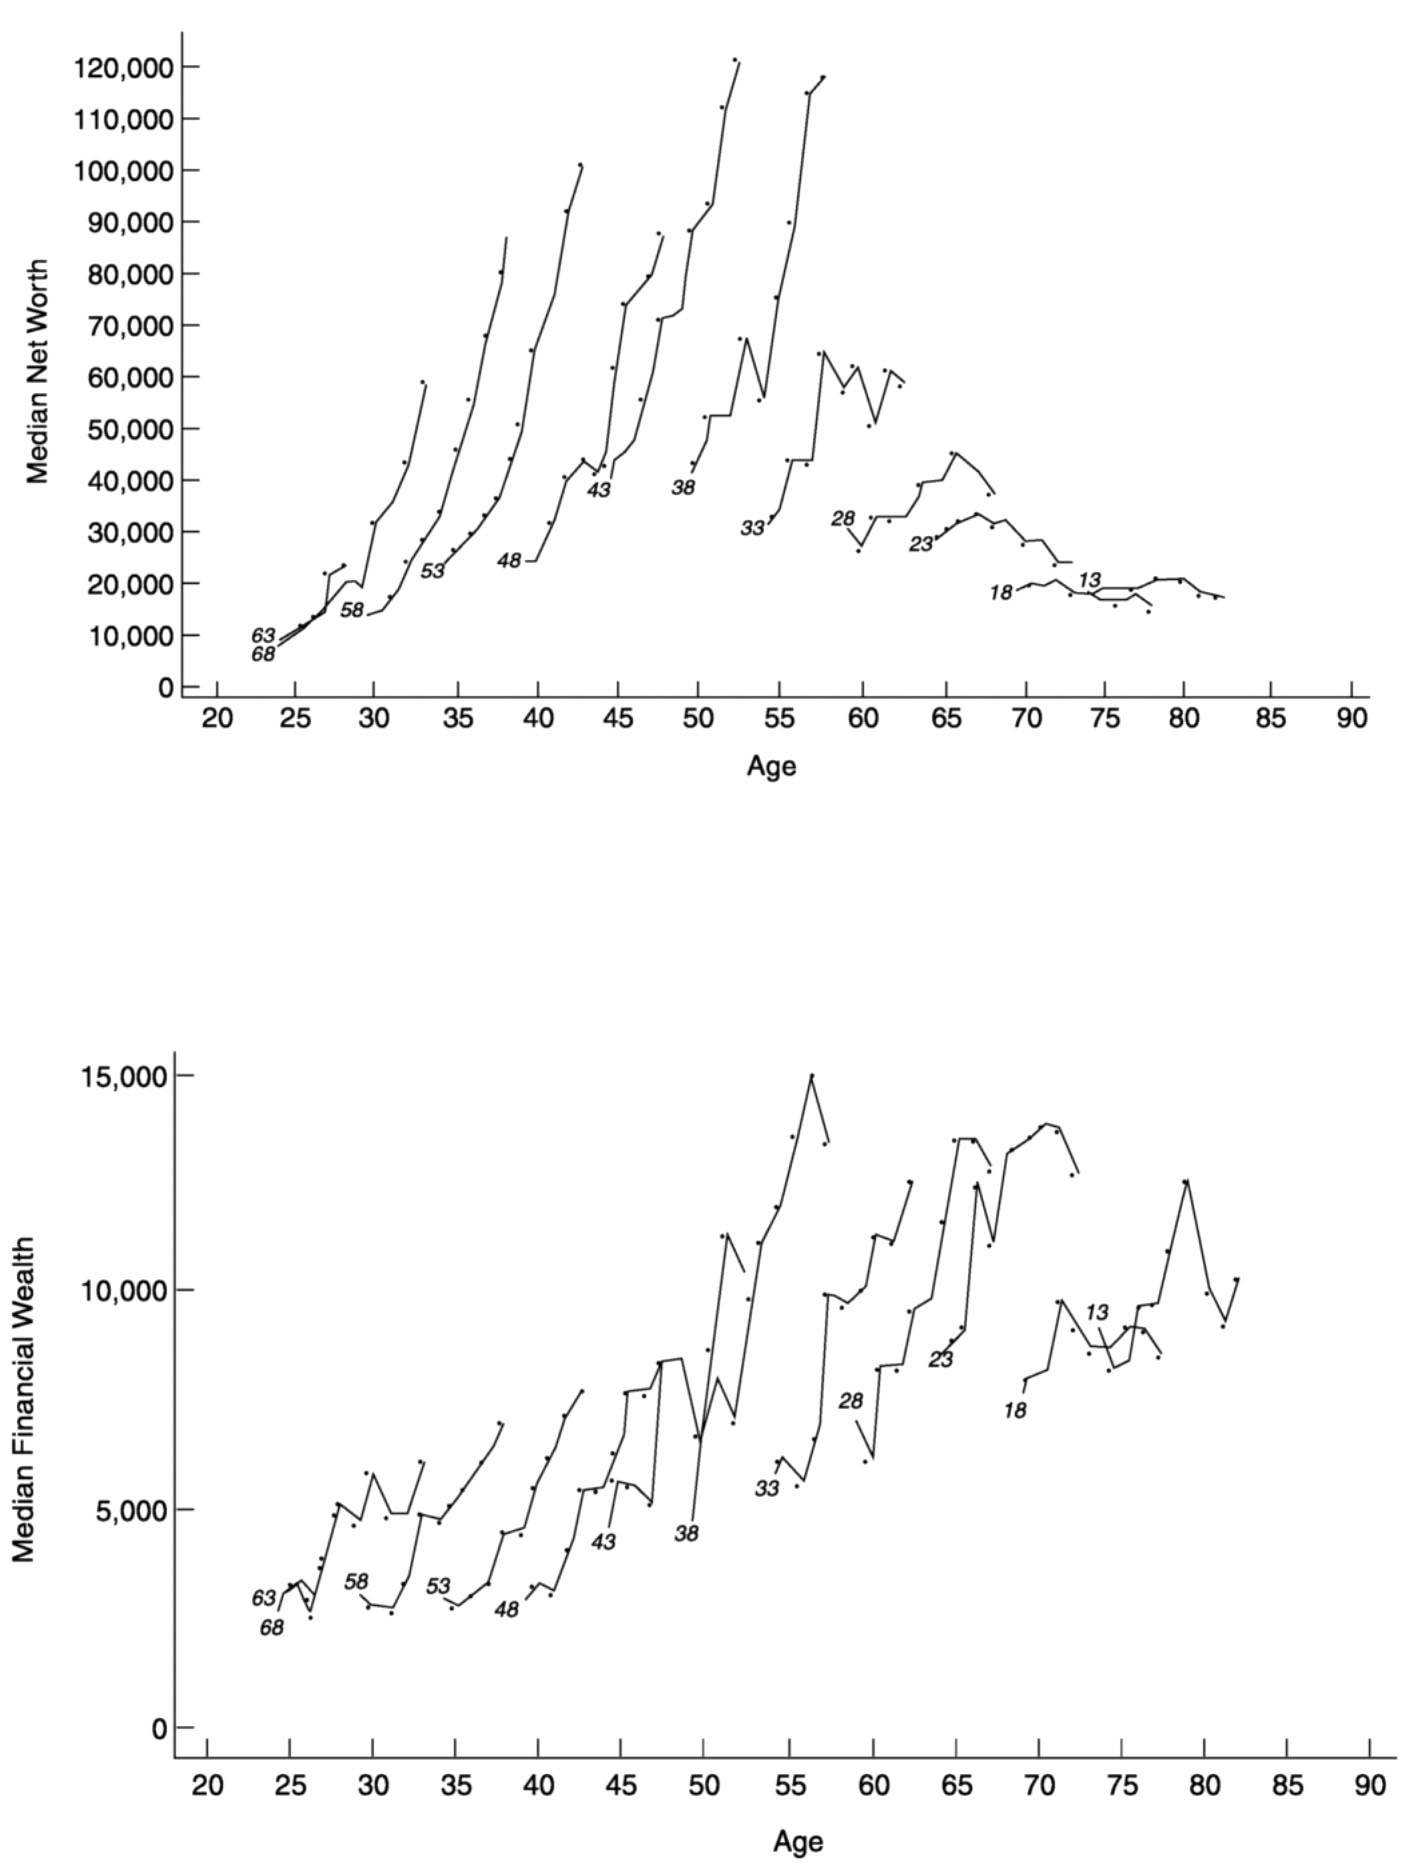
~ enlarge ~
Page 144
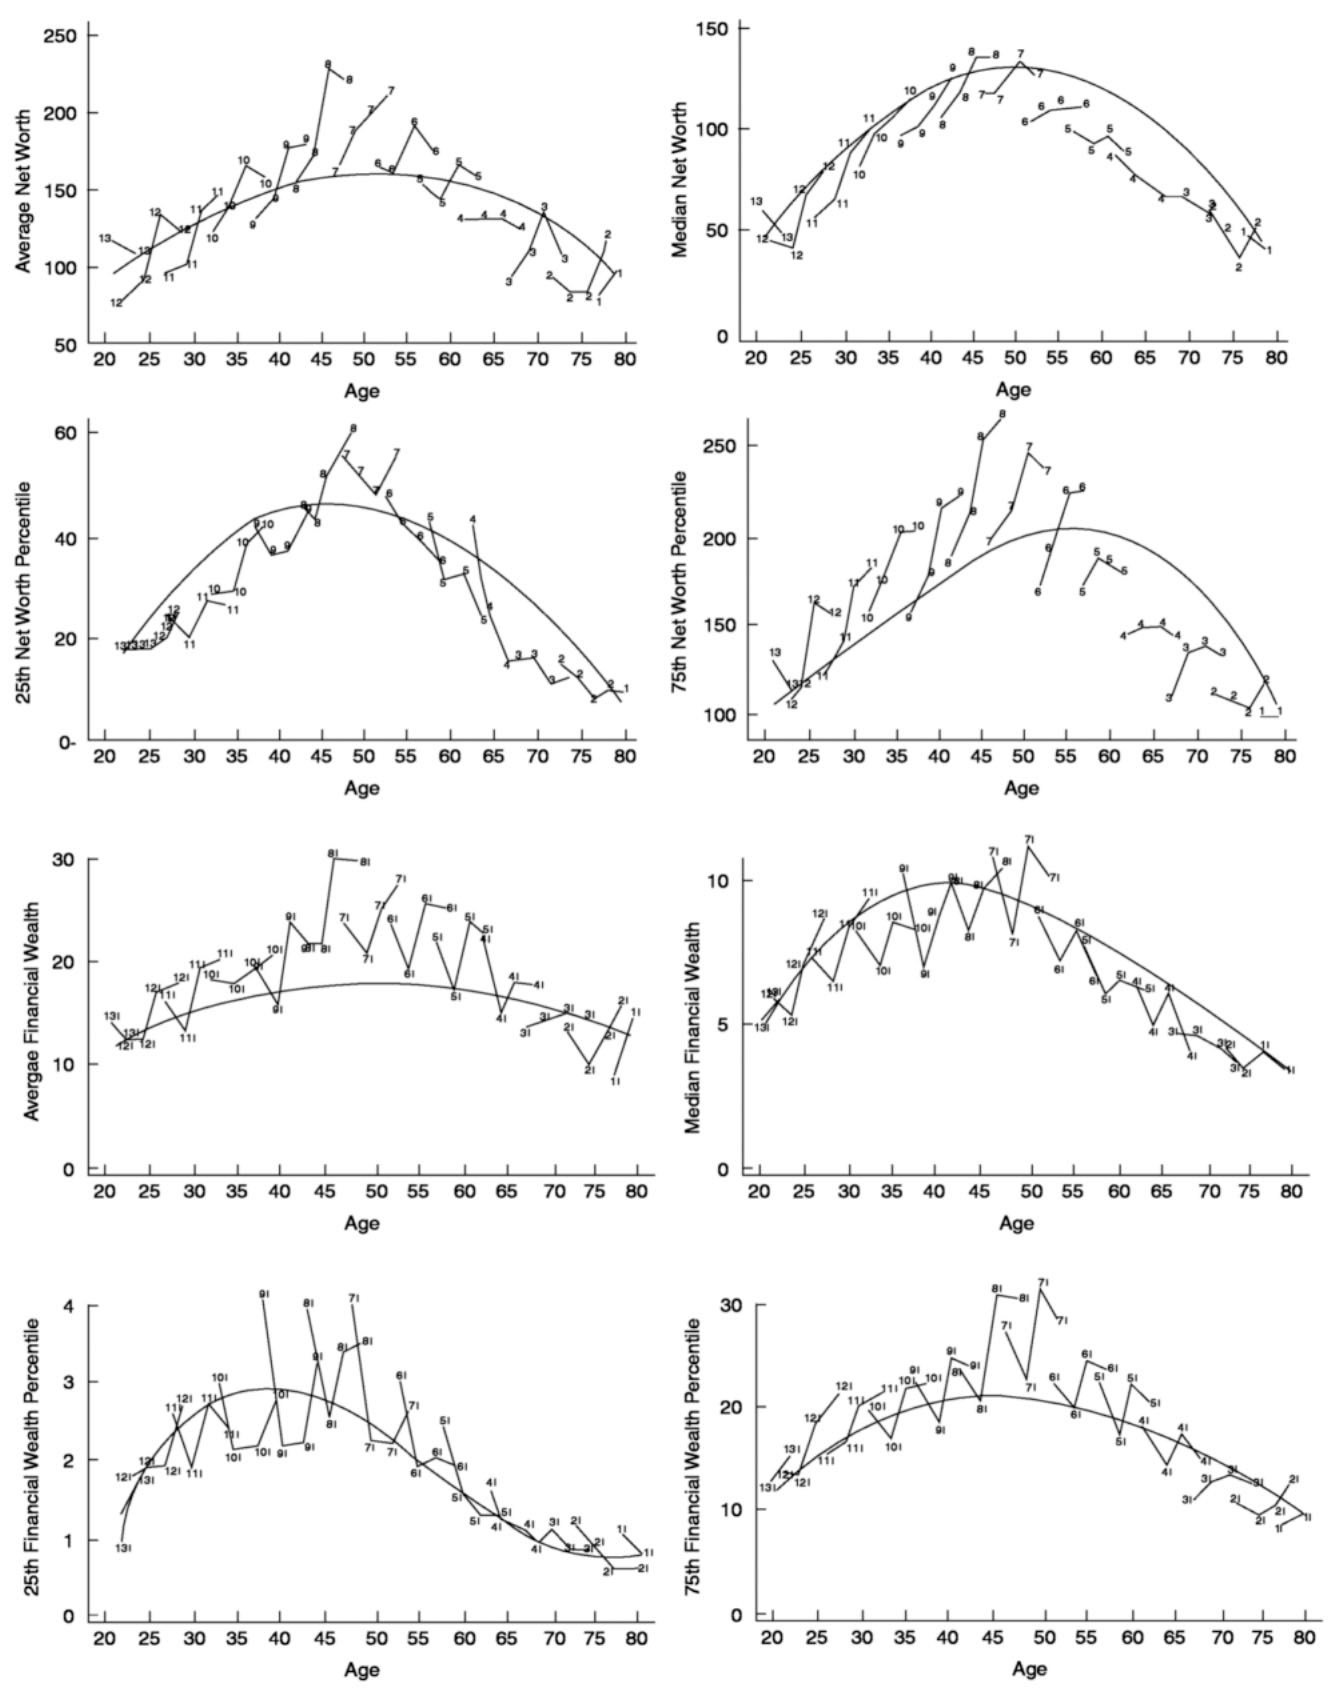
~ enlarge ~
FIGURE 4-4 Measures of net worth by age of household head and cohort in Italy: 1989 to 1995.
NOTES: These figures plot wealth by age of 13 cohorts: cohort 1 includes all households whose head was born between 1905 and 1909, cohort 2 those born between 1910 and 1914, and so on up to cohort 13, those born between 1965 and 1969. Each cohort is observed at four different times, one for each cross section. The line in each graph is obtained by regressing wealth on a fourth-order polynomial, a full set of dummies, and a set of restricted time dummies. The data are drawn from the 1989-1995 SHIW. Values are converted in thousands of 1995 Euros.
SOURCE: Jappelli and Pistaferri (1999).
Page 145
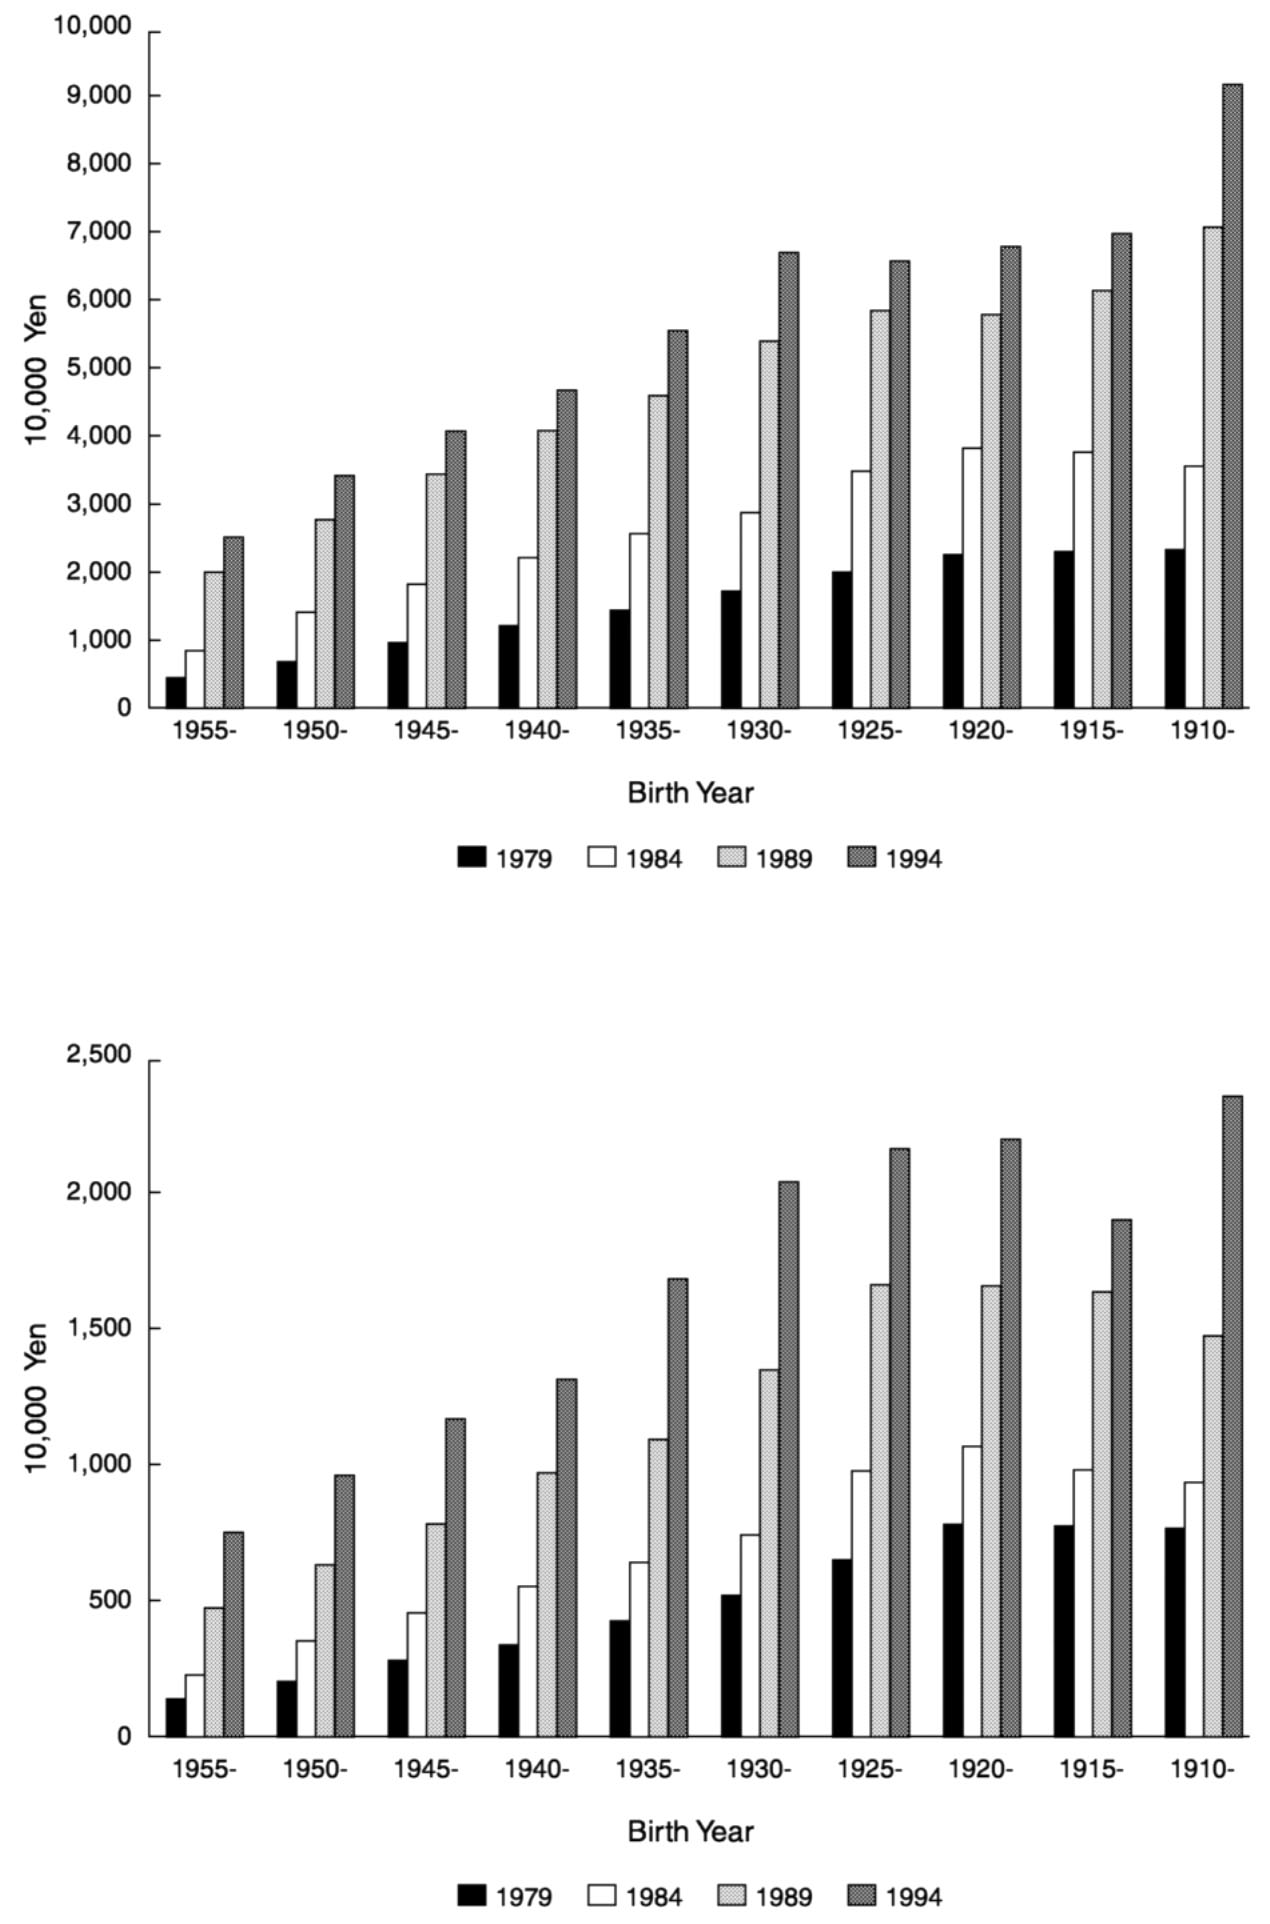
~ enlarge ~
FIGURE 4-5 Net worth and net financial assets by birth year of household head in Japan: 1979 to 1994.
SOURCE: Kitamura and Takayama (2000).
Page 146
|
Country |
All Disposable Income |
Public Transfers Only |
|
France |
80 |
61 |
|
Germany |
85 |
63 |
|
Italy |
80 |
25 |
|
Japan |
76 |
42 |
|
Netherlands |
78 |
50 |
|
Sweden |
78 |
75 |
|
United Kingdom |
68 |
35 |
SOURCE: Organization for Economic Co-operation and Development (1998).
Table 4-9, based on a recent OECD study, lists rates of income replacement during retirement for six European countries and Japan. In each country, these numbers were computed in a cross section as the ratio of the after-tax incomes of individuals at age 67 to the after-tax incomes of individuals at age 55. In addition to total income replacement rates, the table shows retirement income replacement based only on the public-tier program.
Throughout Europe, total income replacement rates are about .8 and are similar across countries. If anything, retirement income replacement is understated in these tables since income growth across cohorts implies that the incomes of those currently age 55 are higher than the incomes of those currently age 67 when they were age 55. Just 1 percent income growth per year would lead to essentially complete income replacement in virtually all European countries. Even without taking work-related costs into account, on average many European workers are better off when they retire than when they are working.
The similarity across European countries in total retirement income replacement rates disappears when we examine public transfers only—a reflection of differences in the way the various countries have designed their old-age pension systems. Since the portion of the system that lies formally outside the public tier is usually heavily controlled (or at least influenced) by the respective governments as well, it generally makes sense to examine the total retirement system, not just the public transfer portion.
Retirement Income Security
An important policy issue across all Western countries is the extent to which government social insurance programs during retirement substitute for or crowd out private savings (see Smith and Smeeding, 1998, and
Page 147
|
Poverty Rate as % of GDP (circa 1992) |
Guaranteed Minimum as % of Median National Income |
Social Retirement Pensions as % of GDP |
||||
|
Country |
40% |
50% |
1995 |
2030 |
Diff |
|
|
United States |
13.4 |
22.7 |
34 |
4.1 |
6.6 |
2.5 |
|
Germany |
4.5 |
8.1 |
52 |
11.1 |
16.5 |
5.4 |
|
United Kingdom |
10.9 |
30.5 |
43 |
4.5 |
5.5 |
1.0 |
|
Canada |
1.5 |
7.1 |
56 |
5.2 |
9.0 |
3.8 |
|
Australia |
7.1 |
28.6 |
51 |
2.6 |
2.9 |
0.3 |
|
The Netherlands |
3.0 |
4.4 |
66 |
6.0 |
11.2 |
5.2 |
|
Sweden |
1.5 |
6.4 |
63 |
11.8 |
15.0 |
3.2 |
the discussion in Chapter 3 of this report). Most modern nations face challenges of an aging population that are similar to that in the United States. Nearly every country has a pay-as-you-go social retirement scheme that will be put to the financial and political test over the next 30 years. Each nation also has some mix of employer-provided pensions, own savings, earnings, and targeted benefits for the poor that helps them meet income security goals.
Income security policy goals include preventing poverty in old age, encouraging private savings, encouraging work at older ages, and ensuring desired rates of income replacement in retirement. What differs across countries is the extent to which each of these goals is pursued and the costs incurred. Table 4-10 summarizes several salient features of retirement income security systems for seven modern nations.
Poverty rates in old age vary substantially across nations. The first two columns of Table 4-10 show the percentage of persons aged 65 and over with disposable incomes (adjusted for differences in family size) of less than 40 or 50 percent of the overall national median disposable income. The table also shows the minimum guaranteed income for a single, older person as a percentage of the same adjusted national median income for each nation. 9 Nations with relatively low minimum benefits
9These minimum income systems usually involve two items: a flat old-age security benefit within the social retirement system, and some type of income or income and asset means-tested general revenue-financed “welfare” benefit for older persons. In the United States, the system involves the result of combining Old-Age and Survivor's Insurance (OASI), Supplemental Security Income (SSI), and food stamps. In many other nations, the flat old-age security benefit (minimum social security benefit) is higher, and the income-tested benefit is higher still. In Sweden, the policy goal is to have a guarantee at or above 60 percent of the median.
Page 148
(United States, United Kingdom) have relatively higher poverty rates. Other nations with well-targeted, high-participation-rate welfare systems (e.g., Canada) or those with relatively high lower-tier social retirement benefit levels (the Netherlands, Sweden, Germany) have lower overall poverty rates. Australia is unique in that it has no social security system, only a means-tested income support system, financed by general revenues to prevent old-age poverty. While this system produces only a 7 percent poverty rate at 40 percent of the median income, it results in a 29 percent rate at half of the median.
These data also raise the question of what is meant by the generosity of a program. In the United States, for example, if social security is evaluated on the basis of replacement of income before retirement, it is a generous program indeed. Another definition of generosity is how much income is received relative to the median income of the society. On this basis, the U.S. system appears far less generous than those of other nations. 10
Table 4-10 also summarizes the OECD forecast for the financial cost of the social retirement system alone (as a percentage of GDP) if it were to continue its current level of benefits and participation rates over the next 30 years. Most American analysts are concerned about the future of the U.S. social security system, which would consume 6.6 percent of GDP in the year 2030. The gap between this figure and that for 1995, which must be made up by either benefit reductions or tax increases, is 2.5 percent of GDP. In contrast, the nations with high social retirement benefits—Germany, the Netherlands, and Sweden—are confronting much larger gaps while also starting from much higher bases; Canada faces a larger gap while starting from a slightly higher base. Each of these nations relies heavily on its social retirement system to finance old-age income support. For the median elderly person, German, Dutch, and Swedish social retirement benefits make up 84, 73, and 90 percent of disposable income, respectively. These figures compare with about 60 to 63 percent in the United States and Canada (Smeeding, 1997). According to most analyses, including those of the OECD (1998) and the World Bank (1994), these benefit levels cannot be sustained.
Two nations—the United Kingdom and Australia—face a lesser problem. As mentioned earlier, Australia has no social security system, so it faces no explicit age-driven social security deficit problem. The United
10As discussed above, earnings and income inequality in the United States is much higher than in European countries at all ages. For the American system to achieve the same retirement-age poverty rates as other countries, it would have to have replacement rates that were well in excess of 1 for a large subgroup of the elderly. These levels of replacement would raise serious questions about such a system's effect on work effort and savings.
Page 149
Kingdom has reduced its future outlays by designing a two-tier system: a low (roughly 40 percent of median income) flat-tier benefit supplemented by welfare benefits, and an upper tier that allows participants to invest their contributions in private assets, not government securities. Sweden also recently privatized a portion of its social retirement system, but it still faces high expected outlays resulting from the generosity of the current system and the cost of converting to a privately financed system.
Concepts of Wealth
One limitation of many household surveys is that they do not measure a large source of wealth—annuities paid during retirement—that is especially relevant just before and during retirement. This is an especially important issue for international comparisons given the differing extent to which countries rely on government annuities during retirement and on employer-provided pensions. For example, the two important annuities in the U.S. system are social security and private pensions. Social security is an almost universal public-sector retirement annuity wherein the benefit is tied to past earnings through a progressive formula. Employer-provided pensions typically also are related to salary, but they are far from universal and are much more common in larger private firms. For example, 53 percent of HRS respondents report that they are covered by a pension. Fortunately, HRS has made a determined effort to measure both social security and pension wealth. 11
Table 4-11 lists wealth-income ratios for the subcomponents of wealth across schooling groups in the United States. This table documents some stark contrasts in the relative progressivity of these components. Financial assets are by far the most unequally distributed component; relative to household income, financial assets are 3.3 times larger among college graduates as compared with those who did not graduate from high school. Pensions are also regressive in their distribution, reflecting the greater prevalence of employer-provided pensions among high-wage workers. In contrast, social security is quite progressive, with social security wealth-income ratios being three times larger among high school dropouts than among college graduates. The final row in Table 4-11 combines all forms of household wealth. Compared with household wealth alone, total wealth is distributed relatively uniformly across schooling groups.
The other European countries for which wealth data are available (along with Japan) have not yet developed integrated datasets that can
11The numbers reported here were derived from respondents' reports of their future expected Social Security and pension annuities. See Smith (1995) for the details of this calculation.
Page 150
|
Education of Household Head |
|||||
|
Type of Assets |
All |
No High School Diploma |
High School Diploma |
Some College |
College |
|
Financial Assets |
1.47 |
0.63 |
1.15 |
1.46 |
2.07 |
|
Household Assets |
4.84 |
3.69 |
4.18 |
5.00 |
5.74 |
|
Social Security |
2.12 |
3.28 |
2.65 |
1.96 |
1.33 |
|
Pensions |
1.85 |
1.25 |
1.74 |
1.69 |
2.26 |
|
Total Wealth |
8.81 |
8.22 |
8.57 |
8.65 |
9.33 |
NOTE: Data are from wave 1 of The Health and Retirement Survey, conducted in 1992.
SOURCE: Juster et al. (1999).
simultaneously inform us about levels of household wealth and wealth in the form of employer-provided and government-supported pensions. Such data are a high priority since they could go a long way toward reconciling cross-country differences in levels of private household wealth. For example, the fact that many of the continental European countries rely much more heavily on government-financed than employer-provided pensions may explain their relatively low levels of private wealth accumulation.
RECOMMENDATIONS
4-1. Countries should address the pressing need for longitudinal microdata comprising extensive measures of economic status that can illuminate the relationship between income and wealth on the one hand, and financial incentives to retire, various dimensions of health status, and intergenerational transfers on the other. In most countries, the requisite data on economic status pertinent to policy making simply do not exist. A number of recent surveys have demonstrated that relatively short wealth modules can capture most of the salient attributes of the household wealth distribution. Countries should build upon and extend existing survey models (such as the Health and Retirement Survey in the United States) that have been shown to provide high-quality data on wealth and savings in addition to information on interrelated realms of life.
4-2. Given the overarching need for longitudinal microdata on economic status, researchers and policy makers should pay close attention to novel and potentially revolutionary ways of collecting such data. Several recent innova
Page 151
tions in collecting household wealth and income data have been found to greatly improve the quality of such information and should be further developed. These include the use of unfolding brackets to reduce item nonresponse and produce more accurate estimates of household wealth, the integration of income and asset questions, and the use of randomly varying anchor points. One particular high-priority research question is how to use the panel nature of repeated questions on household wealth to reduce across-wave measurement error.
The fact that a vast majority of households in developed countries will soon be connected to the Internet opens up promising new means of data collection, such as those used in the Dutch CentER Savings Survey. Rather than computer-assisted person-to-person interviewing or computer-assisted telephone interviewing, one can use computers or equivalent media (e.g., set-top boxes) not only to ask questions directly, but also to present questions in novel ways and perform cross-wave checking on line.
4-3. Similarly defined microdata should be collected in different countries to exploit institutional differences and advance our understanding of the effects of policies on individual-level wealth accumulation. One issue that could be illuminated by comparative cross-national research is the extent to which public income provisions discourage or drive out private savings. To assess institutional and policy effects, it is essential that data collection efforts in different countries be well coordinated, that similar information be collected, and that procedures (e.g., sampling and quality control) be synchronized to the extent possible. Such synchronization can be achieved largely through the exchange of information among various scientific groups involved in new data collection efforts. The goal is not necessarily to have standardized instruments and identical survey design protocols in all countries. Each country has unique institutional features and policy priorities that should help shape survey implementation.
REFERENCES
, , and 1999 Household Portfolios in The Netherlands. Paper prepared for the Conference on Household Portfolios, European University Institute , Florence .
, and 1999 Wealth and Savings: Data and Trends in The Netherlands. Paper prepared for the Panel on a Research Agenda and New Data for an Aging World, Committee on Population, National Research Council .
, , and 1997 Mandatory pensions and personal savings in The Netherlands. De Economist 145: 291-324 .
, , and 1995 Saving and wealth holdings of the elderly. Ricerche Economiche 49: 293-315 .
Page 152
1999 Saving after retirement: Evidence from three different surveys. Labour Economics 6: 277-310 .
, , and 1993 An Exploratory Analysis of the Socio-Economic Panel with Regard to the Financial Position of Households . VSB Progress Report 14. The Netherlands : Tilburg University .
, , and 1998 Is there a retirement savings puzzle? American Economic Review 88: 769-788 .
, and 1999 Household Wealth in the UK: Evidence from Survey Data. Paper prepared for the Panel on a Research Agenda and New Data for an Aging World, Committee on Population, National Research Council .
1997 Booms, Busts and Babies: The Effect of Demographics on Housing and Stock Prices. Working Paper. Cambridge, MA : Massachusetts Institute of Technology .
, , and 1997 Savings and labor-market transitions. Journal of Business & Economic Statistics 15: 153-164 .
1992 Saving and consumption patterns of the elderly: The German case. Journal of Population Economics 5: 289-303 .
1999 Data and Research on Saving in Germany. Paper prepared for the Panel on a Research Agenda and New Data for an Aging World, Committee on Population, National Research Council . Available: Department of Economics, University of Mannheim, Germany .
, and 1991 Life cycle saving and consumption constraints: Theory, empirical evidence and fiscal implications. Journal of Population Economics 4: 233-255 .
1999 The Personal Distribution of Income in Post-war Italy: Source Description, Data Quality, and the Time Pattern of Income Inequality. Temi di Discussione 350. Rome : Bank of Italy .
, and 1996 Household saving: Micro theories and micro facts. Journal of Economic Literature 34: 1797-1855 .
, , and 1989 Survey estimates of wealth: An assessment of quality. In The Measurement of Saving, Investment, and Wealth , R.E. Lipsey and H.S. Tice, eds. Chicago : University of Chicago Press .
, and 1999 The distribution of wealth. In Handbook of Income Distribution , A.B. Atkinson and F. Bourguignon, eds. Amsterdam : North-Holland .
1992 Understanding Consumption . Oxford : Oxford University Press .
1974 Social security, induced retirement, and aggregate capital accumulation. Journal of Political Economy 82: 905-926 .
, and 1994 Intergenerational transfers and the accumulation of wealth. Journal of Economic Perspectives 8(4): 145-160 .
Page 153
1984 Consumption during retirement: The missing link in the life cycle. The Review of Economics and Statistics 66: 1-7 .
, , and 1997 Saving accounts versus stocks and bonds in household portfolio allocation. Scandinavian Journal of Economics 99: 81-97 .
1987 Saving of the elderly and desired bequests. American Economic Review 77: 289-312 .
1998 Mortality Risk and Consumption by Couples . Working Paper. Santa Monica, CA : RAND .
1999 Anchoring and acquiescence bias in measuring assets in household surveys. Journal of Risk and Uncertainty 19: 111-136 .
, , and 1998 Healthy, Wealthy, and Wise? Socioeconomic Status, Morbidity, and Mortality among the Elderly . Working Paper. Santa Monica, CA : RAND .
, and 1999 The Dynamics of Household Wealth Accumulation in Italy. Paper prepared for the Panel on a Research Agenda and New Data for an Aging World. Committee on Population, National Research Council .
, , and 2000 Enhancing the Quality of Data on Income: Recent Developments in Survey Methodology. Unpublished paper. University of Michigan, Department of Economics .
, , , and 1999 Savings and Wealth; Then and Now. Paper presented at the Conference on Health and Retirement, October, Amsterdam .
, and 1997 Improving the quality of economic data: Lessons from the HRS and AHEAD. Journal of the American Statistical Association 92: 1268-1278 .
, , and 1999 The measurement and structure of household wealth. Labour Economics 6: 253-276 .
, , and 1999 Explaining the Wealth Holdings of Different Cohorts: Productivity Growth and Social Security . Working Paper. The Netherlands : Tilburg University .
, and 1998 Wealth and portfolio composition: Theory and evidence. Journal of Public Economics 69: 155-193 .
, and 2000 Household Wealth in Japan. Paper prepared for the Panel on a Research Agenda and New Data for an Aging World, Committee on Population, National Research Council .
1997 Golden eggs and hyperbolic discounting. Quarterly Journal of Economics 112: 443-477 .
1997 Steueranreize und Geldanlagen im Lebenszyklus. Ph.D. dissertation, University of Mannheim , Germany .
1999 Explaining Why So Many Households Do Not Save . Working Paper. Hanover, NH : Dartmouth College .
Page 154
1998 Resources During Retirement . Working Paper AWP 4.3. Paris : Organization for Economic Co-operation and Development .
1999 Taxation and Portfolio Structure: Issues and Implications . Working Paper. Cambridge, MA : Massachusetts Institute of Technology .
2000 Stock market wealth and consumption. Journal of Economic Perspectives 14: 99-118 .
, and 1999 Taxation and Household Portfolio Composition: U.S. Evidence from the 1980s and 1990s . Working Paper. Cambridge, MA : National Bureau of Economic Research .
, and 1992 The Housing Wealth of the Aged . NBER Working Paper 4115. Cambridge, MA : National Bureau of Economic Research .
1997 Reshuffling Responsibilities in Old Age: The United States in Comparative Perspective . Luxembourg Income Study Working Paper, No. 153. Luxembourg .
1995 Racial and ethnic differences in wealth in the Health and Retirement Study. Journal of Human Resources 30(Supplement): S158-S183 .
1999a Healthy bodies and thick wallets: The dual relationship between health and economic status. Journal of Economic Perspectives 13: 145-166 .
1999b Inheritances and bequests. In Health and Wealth: Theory and Measurement , J.P. Smith and R.J. Willis, eds., pp. 121-149 . Ann Arbor : University of Michigan Press .
in press Why is wealth inequality rising? In Increasing Income Inequality in America: The Facts, Causes, and Consequences , F. Welch, ed. Chicago : University of Chicago Press .
, and 1998 The Economic Status of the Elderly on the Eve of Social Security Reform . Policy Report, November. Washington, DC : Progressive Policy Institute .
, and 1981 An economic theory of self-control. Journal of Political Economy 89: 392-406 .
, and 1989 Aging, moving and housing wealth. In The Economics of Aging , D. Wise, ed. Chicago : University of Chicago Press .
1990 But they don't want to reduce housing equity. In Issues in the Economics of Aging , D. Wise, ed. Chicago : University of Chicago Press .
1991 Aging and the income value of housing wealth. Journal of Public Economics 44: 371-395 .
, , and 1993 The English language public use file of the German Socio-Economic Panel. Journal of Human Resources 28: 429-433 .
1994 Averting the Old Age Crisis . Washington, DC : The World Bank .
1965 Uncertain lifetime, life insurance and the theory of the consumer. Review of Economic Studies 32: 137-150 .


