Appendix G
Example of Time-Scaling Calculations Appendix in A Technical Support Document
TIME-SCALING CALCULATIONS FOR DIMETHYLHYDRAZINE AEGLs
The relationship between dose and exposure time to produce a toxic effect for any given chemical is a function of the physical and chemical properties of the substance and the unique toxicologic and pharmacologic properties of the individual substance. Historically, the relationship according to Haber (1924), commonly called Haber’s law (NRC 1993) or Haber’s rule (i.e., C×t=k, where C=exposure concentration, t=exposure duration, and k=a constant) has been used to relate exposure concentration and duration to a toxic effect (Rinehart and Hatch 1964). This concept states that exposure concentration and exposure duration may be reciprocally adjusted to maintain a cumulative exposure constant (k) and that this cumulative exposure constant will always reflect a specific quantitative and qualitative response. This inverse relationship of concentration and time may be valid when the toxic response to a chemical is equally dependent upon the concentration and the exposure duration. However, an assessment by ten Berge et al. (1986) of LC50 data for certain chemicals revealed chemical-specific relationships between exposure
concentration and exposure duration that were often exponential. This relationship can be expressed by the equation Cn×t=k, where n represents a chemical-specific and even a toxic endpoint-specific exponent. The relationship described by this equation is basically the form of a linear regression analysis of the log-log transformation of a plot of C vs t. ten Berge et al. (1986) examined the airborne concentration (C) and short-term exposure duration (t) relationship relative to death for approximately 20 chemicals and found that the empirically derived value of n ranged from 0.8 to 3.5 among this group of chemicals. Hence, these workers showed that the value of the exponent (n) in the equation Cn×t=k quantitatively defines the relationship between exposure concentration and exposure duration for a given chemical and for a specific health effect endpoint. Haber’s rule is the special case where n=1. As the value of n increases, the plot of concentration vs time yields a progressive decrease in the slope of the curve.
Two data sets of LC50 values for different time periods of exposure were analyzed using a linear regression analysis of the log-log transformation of a plot of C vs t to derive values of n for dimethylhydrazine.
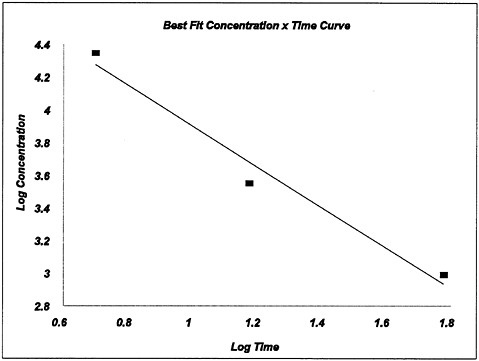
Dimethylhydrazine Dog Data from Weeks et al. 1963
The LC50 values for 5-, 15-, and 60-min exposures were 22,300, 3,580, and 981 ppm, respectively.
|
Time |
Concentration |
Log Time |
Log Concentration |
|
5 |
22,300 |
0.6990 |
4.3483 |
|
15 |
3,580 |
1.1761 |
3.5539 |
|
60 |
981 |
1.7782 |
2.9917 |
n=0.8
Calculated LC50 values:
|
Min |
Concentration |
|
30 |
2036.15 |
|
60 |
860.12 |
|
240 |
153.48 |
|
480 |
64.83 |
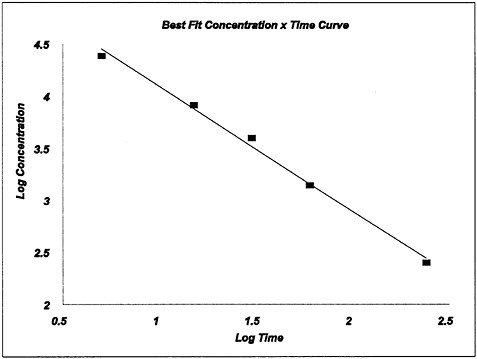
Dimethylhydrazine Rat Data from Weeks et al. 1963
The LC50 values for 5-, 15-, 30-, 60-, and 240-min exposures were 24,500, 8,230, 4,010, 1,410, and 252 ppm, respectively.
|
Time |
Concentration |
Log Time |
Log Concentration |
|
5 |
24,500 |
0.6990 |
4.3892 |
|
15 |
8,230 |
1.1761 |
3.9154 |
|
60 |
4,010 |
1.4771 |
3.6031 |
|
240 |
252 |
2.3802 |
2.4014 |
n=0.84