
6
Mitigation Compliance
There are six generic stages of the mitigation process, and these sequential actions that must be undertaken to assure that compensation wetlands (whether creation, restoration, or enhancement) will secure the expected watershed functions. First, there needs to be a concept and a general watershed location for the project. Second, that concept is translated into a set of site design plans expected to secure the target functions over time. Third, the site for a project is acquired and construction (or other modifications to the site) undertaken in accordance with the design. Fourth, inspection of the site is made to determine whether construction followed the design plan and whether design standards have been met. Fifth, physical monitoring of the site is executed for a period of time to determine whether the design is trending toward the target wetlands functions. At this point, the monitoring would determine whether performance standards are being met. Sixth, regulatory certification would concur that the site has achieved the specified performance criteria. Included at this stage are actions to ensure that the site is protected and managed in perpetuity.
If permittees or third parties are to be held responsible for the mitigation they provide, the permitting agency needs to take steps to ensure that the required mitigation actions are being taken. This might be termed the compliance challenge. The problem of defining design or performance standards and then enforcing compliance with the standards has long been recognized in the regulatory program. The committee relied on an interpretation of the extant literature to explore the practice of establish-
ing and enforcing compliance. In reviewing and synthesizing the published studies, there were several interpretative challenges. First, the studies may be dated, and their results may not reflect the rapidly changing requirements of the program described in Chapter 4. Second, some studies may not be related to the Clean Water Act's (CWA) Section 404 program but may instead evaluate nonfederal programs. The committee recognized this possibility in drawing its conclusions. Third, these studies may not indicate whether the responsible party was the permittee or a third party; however, it is suspected that most studies were for permittee-responsible mitigation, because third-party mitigation is still the exception and not the rule. Fourth, often it cannot be determined if a mitigation was on-site or off-site or whether the action taken was restoration, creation, or enhancement. The committee is therefore reluctant to draw specific conclusions about mitigation in the current Section 404 program based on these studies. However, the committee also drew on its field visits, on testimony from presenters at its meetings, and on the collective experiences of committee members. By cautiously integrating these various perspectives with the literature, compliance can be characterized.
MITIGATION PLANNING
Mitigation plan development begins with a functional assessment of the impact site and continues through the selection and development of a mitigation site leading to the replacement of the impacted site 's functional values. While this is the expected scenario, testimony provided at committee meetings indicates that, in many cases, permit files sometimes lack a mitigation plan, and at times, mitigation may not be required to replace wetland impacts. Performance standards were often unspecified or vague and not directly related to the measurement of the sites' overall performance (Zedler 1998). The committee heard testimony that in some cases mitigation plans do not specify the most basic requirements for a wetland: water source, water quality, water retention, water quantity, soil, and topography, structure (flora and fauna), and location. Absent such basic considerations, adequate performance is unlikely.
Area To Be Lost and Proposed Mitigation
Mitigation plans, when clearly written, specify the area of wetland to be lost and the measures proposed for reducing the impact of that loss. The literature suggests that mitigation plans (particularly for older projects) are not always required for each permit (Table 6–1). On a national basis there is an anticipated gain of 78% in wetland area as a result of mitigation. However, results of independent scientific reviews suggest
TABLE 6–1 Required Mitigation as Restoration, Creation, and Enhancement for Permits Issued under Permitting Programsa
|
Location |
No. of Permits |
Area Impacted (Ha) |
Years |
% of Permits Requiring Mitigation |
% of Area Impacted |
Source |
|
Alabama |
18 |
18 |
1981–87 |
100 |
100 |
Sifneos et al. 1992a |
|
Arkansas |
7 |
703 |
1982–86 |
71 |
98 |
Sifneos et al. 1992b |
|
California, Statewide |
324 |
1,176 |
1971–87 |
NA |
107 |
Holland and Kentula 1992 |
|
Orange County |
70 |
168 |
1979–93 |
13 |
97 |
Sudol 1996 |
|
Southern CA |
75 |
112 |
1987–89 |
92 |
140 |
Allen and Feddema 1996 |
|
Sacramento and San Francisco Bay |
30 |
168 |
1987–90 |
NA |
144 |
DeWeese 1994 |
|
San Francisco Bay |
36 |
NA |
1977–82 |
64 |
NA |
Race 1985 |
|
Florida, Corps |
NA |
NA |
NA |
NA |
246 |
GAO 1988, as cited in Torok et al. 1996 |
|
Jacksonville District Louisiana |
NA |
26,280 |
1981–87 |
41 |
10 |
Sifneos et al. 1992a |
|
Florida, St. John's River Water Management District |
680 |
NA |
1984–89 |
48 |
98 |
Lowe et al. 1989b |
|
New Jersey |
||||||
|
Section 404 Program |
NA |
333 |
1985–92 |
NA |
100 |
Torok et al. 1996b |
|
State FWPA |
NA |
58 |
NA |
NA |
147 |
Torok et al. 1996 |
|
Mississippi |
10 |
1,095 |
1981–87 |
50 |
100 |
Sifneos et al. 1992a |
|
Mississippi, Corps Vicksburg District |
NA |
NA |
NA |
NA |
1 |
GAO 1988, as cited in Torok et al. 1996 |
|
Ohio |
32 |
371 |
1990–95 |
68 |
93 |
Sibbing 1997c |
|
Oregon |
58 |
74 |
1977–86 |
NA |
57 |
Kentula et al. 1992a |
|
Tennessee |
50 |
34 |
1992–96 |
100 |
100 |
Morgan and Roberts 1999 |
|
Location |
No. of Permits |
Area Impacted (Ha) |
Years |
% of Permits Requiring Mitigation |
% of Area Impacted |
Source |
|
Texas |
45 |
2,995 |
1982–86 |
NA |
69 |
Sifneos et al. 1992b |
|
Washington |
35 |
61 |
1980–86 |
NA |
74 |
Kentula et al. 1992a |
|
Washington |
45 |
40 |
1992–97 |
100 |
598 |
Johnson et al. 2000 |
|
Wisconsin |
NA |
40 |
NA |
NA |
62 |
Owen and Jacobs 1992, as cited in Torok et al. 1996 |
|
National Totals |
NA |
76,500 |
1993–00 |
NA |
178 |
USACE 2000 |
|
a No field examinations were made, and functional equivalency is not assumed. b Wetland creation only; wetland enhancement may not be included. c Permits based on 25 with data and 8 not restored or created; acreage is for 32 permits and includes enhancement. NOTES: FWPA = Federal Water Pollution Act. NA = not available. |
||||||
a range of a net loss in 8 of 19 reviews with data to gains as great as 598% in one review (Johnson et al. 2000).
MITIGATION DESIGN STANDARDS
If the functions and values of jurisdictional wetland habitat are negatively affected, a net wetland loss will occur if these functions and values are not replaced. Spelling out the particular requirements for replacement in the Corps permit is the critical first step in the permitting process. A recent review (Streever 1999a; see Table 6–2, Appendix E) indicates that such requirements vary widely among Corps districts. These requirements range from physical to biological criteria, and most often include a standard related to plant dominance or abundance. Because hydrological processes determine many wetland functions, design standards often seek to grade the topography down to the groundwater source, connect the site to a local stream channel, control the water source (e.g., with tide gates or berms), or other features. Some designs require connecting the site to adjacent rivers and wetlands in the watershed. Sometimes a desired wetland type is the standard to be achieved (e.g., a sedge meadow or an emergent wetland). Many mitigation proposals state that wetland complexes will provide a desired habitat. Some plans
TABLE 6–2 Review of Corps Permits Issued Nationwide
|
Example No. |
Performance Standard |
Location |
Type |
Year |
Size, acres |
|
1 |
75% survival of planted Juncus roemerianus, 4,800 plants per acre after three growing seasons |
Alabama |
Salt marsh |
1985 |
40 |
|
2 |
Sustain 85% or greater cover by obligate and/or facultative wetland plant species; less than 10% cover by nuisance plant species; “proper hydrology condition.” |
Florida |
Forested and herbaceous freshwater |
1991 |
21.9 |
|
3 |
Hydrology must meet wetland definition of 1987 Corps wetland manual, with saturation to surface of the soil for 12.5% (31 days) of the growing season; at least 50% of woody vegetation must be facultative or wetter, with woody vegetation stem counts of 400 per acre or canopy cover of 30% or greater by woody vegetation; at least 50% of all herbaceous must be facultative or wetter with aerial cover of at least 50% in emergent wetland areas (excluding “scrub/shrub or sapling/forest vegetation”). |
Virginia |
Forested freshwater |
1995 |
27.4 |
|
4 |
Emergent and aquatic bed portions of mitigation site not to be inundated with salt or brackish water; less than 10% cover by invasive species during any monitoring event; staged vegetation requirements as follows: Year 1: 100% survival of planted stock, 50% cover in emergent areas Year 2: 80% survival by planted stock, 20% cover by native shrub species, 70% cover in emergent areas Year 3: 70% survival and 40% cover by native shrub species, 80% cover in emergent areas Year 5: 60% cover by native shrub species, 100% cover in emergent areas |
Washington |
Emergent, scrub/shrub, and forested freshwater |
1998 |
9.4 |
|
5 |
Less than 5% cover by nuisance and exotic plant species; planted and nonnuisance wetland plant species to have areal cover of 50% in the first year, 70% in second year, and 80% in third year, with provisions for remedial planting to meet percentage requirements. |
Florida |
Freshwater marsh and wet prairie |
1990 |
10 |
|
|
6 |
Must meet the regulatory definition of wetlands; specified portions of the mitigation area must meet the definitions of palustrine forested, palustrine scrub/shrub, and palustrine emergent wetland types as documented in Classifications of Wetlands and Deepwater Habitats of the United States; cover by hydrophytic vegetation; vegetation not to consist of common reed (Phragmites australis) or purple loosestrife (Lythrum salicaria); all performance standards must be met for 3 consecutive years. |
New York |
Forested, scrub/shrub and emergent palustrine wetlands |
1998 |
25 |
|
|
7 |
Areal cover in 90% of planted area equivalent to natural reference marsh; benthic invertebrates and fish with 75% similarity to natural reference marsh; upper soil horizon with 1% organic matter by dry weight. |
Alabama |
Salt marsh |
1988 |
25.3 |
|
|
8 |
Vernal Pool Habitat Suitability Index less than or equal to 0.55 with 60% of pools more than 0.7 (VPFI=a/(a+b), where a = number of species that the pool and the “vernal pool species list” share and b = number of species in the pool not on the “vernal pool species list” (the list includes those species typically found in the region's vernal pools); hydrology assessed as suitable on the basis of presence of wetlands plants. |
California |
Vernal pools |
1996 |
27 |
|
|
9 |
Hydrogeomorphic approach. |
|||||
|
SOURCE: Streever 1999a. Reprinted with permission from the National Wetlands Newsletter; copyright 1999, Environmental Law Institute, Washington, D.C. |
||||||
include percentages of facultative or obligate wetland species. Others propose levels of species diversity or abundance (see Box 6–1). The permit typically includes a map of the proposed communities with planting lists.
In some cases, performance is stated as a measure of primary productivity, such as algal and macroinvertebrate community richness, species diversity, taxonomic composition, and trophic relationships, that might reveal the system's functionality (FDER 1992; FDEP 1994, 1996). Water chemistry parameters and indexes of pollution geared to wetland condition might also be useful indicators of desired endpoints (Box 6–1).
Some permits require the addition of topsoil with seed banks. In others, the risk of introducing invasive species leads to a restriction of the use of topsoil. Although a common design requirement is to spread wetland topsoil over the site, primarily to provide plant propagules, the soil characteristics desired are rarely stated. Because characteristics of soil usually do not develop quickly (Craft et al. 1999), many restored or enhanced wetlands do not have the carbon or mychorrhizal contents of natural wetlands, and so soil characteristics may not be used as part of a performance endpoint.
Other common permit performance requirements include the percent survival of planted vegetation; percent cover of native versus weedy or exotic species; similarity of a site to a reference site; similarities to habitat
|
BOX 6–1 Performance Standards Used by the Chicago District and the Corps In the Chicago region, wetland restoration evolved along with prairie restoration efforts. In a state with about 90% loss of historical wetlands (Dahl 1990), wet prairies were among the few remnants of unplowed, unforested land. Prairie remnants were studied for their biodiversity, especially distributions of plants (Swink and Wilhelm 1994) and insects (Panzer et al. 1995). Species restricted to the least disturbed sites were considered good indicators of natural conditions. The endpoint requirements were as follows:
|
types described in other documents; or presence of certain wildlife species, particularly species with special status designations, such as species listed pursuant to the federal Endangered Species Act. Few permits specify animal populations or communities; however, habitat for selected species (e.g., waterfowl and endangered species) is sometimes specified.
PROJECT IMPLEMENTATION
Mitigation Permit with Special Conditions
Once a Section 404 mitigation plan is completed, it is provided to the Corps for review and approval. When the Section 404 permit is issued, the items prescribed in the mitigation plan are included as a special condition of the permit. These special conditions form the legal requirements of the permit. Because the permit requirements are legally binding, it is important that the permit conditions be clear, complete, and comprehensive so that the desired mitigation outcome is achieved. If the special conditions are not included in the permit or if they do not clearly describe mitigation milestones to be achieved, it is possible for regulatory certification to be obtained by the permittee even though the mitigation does not produce a mitigation site that replaces the impact area's functions and values (see Coyote Creek case study, Appendix B).
Mitigation Specified But Not Carried Out
The committee learned that in some cases specified mitigation was not initiated as required in the Corps permit. Eight studies provided information as to whether required mitigation was initiated for a mixture of programs (Table 6–3). In addition, numerous studies on mitigation required by permits revealed that as much as 34% of the mitigation was never installed (FDER 1991b; Allen and Feddema 1996; Sudol 1996; Robb 2000). In southeast Florida, Erwin's (1991) study of 40 mitigation wetland creation and restoration projects found that only about half of the required 430 hectares of wetlands had been constructed.
The committee found that compliance inspections are rarely conducted by the Corps and that this is policy. In a Memorandum for Commanders, Major Subordinate Commands, and District Commands dated April 8, 1999, Major General Russell Furman provided the Standard Operating Procedures (SOPs; Appendixes F and G) and described how the regulatory program would be executed across the United States. In addition to describing policy and program administration, the SOPs prioritized regulatory activities by the percentage of staff time devoted to them. Activities to be emphasized are described as “above the line,” and de-
TABLE 6–3 Mitigation Initiated for Permits Requiring Mitigation
|
Location |
Source |
No. of Permits Considered |
Initiated, % |
|
Orange County |
Sudol (1996) |
57 |
96 |
|
Southern California |
Allen and Feddema (1996) |
75 |
92 |
|
Florida |
Erwin (1991) |
97 |
66 |
|
Indiana |
Robb (2000) |
345 |
62 (completed)a 14 (not attempted) 20 (incomplete) |
|
Massachusetts |
Brown and Veneman (1998) |
114 |
74 |
|
New Jersey |
Torok et al. (1996) |
80 |
28 |
|
Ohio |
Fennessy and Roehrs (1997) |
14 |
100 |
|
Washington |
Johnson et al. (2000) |
45 |
93 |
|
a For 1988–1993 permits as of 1995; additional ones may be under construction in later years. |
|||
emphasized activities are described as “below the line.” The SOPs specifically note that “below-the-line” activities should be accomplished only after the “above-the-line” activities are fully executed. The SOP lists 10 activities under Permit Evaluation, plus another eight under Mitigation. Under Permit Evaluation, activity number 1, resource permit evaluation for timely decisions, is above the line. Extensive negotiation with other agencies to reach consensus (number 7) and multiple site visits and meetings of extensive preapplication (number 10) are below the line. Under Mitigation, compliance inspections for all mitigation (number 6) and multiple visits to a mitigation site (number 8) are below the line. Of the five activities under Enforcement (number 2) implement self-reporting and certification for compliance is above the line. The committee found that the cumulative effect of these policy decisions indicates that evaluating and issuing permits takes priority over careful evaluation of mitigation projects.
In addition to the SOPs, testimony provided to the committee by Corps staff from Chicago, Los Angeles, and San Francisco indicated that the workload for Corps regulatory staff is exceedingly high. Regulators from all the Corps Districts providing testimony to the committee indicated that there are consistently more Section 404 permit applications than there is time for Corps staff to perform adequate reviews. That problem, coupled with guidance provided in the SOPs, indicates that priority is given to issuing permits (which often require mitigation), yet mitigation development and follow-up inspections to determine if mitigation
commitments are being met is not a priority, and the activity is not encouraged. Indeed, the SOPs suggest that since compliance inspections and site visits fall “below the line,” these activities are not adequately performed because there is insufficient time for staff to perform the activities “above the line.” The committee believes that compliance inspections should be an “above-the-line” activity to ensure that the programmatic goal of no net loss of wetland functions and values is met.
If the Corps recognized mitigation compliance and increased compliance as a priority activity, mitigation would more likely be carried out as specified in Section 404 permits. The committee recognizes that increasing compliance efforts would result in increased staff workloads requiring additional regulatory staff.
COMPLINCE WITH PERMIT CONDITIONS
The literature shows that many mitigation sites are not performing as specified in Corps permits (Allen and Feddema 1996; Sudol 1996; FDER 1991b; Race 1985). These same studies also show that where mitigation is performing as specified, many of those sites do not support functions and values equivalent to similar reference sites. In some cases, the standard to be met by an individual compensatory mitigation project may stop with a requirement to secure some wetlands structure or to design the project in a particular way. In this case, the premise is that restoring hydrology will facilitate the development of other wetland functions. However, permits do not always call for hydrological measurement.
If mitigation is not carried out to the level specified in the permit, then the Corps can take enforcement action and require a permittee to perform the agreed-upon mitigation. However, if the permit does not specify mitigation, or if the permit is not clear as to the level of mitigation that must be performed or what parameters must be met for the mitigation to be considered complete, it becomes difficult for the Corps to determine if the project is in compliance. Mason and Slocum (1987), for example, found that compliance rates were twice as high when the permits contained specific conditions compared with those that had no specific conditions. For this reason, it is important that Section 404 permits specifying mitigation contain specific language about the expected mitigation outcome (mitigation goal).
The mitigation goal statement should be followed by specific objectives that consist of specific statements about the intended mitigation outcome (Streever 1999b). Performance standards are then developed from the mitigation goal statement and objectives. When these performance standards are included in the Section 404 permit as special conditions, they become legally binding upon the permittee.
Design Standards and Detailed Performance Standards
With detailed assessment of the impacted sites and/or reference systems selected as targets, the committee could set detailed performance standards. But neither data set is typically available. Thus, projects are designed without adequate knowledge, and performance criteria are general and few in number (Streever 1999b). Ecologists, hydrologists, and other scientists who study mitigation sites find many shortcomings in comparing mitigation sites with reference systems (see Chapter 2). Thus, it seems that regulators need to agree that either (1) design standards constitute reasonable performance criteria, or (2) detailed assessment of functions lost must be matched by detailed assessment of mitigation site performance and penalties developed for failure to achieve performance standards.
A consistent set of procedures to identify wetlands is required in order to permit wetland filling under the guidelines of the CWA. The Corps created preliminary guides to regional wetlands and developed techniques for identifying wetlands (USACE 1978a,b,c,d; Reppert 1979; USACE 1987; NRC 1995). The resulting schemes were based on a triad of wetland characteristics: hydrological conditions, soil characteristics, and plant communities. Lists of wetland plant species and hydric soils were created for all parts of the country (USDA 1982, 1985, 1987, 1991). Hydrological requirements were codified (such as number of days of flooding and depth to groundwater) and, to some extent, adapted to various regions. Hydrological data were not available for many wetland sites; therefore, procedures were developed for estimating hydrological conditions from soils and other features (NRC 1995). More detail on the history of the federal wetland manuals and current and past practices in wetland delineation is presented in NRC (1995).
Basic to all wetland restoration and creation projects is the need to set goals for each site's hydrological conditions. Hydrology is most often cited as the primary driving force influencing wetland development, structure, function, and persistence (Gosselink and Turner 1978; Carter 1986; LaBaugh 1986; Day et al. 1988; Novitzki 1989; Wilcox 1988; Gosselink et al. 1990; Sharitz et al. 1990; FDER 1991a; Reaves and Croteau-Hartman 1994; Bedford 1996, 1999; Morgan and Roberts 1999). Consequently, establishment of the appropriate hydrology is fundamental to wetland mitigation whether through restoration or creation (NRC 1992, 1995; Brinson 1993; Bedford 1996; Mitsch and Wilson 1996; Shaffer et al. 1999; Cole and Brooks 2000b). In a survey of 175 federal, state, private, and environmental professionals working in wetland restoration, hydrology was considered one of the most difficult structural features of a wetland to establish and the most important component of a project (Holman and Childres 1995).
One measure of mitigation compliance is the restoration of jurisdictional hydrology. An explicit hydrological standard is the percentage of the growing season that soils need to be saturated. Clark and Benforado (1981) suggested that areas saturated less than 5% of the growing season clearly exhibited upland hydrological characteristics and that areas saturated more than 12.5% clearly exhibited wetland hydrological characteristics. The 1987 Corps wetland delineation established the 5% criterion as the jurisdictional threshold, a quantitative value that was reaffirmed by the NRC (1995). However, there are major differences in depth to water table between a wetland that satisfies the 5% standard and one that meets the 12.5% standard (see Figure 6–1). These differences in wetness lead to very different ecological communities (Scherrer et al. 2001).
Because the permittees responsible for the mitigation need some time frame that clearly defines the length of their mitigation responsibility, hydrological performance standards may be based on 5 years or less of water-table monitoring. However, the hydrological regime in nonriverine, intermittently saturated freshwater wetlands varies not only seasonally but also year to year (see Figure 6–2). During a short monitoring period,
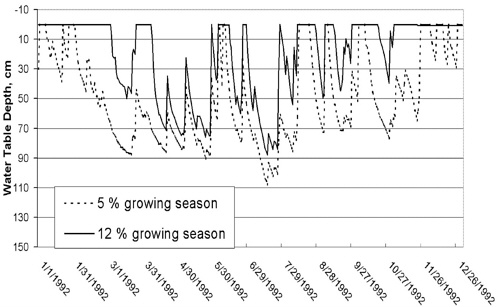
FIGURE 6–1 Water-table position and duration of root zone saturation for wetland site that satisfies the jurisdictional hydrology criteria (5% of growing season) as compared with wetland site that satisfies the criteria (12% of the growing season). Simulation modeling (DRAINMOD) was used to determine values. SOURCE: Skaggs (1978). Reprinted with permission; copyright 1978, Water Resources Research Institute of the University of North Carolina, Raleigh.
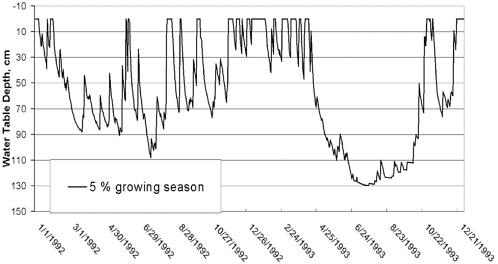
FIGURE 6–2 Year-to-year variations in water-table depth and duration of root zone saturation for a wetland site that satisfies jurisdictional hydrology criteria at least 5% of the growing season. Year-to-year extremes are typical for intermittently saturated wetlands. Values determined from simulation modeling using DRAINMOD. SOURCE: Skaggs (1978). Reprinted with permission; copyright 1978, Water Resources Research Institute of the University of North Carolina, Raleigh.
water levels might not meet hydrological standards for several consecutive years, even though the wetland could satisfy criteria over the long term. Depending on the date when the 5-year monitoring period began and ended, there could be six 5-year periods where the wetland did not satisfy hydrological criteria (see Figure 6–3). If this were a mitigation site and the 5-year monitoring period occurred during one of these six periods, the mitigation project would not comply with performance standards. Recognizing this potential shortcoming, practitioners tend to err toward the wet end of the range, creating wetlands that are much wetter than normal for the given landscape position (Cole and Brooks 2000b).
In many cases this approach has resulted in the creation of openwater areas as compensation for loss of intermittently inundated or saturated wetlands (Kentula et al. 1992a). The stable-water pond has come to typify mitigation efforts in many parts of the country (Cole and Brooks 2000b). Mitigation projects that stress the wet end of the range will not replace the functions provided by much drier impact sites. For example, use of a mitigation site as a stormwater storage, attenuation, or treatment wetland may compromise biodiversity goals.
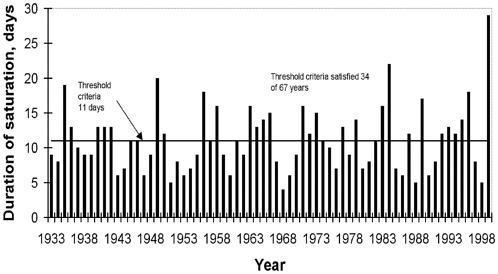
FIGURE 6–3 Year-to-year variation of the longest period that wetland hydrological criteria satisfied. Results obtained from long-term simulation modeling using DRAINMOD. NOTE: There are several 5-year periods where criteria are not satisfied 3 out of 5 years. SOURCE: Skaggs (1978). Reprinted with permission; copyright 1978, Water Resources Research Institute of the University of North Carolina, Raleigh.
Breaux and Serefiddin (1999) examined 110 compensatory wetland mitigation projects in California (permitted from 1988 to 1995) and determined that the most commonly measured parameter was vegetation (type or cover) (Table 6–4). Two of the most commonly assumed wetland val-
TABLE 6–4 Parameters Measured in 110 Compensatory Wetland Mitigation Projects in California from 1988 to 1995
|
Parameter |
% of Sites Measured |
|
Vegetation |
72 |
|
Hydrology |
22 |
|
Wildlife |
38 |
|
Water quality |
7 |
|
Soils |
3 |
|
Invertebrates |
3 |
|
Flood storage |
Not mentioned |
|
SOURCE: Adapted from Breaux and Serefiddin (1999). |
|
ues, flood storage and water-quality improvements, were supposed to be examined in less than 10% of the permits.
The committee concludes that current permitting procedures do not always result in permit conditions that are clear and enforceable and lead to the development of viable mitigation that compensates for the functions and values of the permitted impact. Instead, permits typically contain performance standards that measure only one or several easily measured parameters of a mitigation site, and in many cases, these parameters do not reflect the overall viability of the mitigation site. Recommendations relevant to this conclusion are provided in Chapter 8.
MITIGATION RATIOS
Mitigation ratios are the proportional requirements for replacing wetlands that are permitted for fill. A point that is frequently raised in assessments of mitigation is that the ratios (the number of required mitigation acres to the permitted acres) are too low (Morgan and Roberts 1999; Allen and Feddema 1996). Ratios vary across permits, often because the logic behind the ratios differs. Higher ratios might be required for sites and wetland types that are difficult to restore. Higher ratios might be also used if there is a long time expected between the permitted activity and the achievement of the desired endpoint for the compensation site. Ratios have been used to reflect the functional values of the impact site, that is, the ratio would be higher for a pristine wetland than for a severely degraded wetland. An example of ratio guidelines used by the California Department of Fish and Game incorporates this principle in its guidelines for mitigating impacts to streams and associated habitat (see Appendix D). Mitigation ratios are 1:1 for low-value habitat (e.g., unvegetated streams), whereas ratios can be as high as 5:1 for impacts to endangered species habitat (e.g., mature willow riparian inhabited by least Bell's vireo).
The Corps and the Environmental Protection Agency (EPA) mitigation Memorandum of Agreement (MOA) states that “mitigation should provide, at a minimum, one-for-one functional replacement (i.e., no net loss of values), with an adequate margin of safety to reflect the expected degree of success associated with the mitigation plan… [T]his ratio may be greater where the functional values of the area being impacted are demonstrably high and the replacement wetlands are of lower functional value or the likelihood of success of the mitigation project is low. Conversely, the ratio may be less than 1 to 1 for areas where the functional values associated with the area being impacted are demonstrably low and the likelihood of success associated with the mitigation proposal is high.”
Whether required ratios were met was examined in nine studies for four nonfederal (not Section 404) programs (see Table 6–5). The mitigation ratio requirements were never fully met, but the ratio for the mitigation implemented was higher than 1:1 in three of the nine studies. These results present another way of examining the compliance rate of mitigation when viewed on a programmatic scale. The average percentage was 69%, implying that for these nine mitigation efforts, a 1.5:1 ratio of mitigation:loss acreage would be needed to equal the area lost (if all other permit conditions are met, including functional equivalency). The committee concludes that some mitigation will not be fully implemented. The reasons that mitigation projects do not meet expectations are partially dependent on performance and design criteria, program oversight, and execution. These are discussed in the next sections.
In all programs surveyed by Allen and Feddema (1996) in Southern California, the area mitigated was about equal to the area lost due to permitting. That was accomplished by varying the amount of mitigation required by habitat type so that different replacement risks were built into the permit requirement (see Table 6–6). The committee heard testimony to the effect that pressure to mitigate for one rare wetland type with a high mitigation ratio resulted in a more common wetland type with a lower ratio. In effect, the regulatory program may reassemble the landscape with a different habitat mix than the wetlands being lost.
TABLE 6–5 Mitigation Ratios Required and the Actual Ratios Met, Based on Post-Construction Evaluation (assumes complete compliance in meeting permit conditions)
TABLE 6–6 Mitigation Ratios (Area Basis) and Achievement Rates (%) for Different Wetland Types in Southern California
|
Wetland Type |
Required Ratio |
Actual Ratio |
Rate |
|
Riparian habitat |
1.39:1 |
0.97:1 |
70 |
|
Freshwater |
0.9:1 |
0.61:1 |
67 |
|
Saltwater |
2.1:1 |
2.1:1 |
100 |
|
Unidentified riparian |
1.59:1 |
0.40:1 |
67 |
|
Riparian woodland |
2.40:1 |
1.6:1 |
67 |
|
Total |
1.39:1 |
1.096:1 |
69 |
|
SOURCE: Adapted from Allen and Feddema (1996). |
|||
Mitigation ratios are considered further in Chapter 8 under the topic of Permit Conditions. The adjustment of ratios is one of the principal tools for addressing risk and temporal loss with the ultimate goal of achieving permit compliance.
MONITORING OF MITIGATION PROJECTS
Once a Section 404 permit is issued by the Corps and the agreed-upon mitigation and corresponding performance standards are outlined in the permit special conditions, it is the responsibility of the permittee to conduct ongoing monitoring of the site to ensure that the performance standards are being achieved. The Corps should review the monitoring reports submitted by the permittee and conduct periodic inspections of the site to ensure compliance with the permit.
Table 6–7 lists results of seven reports on the monitoring frequency for six states. The highest monitoring rate was for a California study in which 324 sites had at least one monitoring site visit; two-thirds of these 324 sites had no second site visit required. One study (Louisiana) reported that monitoring occurred on only 10% of the sites. Six of seven studies reported a monitoring rate of about 50% or less. This result has important implications for the success of a mitigation program. Several studies have shown that permit compliance rate may be quite low when monitoring is sparse or does not occur. Mason and Slocum (1987) evaluated 32 wetlands in Virginia and, at the time of their analysis, documented that permits with specific conditions for creating wetlands were 86% compliant, whereas when there were no specific permit conditions, then permit compliance was 44%. When time limits for completion were specified, 100% of the mitigation efforts were compliant, compared with
TABLE 6–7 Frequency of Monitoring for Permits That Required Mitigation
|
State |
Source |
No. of Permits |
No Monitoring at: |
|
Alabama |
Sifneos et al. (1992a) |
18 |
61% were not monitored |
|
California |
Holland and Kentula (1992) |
324 |
40% had incomplete acreage; 2% had no completion date; two-thirds did not require follow-up |
|
Louisiana |
Sifneos et al. (1992a) |
93 |
90% were not monitored |
|
Mississippi |
Sifneos et al. (1992a) |
5 |
80% were not monitored |
|
Oregon |
Storm and Stellini (1994) |
58 |
53% had no site visit recorded |
|
Washington |
Storm and Stellini (1994) |
17 |
67%; monitoring was done at three of the nine sites requiring monitoring |
|
Washington |
Kentula (1986) |
35 |
49% had no site visit |
50% without deadlines or time limits. Morgan and Roberts (1999) concluded that “some applicants apparently believe that they will not be held accountable for their projects.” Morgan and Roberts (1999) implied that this self-interest in reporting data to agencies might have an influence on the accuracy of the evaluation and made a plea that “we strongly recommend that consultants responsible for site development not be allowed to submit the monitoring reports for their own projects. ” Zentner (1988) found that the “lack of monitoring was a common element of unsuccessful projects. ”
In addition, the permit may sparsely quantify the necessary requirements. Lowe et al. (1989) estimated that 86% of the 29 permits he surveyed “did not contain enough details or were not clear enough to ensure success of the created wetland, nor were they drawn tightly enough to enable the District to enforce the terms to correct problems. Two of the most often noted deficiencies in the permit conditions were the absence of success and maintenance criteria and the lack of provisions for corrective action should the created wetland fail. ” DeWeese (1994) noted that the omission of monitoring reports meant that the need for remedial action went unnoticed and therefore was not done or was not done as well. These sentiments were shared by Race and Fonseca (1996):
[O]ur survey of past mitigation projects nationwide indicates that the success rate of permit-linked mitigation projects remains low overall. In addition, there is continuing difficulty in translating mitigation concepts into legal principles, regulatory standards, and permit conditions that
are scientifically defensible and sound. Based on the record of past poor performance, we assert that continued piecemeal revision efforts focused on technical or scientific details are not likely to make compensatory mitigation more effective. There is need to acknowledge the extent to which non-scientific, real-world complications plague current policies and practices. To prevent continued loss of wetlands under compensatory mitigation, decisive action must be taken by placing emphasis on improving compliance, generating desired acreage, and maintaining a true baseline.
Based on design requirements, Morgan and Roberts (1999) found that 72% of the mitigation sites inspected were smaller than required. Morgan and Roberts (1999) also found that many sites were not constructed to topographic specifications, resulting in sites that could not attain appropriate hydrological requirements to create the intended results.
Accordingly, the Corps/EPA Mitigation MOA (USACE/EPA 1990) recognizes that “[m]onitoring is an important aspect of mitigation, especially in areas of scientific uncertainty. Monitoring should be directed toward determining whether permit conditions are complied with and whether the purpose intended to be served by the conditions are actually achieved.” Thus, a mitigation site must be physically monitored to determine compliance with design standards as well as compliance with performance standards (whether the site exhibits a trend toward achieving the target wetland functions).
MONITORING DURATION
The literature and testimony provided to the committee indicate that monitoring periods commonly last between 3 and 5 years following mitigation site construction. However, for many created and restored systems, particularly those such as woody riparian systems that require long periods of time for plant establishment, a short-duration monitoring (3–5 years) might not be long enough to determine whether mitigation goals will be acheived (see Coyote Creek case study, Appendix B). The mitigation guidelines from the St. Paul District (Eggers 1992) recommend monitoring beyond 5 years if necessary. For forested wetlands, Morgan and Roberts (1999) recommend revising the monitoring period to a time frame that better reflects the time needed to achieve the desired outcomes.
A 5-year monitoring window is a common permit requirement. For example, Tennessee, like most states, requires that most mitigation projects be monitored annually for 5 years (Morgan and Roberts 1999). This requirement is especially true of tree-dominated mitigation sites that may take 50 years or more to mature (Morgan and Roberts 1999).
Obviously, the specific needs and performance requirements of a particular mitigation site will influence monitoring frequency and duration.
THE COMPLIANCE RECORD
In the mid-1980s, some scientists involved in wetland restoration and creation believed that mitigation was effective (Harvey and Josselyn 1986). Others emphasized a need for more research, enforcement, and monitoring (Kusler and Groman 1986; Race 1986). Since then, follow-up studies of compensatory restoration and creation projects have identified significant shortcomings with respect to the functioning of mitigation sites (see Chapter 2). Shortcomings are evident in every region of the country. The discussion focuses on plant communities, because that is what is most commonly monitored. The committee notes, however, that while vegetation may be easily measured, it is a poor indicator of function (Reinartz and Warne 1993).
One of the most comprehensive investigations involved a review of 61 permits for 128 projects in six counties around Chicago, Illinois (Gallihugh and Rogner 1998). That study found that 17% of the wetland vegetation proposed was established, and an additional 22% had established wetlands but with vegetation other than that proposed. Fifty-two percent of the wetlands had excessive or unplanned open water, and 9% had insufficient hydrology. The wetland area lost was 117 hectares (ha) and the approved wetland mitigation amounted to 144 ha. So, in theory, there was a mitigation ratio of 1.2:1, resulting in a net gain of 27 ha. In actuality, the study found that 29 ha were not established and at least 99 ha were found to have unsatisfactory hydrology (too wet or too dry).
In a smaller sampling, Wilson and Mitsch (1996) evaluated five wetland projects in detail to estimate their ecological and legal outcomes (legal compliance was determined by the authors in consultation with the regulators). Only two of the five mitigation cases showed the mitigation projects were in full legal compliance, but four of the five were on a trajectory toward legal compliance with permit requirements (Table 6–8). Overall, 24.4 ha of wetlands were lost, and about 16 ha were actually created or restored. Because of the failure of one large site, only 38% of the desired wetland area was established at the time of their study. For the four wetlands that were compliant, there was an overall mitigation ratio of 1.4:1.
Evaluations of ecological equivalency between mitigation sites and reference sites are rarely conducted as part of a programmatic review. Kentula et al. (1992b) found that 65% of the permits that they surveyed in Oregon and Washington required a functional assessment, but these assessments lacked detail. A salt marsh creation project in southern Califor-
TABLE 6–8 Permit Requirements and Compliance for Five Replacement Wetlands Investigated in Ohio
|
Wetland Area, hectares |
|||||||
|
Location, County Replaced |
Wetland Type Lost |
Required |
Implemented |
Lost |
Required |
Area Implemented |
% of Required |
|
Portage |
Emergent |
Emergent/ woody |
Emergent/ woody |
0.4 |
0.6 |
0.6 |
100 |
|
Delaware |
Emergent/ woody |
Emergent/ woody |
Emergent/ woody |
3.7 |
5.4 |
~4.0 |
74 |
|
Franklin |
Emergent |
Emergent/ submergent |
Emergent/ submergent |
15 |
28 |
32 |
11 |
|
Jackson |
Emergent |
Emergent/ scrub-shrub |
Emergent/ scrub-shrub |
4.8 |
7.2 |
7.5 |
105 |
|
Gallia |
Emergent |
Emergent/ woody |
Emergent |
0.5 |
0.8 |
0.7 |
88 |
|
Total |
24.4 |
42 |
~16.0 |
38 |
|||
|
SOURCE: Data from Wilson and Mitsch (1996). |
|||||||
nia was evaluated using several indicators of function, and the results show the importance of measuring more than vegetation to characterize ecological performance (Table 6–9). Four constructed salt marshes were studied for 5 years or longer, and 11 attributes were compared with nearby natural sites. Three attributes of plant health (biomass, height, and nitrogen content) varied from 42% to 84% equivalency, two benthic invertebrate parameters varied from 36% to 78% equivalency, and four soil parameters (organic content, sediment nitrogen, pore water nitrogen, and nitrogen fixation) varied from 17% to 110% of that in the reference marsh. A high score for one parameter does not guarantee a high score for another. A recent compilation of the 10-year data set indicated that this project did not comply with permit conditions, which included tall vegetation suitable for nesting by an endangered bird (Zedler and Callaway 1999).
A systematic approach to measuring ecological equivalency involves the application of Brinson's (1993) Hydrogeomorphic Method (HGM), which is broadly applicable to most wetlands. Sudol (1996) used the HGM method to assess 40 mitigation projects covering 97 hectares of impacts for 104 hectares of proposed mitigation in Orange County, California.
TABLE 6–9 Index of Functional Equivalency for Four Constructed Salt Marshes in Relationship to Natural Sites in Paradise Creek, Southern California
Fifteen habitat functions were compared in 7 reference sites. Forty-two percent of the compensatory mitigation wetland area met the terms of the permit requirements. However, not one mitigation effort was completely successful in terms of the HGM analyses. Fourteen mitigation efforts were partially successful. The overarching reason given to explain the lack of success was that there was insufficient restoration and creation of the necessary hydrological conditions.
Brown and Veneman (1998) examined 70 mitigation permits in Massachusetts and made field visits to 68 permittee-responsible sites that underwent restoration and also to a subset of sites that apparently were mitigation banks. Various environmental parameters were measured in both mitigation wetland and an appropriate reference site, although full information on how the comparison was made is not available (discussed in Chapter 2). Some of their results are in Table 6–10. The compensatory wetland had fewer species among all sites, but the mitigation bank sites had more species than the reference sites. Although plant cover and other indices of plant community health were similar in reference and mitigation wetland, the species were not the same. The differences in plant species may explain why the use by amphibians, mammals, and birds (but not reptiles) was higher in the reference sites.
TABLE 6–10 Ecological Parameters in Paired Replacement and Reference Wetlands in Massachusetts
Estimates of functional equivalency and compliance rates from various studies are summarized in Table 6–11. The percentage of permits meeting permit compliance ranges from 3% to 100%, and the percentage of permits resulting in various measures of ecological functionality (equivalency) ranges from 0 to 67%. For studies with estimates of both permit compliance and ecological equivalency, the averages are 55% and 23%, respectively. The average for all eight estimates for ecological equivalency is 14%. Some of these sites may improve with time (see discussion of trajectories in Chapter 2).
Eighteen studies used the number of restoration or creation sites that met permit conditions as an indicator of permit compliance (see Table 6–12). Ten of the 18 studies had compliance rates of greater than 50%. Sudol (1996) surveyed 70 (required as part of 80 permits) mitigation sites in Orange County, California, to determine permit compliance for permits issued between 1985 and 1993. There were 128 ha of impact, of which 19 ha met all conditions of mitigation. Of the 80 permits, 30 projects were considered compliant with permit conditions. Of the remaining projects,
TABLE 6–11 Comparison of the Percentage of Permits Meeting Their Requirements and Percentage of Those Permits Meeting Various Tests of Ecological Functionality or Viability
|
Location |
No. of Permits |
% Permit Compliance |
% Meeting Viability/ Functiona |
Source or Notes |
|
California |
57 |
18 |
0 |
Sudol (1996) |
|
Florida |
29 |
79 |
45 |
Lowe et al. (1989) |
|
Florida |
63 |
6 |
27 |
FDER (1991a) |
|
Freshwater |
34 |
3 |
12 |
|
|
Saltwater |
29 |
10 |
45 |
|
|
Florida |
N.A. |
N.A. |
4 |
Erwin (1991) |
|
Florida, St. Johns |
N.A. (1992) |
43 |
27 |
OPPAGA (2000) |
|
Water Management District (WMD) |
N.A. (1999) |
78 |
67 |
OPPAGA (2000) |
|
Ohio |
10 |
100 |
0 |
Fennessy and Roehrs (1997) |
|
Oregon |
17 |
47 |
18 |
Storm and Stellini (1994) |
|
Unknown |
29 |
21 |
3 |
Mockler et al. (1998) |
|
a Criteria used: Sudol (1996) classified sites as a complete success and not irrigated; Lowe et al. (1989) classified site viability as good or poor; DeWeese (1994) rated sites as successful if they scored 7 or higher on a scale of 0 to 10; FDER (1991a) rated sites based on hydrology, soils, vegetation, and fauna. NOTES: N.A., Not available. |
||||
TABLE 6–12 Compliance (Based on Permit Number) for Fully Implemented Mitigation Plans
|
Location |
No. of Permits |
% in Compliancea |
Source |
|
California |
|||
|
Orange County |
57 |
13 |
Sudol (1996) |
|
Southern Sacramento |
75 |
42 |
Allen and Feddema (1996) |
|
San Francisco |
30 |
50 |
DeWeese (1994) |
|
Florida |
29 |
79 |
Lowe et al. (1989) |
|
Florida |
42 |
10 |
Erwin (1991) |
|
Florida (Northeastern) |
201 |
86 |
Miracle et al. (1998)b |
|
Florida |
|||
|
Southwestern WMD |
33 |
33 |
OPPAGA (2000), for 1988 to 1989 |
|
Southwestern WMD |
254 |
82 |
OPPAGA (2000), for permits since 1995c |
|
St. Johns WMD |
N.A. |
78 |
OPPAGA (2000), for 1999 |
|
Suwannee River WMD |
N.A. |
100 |
OPPAGA (2000) |
|
Florida Department of Environmental Protection |
|||
|
Southeastern District |
N.A. |
67 |
OPPAGA (2000), no date |
|
Northeastern District |
N.A. |
87 |
OPPAGA (2000), no date |
|
Illinois |
N.A. |
4 |
Gallihugh and Rogner (1998) |
|
Massachusetts Department of Environmental Protection |
84 |
49 |
Brown and Veneman (1998) |
|
Ohio |
14 |
100 |
Fennessy and Roehrs (1997) |
|
Ohio |
5 |
80 |
Wilson and Mitsch (1996) |
|
Virginia |
32 |
N.A. |
Mason and Slocum (1987) |
|
1.a |
N.A. |
86 |
When with specific permit conditions |
|
b |
N.A. |
44 |
When without specific permit conditions |
|
2.a |
N.A. |
100 |
Permits with time limits |
|
b |
N.A. |
50 |
Permits without time limits |
|
Washington |
17 |
53 |
Storm and Stellini (1994) |
|
Washington |
43 |
35 |
Johnson et al. (2000) |
|
Unknown |
29 |
21 |
Mockler et al. (1998) |
|
a Compliance based on 100% compliance for Allen and Feddema (1996); scale of 8 out of 10 (75% in compliance) for DeWeese (1994). b After 5 years; some mitigation was still in the monitoring stage (and compliant). c Includes mitigation efforts that achieved success and that were “trending toward” success, as defined by the evaluators. NOTES: Based on field inspection or monitoring reports and when all permit conditions were met. Unverified mitigation attempts were considered noncompliant. N.A., Not available. |
|||
6 were not compliant, 2 were never attempted, and 13 permits were never completed. The remaining projects were only partially successful in meeting the permit requirements. Eight studies of five state permitting programs examined whether attempts at mitigation met permit conditions (see Table 6–13). Compliance with the permit was measured by the area of created or restored wetlands. The results indicate that the compensatory wetland mitigation area was often less than the permitted area.
Mitigation sites have also been evaluated using more subjective measures. DeWeese (1994) evaluated 30 projects in California to determine mitigation compliance using a 10-point scale based on professional judgment. About half of the sites were at least 5 years old. DeWeese ranked only 1 of the 30 sites high, 13 were average or above average, and 6 were below average (Table 6–14). Two sites had low value, and two others were judged to have no value. The average value was 4.7 for 30 mitigation projects. There was no net loss in area as a result of permitting, but there was a net loss in ecological functionality.
Allen and Feddema (1996) examined 75 sites in California using three simple criteria evaluated subjectively: weed invasion, plant cover, and vegetation status. They found a 69% “success rate” and estimated that 77 ha replaced 81 ha lost, for a net loss of 5%. Storm and Stellini (1994) found a mixed result in their review of 17 compensatory mitigation projects in Washington (Table 6–15). Fifty-three percent could not be verified as being in compliance with the permit, 29% were verified as being out of compliance, and two-thirds were not ecologically equivalent to the wetlands lost through the permitting program. Monitoring was done for only
TABLE 6–13 Compliance (Area Basis) for Mitigation That Was Attempted Based on Field Inspection or Monitoring Reports
|
Location |
No. of Permits |
Impacted Hectares |
% Area Gain (loss) |
Source |
|
California |
||||
|
Orange County |
68 |
128 |
(92) |
Sudol (1996) |
|
San Diego County |
N.A. |
102 |
(8) |
Fenner (1991) |
|
Southern Sacramento |
75 |
80 |
(8) |
Allen and Feddema (1996) |
|
San Francisco |
30 |
168 |
44 |
DeWeese (1994) |
|
Florida |
29 |
269 |
(32) |
Lowe et al. (1989) |
|
Indiana |
31 |
14 |
10 |
J.T.Robb (personal commun. 2000) |
|
Ohio |
5 |
24 |
(33) |
Wilson and Mitsch (1996) |
|
Tennessee |
50 |
38 |
(13) |
Morgan and Roberts (1999) |
TABLE 6–14 Ranking of Compliance for 30 Sites in San Francisco Bay That Were Issued Section 404 Permits
|
Permits (No.) |
Compliance (%) |
|
3 |
100 |
|
6 |
85 to 95 |
|
6 |
75 to 85 |
|
12 |
45 to 75 |
|
1 |
1 to 14 |
|
2 |
0 |
|
NOTE: DeWeese (1994) ranked sites (scale 1 to 10) to determine their ecological success rate. |
|
one-third of that required. These subjective measures of equivalency suggest that compliance is much lower than expected.
The historical and national perspective of mitigation in the United States that has been presented comes from a wide range of studies, and we do not think that our review is a parochial or geographically restricted one. A summary of key data reviews is in Table 6–16. Between 70% and 76% of the mitigation required in the permits is implemented, and about 50% to 53% of the implemented mitigation projects did not meet the permit requirements. In addition, the estimate of functional equivalency of mitigation wetland was about 20% of that intended. These estimates (based on the mean or median value in the tables) suggest that there is a substantial net loss in wetland area from wetlands permitting program. In terms of the ecological equivalency of these wetlands, there is a low value of the wetlands actually built.
TABLE 6–15 Results from an Analysis of Compliance for 17 Mitigation Projects with Field Investigation in Western Washington
|
Condition |
Number |
Percent |
|
Not verified as being in compliance |
9 |
53 |
|
Out of compliance |
5 |
29 |
|
Not functioning ecologically |
11 |
65 |
|
In compliance with regulatory requirements |
3 |
18 |
|
Monitoring done/required |
9/17 |
53 |
|
Monitoring done when required |
3 |
33 |
|
SOURCE: Storm and Stellini (1994). |
||
TABLE 6–16 Summary of Data from Previous Tables on Wetland Permit Implementation, Compliance, Ecological Success, and Monitoring Frequency
|
Parameter |
No. of Studies |
No. of States |
Range |
Mean |
Median |
|
1. % Mitigation attempted for required mitigation permits (778+ permits; Table 6–3) |
8 |
7 |
28 to 100 |
76 |
70 |
|
2. % Compliance for mitigation required, based on field inspections |
|||||
|
a. % area gain (loss) (Table 6–13) |
8 |
5 |
(92) to 44 |
(17) |
(32.5) |
|
b. % permits issued (Table 6–12) |
19 |
6 |
0 to 100 |
58 |
53 |
|
3. % Ratio required and ratios met (post-construction; Table 6–5) |
9 |
4 |
17 to 90 |
61 |
62 |
|
4. % Functional equivalency of completed mitigation (Table 6–11) |
9 |
4 |
0 to 67 |
21 |
18 |
|
5. % Sites insufficiently monitored for permitted mitigation (Table 6–7) |
7 |
6 |
40 to 90 |
63 |
61 |
|
NOTE: The average of a tie for the median value is given. |
|||||
Record Keeping
The committee found that in many cases, mitigation was required to offset impacts; however, some project files did not contain a mitigation plan or other explicit agreements on the size and type of mitigation to be provided. Because mitigation projects extend over many years, mitigation plans need to be on record, with mitigation requirements clarified, so that all subsequent parties involved in the evaluation of the mitigation site know exactly what was required.
Many of the problems of tracking wetland loss and gain resulting from mitigation implementation could be addressed by improved recordkeeping on the part of the Corps. Through improved compliance inspections described in Chapter 8, information should be included in a national database, such as the Corps Regulatory Analysis and Management System (RAMS) database. If each Corps project manager followed data-entry quality-assurance measures, then wetland losses and gains could be tracked more accurately on a national scale.
CONCLUSIONS
-
It appears that the performance standards sought in compensatory mitigation have not often been well defined.
-
Wetland restoration and creation trajectories do not suggest equivalency with reference sites within the commonly used 5-year monitoring period.
-
The literature and testimony provided to the committee indicate that the national goal of “no net loss” for permitted wetland conversions is not being met.
-
The gap between what is required and what is realized is not precisely known; however, the evidence strongly suggests that the required compensatory mitigation called for by wetland permits to date will not be realized.
-
Permit follow-up is sparse or too infrequent, and a higher post-monitoring rate will increase permit compliance rates. Compliance monitoring is commonly known to be nonexistent after 5 years. Better documentation and monitoring will increase compliance rates.
-
The sparse compliance monitoring is a direct consequence of its designation as a “below-the-line” policy standard. Raising compliance monitoring to “above the line” will greatly enhance mitigation success. Chapter 8 further discusses mitigation compliance issues; specifically, recommendations 4 and 6 in that chapter addresses concerns outlined here.
RECOMMENDATIONS
The committee makes the following recommendations relative to future mitigation compliance to ensure that the nation has an accurate reporting of wetland losses and gains:
-
The wetland area and functions lost and regained over time should be tracked in a national database. This database may or may not be the Corps Regulatory Analysis and Management System (RAMS) database.
-
The Corps should expand and improve the quality-assurance measures for data entry in the RAMS database.
-
Mitigation goals must be clear and those goals carefully specified in terms of measurable performance standards in order to improve mitigation effectiveness. Performance standards in permits should reflect mitigation goals and be written in such a way that ecological viability can be measured and the impacted functions replaced.


