
2
Evidence of Abrupt Climate Change
Researchers first became intrigued by abrupt climate change when they discovered striking evidence of large, abrupt, and widespread changes preserved in paleoclimatic archives. Interpretation of such proxy records of climate—for example, using tree rings to judge occurrence of droughts or gas bubbles in ice cores to study the atmosphere at the time the bubbles were trapped—is a well-established science that has grown much in recent years. This chapter summarizes techniques for studying paleoclimate and highlights research results. The chapter concludes with examples of modern climate change and techniques for observing it. Modern climate records include abrupt changes that are smaller and briefer than in paleoclimate records but show that abrupt climate change is not restricted to the distant past.
INTERPRETATION OF PAST CLIMATIC CONDITIONS FROM PROXY RECORDS
Paleoclimatic interpretation relies ultimately on the use of the present or recent instrumental records as the key to the past. To accomplish this, modern values observed for a given characteristic of the climate system are compared with some record from the past, such as tree-ring thickness or the isotopic composition of water frozen in ice cores (see Plates 1 and 2). Detailed understanding of these records—how the thickness of tree rings
changes in recent wet and dry periods—lets scientists draw inferences about the past, and these records come to be considered “proxies,” or indicators of the past environment.
The assumption of constancy of the relation between climate and its proxy might require little more to support it than constancy of physical law (for example, the assumption that in the past heat flowed from warm to cold rocks in the same way as today). Other assumptions might involve greater uncertainty (for example, the assumption that under different climatic conditions, marine organisms grew most vigorously during the same season and at the same water depth as in the modern environment). Testing of the underlying assumption that the present is the key to the past relies largely on the consistency of results from a wide array of proxies, particularly those depending on few assumptions. The use of multiple indicators increases the reliability of many paleoclimate reconstructions.
The following pages provide a brief synopsis of paleoclimate proxies (Table 2.1) and age indicators. The description is not exhaustive and is intended only to orient the reader to some of the current paleoclimatic tools available. For more detailed reviews of methods involved in paleoclimatic interpretation see Broecker (1995), Bradley (1999), or Cronin (1999).
Physical paleoclimatic indicators often rely on the fewest assumptions and so can be interpreted most directly. For example, old air extracted from bubbles in ice cores and old water from pore spaces in seabed sediments or continental rocks provide direct indications of past compositions of atmosphere, oceans, and groundwater (see Plate 1). Anomalously cold buried rocks or ice have not finished warming from the ice age and thus provide evidence that conditions were colder in the past. Conditions are also judged from the concentrations of noble gases found dissolved in old groundwaters. Some such records are subject to substantial loss of information through diffusion of the components being analyzed, which limits the ability to interpret older events. Physical indicators include the characteristics of sediments and land features. For example, the presence of sand dunes can indicate past arid conditions, and glacially polished bedrock is an indication of prior glacial conditions.
Isotopic indicators are widely used in paleoclimate science. The subtle differences in behavior between chemically similar atoms having different weights (isotopes) prove to be sensitive indicators of paleoenvironmental conditions. One common application is paleothermometry. The physical and chemical discrimination of atoms of differing isotopic mass increases with decreasing temperature. For example, carbonate shells grow-
TABLE 2.1 Paeloclimatic Proxies
|
Paleoclimatic Recorder |
Climate Variable Recorded |
Property Measured |
|
Ice |
Atmospheric composition |
Trapped bubbles |
|
|
Windiness |
Dust grain sizes |
|
|
Source strength of wind-blown materials |
Abundance of pollen, dust, sea salt |
|
|
Temperature |
Ice isotopic ratios Borehole temperatures Gas isotopes Melt layers |
|
|
Snow accumulation rate |
Thickness of annual layers In-situ radiocarbon |
|
Ocean sediments and corals |
Temperature |
Species assemblages Shell geochemistry Alkenone (U37K' ) thermometry |
|
|
Salinity |
Shell isotopes after correction for temperature and ice volume |
|
|
Ice volume |
Isotopic composition of pore waters Shell isotopes after correction for temperature and salinity |
|
|
pH Ocean circulation |
Boron isotopes in shells Cd/Ca in shells Carbon-isotopic data |
|
|
Corrosiveness/chemistry of ambient waters |
Shell dissolution |
|
Lake and bog sediments |
Temperature |
Species assemblages Shell geochemistry |
|
|
Atmospheric temperature and soil moisture |
Washed- or blown-in materials including pollen and spores Macrofossils such as leaves, needles, beetles, midge flies, etc. |
|
|
Water balance (precipitation minus evaporation |
Species assemblages Shell geochemistry |
|
Tree rings |
Temperature and/or moisture availability |
Ring width or density of trees stressed by cold or drought |
|
|
Variations in the isotopic ratio of water related to temperature |
Cellulose isotopic ratios |
|
Speleothems/cave formations |
Moisture availability |
Growth rate of formations |
|
Isotopic ratios of water related to temperature or precipitation rate |
Oxygen isotopic composition |
|
|
|
Overlying vegetation |
Carbon-isotopic composition |
ing in water typically favor isotopically heavy oxygen and become isotopically heavier at lower temperatures. Isotopic ratios also are used to estimate the concentration of a chemical. When a chemical is common in the environment, a “favored” isotope will be used; shortage of a chemical leads to greater use of a less favored isotope. Marine photosynthesis increasingly favors the light isotope of carbon as carbon dioxide becomes more abundant, and this allows estimation of changes in carbon dioxide concentration from the isotopic composition of organic matter in oceanic sediments. Similarly, the growth of ice sheets removes isotopically light water (ordinary water) from the ocean, increasing the use of isotopically heavy oxygen from water in carbonate shells, which then provide information on the size of ice sheets over time. Stable isotopic values in organic matter also provide important information on photosynthetic pathways and so can afford insight into the photosynthesizing organisms that were dominant at a given location in the past.
Many chemical proxies of environmental change act like isotopic ratios in the measurement of availability of a species. For example, if decreased rainfall increases the concentration of magnesium or strontium ions in lake water, they will become more common in calcium-carbonate shells that grow in that water. However, warming can also allow increased incorporation of substitute ions in shells. Such nonuniqueness can usually be resolved through use of multiple indicators. Other chemical indicators are allied to biological processes. For example, some species of marine diatoms incorporate stiffer molecules in their cell walls to offset the softening effects of higher temperature, and these molecules are resistant to changes after the diatoms die. The fraction of stiffer molecules in sediments yields an estimate of past temperatures. This analytic technique, known as alkenone paleothermometry, is increasingly used to learn about paleotemperatures in the marine environment.
Biological indicators of environmental conditions typically involve the presence or absence of indicator species or assemblages of species. For example, the existence of an old rooted tree stump shows that the climate was warm and wet enough for trees, and the type of wood indicates how warm and wet the climate was; if that tree stump is in a region where trees do not grow today, the climate change is clear. In ocean and lake sediments, the microfossil species present can indicate the temperature, salinity, and nutrient concentration of the water column when they were deposited. Pollen and macrofossils preserved in sediments are important records of variability in the terrestrial environment (see Plate 3). The presence of specific organic compounds called biomarkers in sediments can reveal what species were present, how abundant they were, and other information.
The complicated nature of paleoclimatic interpretation can be seen when proxies are viewed in a practical example. During ice ages, the oceans were colder, but the water in them was also isotopically heavier because light water was removed and used in growing ice sheets. Shells that grew in water during ice age intervals contain heavier isotopes owing to cooling and changes in the isotopic composition of ocean waters. The change in ocean isotopic composition can be estimated independently from the composition of pore waters in sediments, whereas the change in temperature can be estimated from both the abundance of cold- or warm-loving shells in sediment and the abundance of stiff diatom cell-wall molecules in sediments. Concentrations of non-carbonate ions substituted into calcium carbonate shells provide further information. Because there is redundancy in the available data, reliable results can be obtained.
Any paleoclimatic record requires age estimates, and many techniques are used to obtain them. Annual layers in trees, in sediments of some lakes and shallow marine basins, in corals, and in some ice cores allow high-resolution dating for tens of thousands of years, or longer in exceptional cases. Various radiometric techniques are also used. Dates for the last 50,000 years are most commonly obtained by using radiocarbon (14C). Changes in production of radiocarbon by cosmic rays have occurred over time, but their effects are now calibrated by using annual-layer counts or other radiometric techniques, such as the use of radioactive intermediates generated during the decay of uranium and thorium and also through the potassium-argon system. Other techniques rely on measurement of accumulated damage to mineral grains, rocks, or chemicals; this permits dating on the basis of cosmogenic exposure ages, thermoluminescence, obsidian hydration, fission tracks, amino-acid racemization, and so on. Numerous techniques allow correlation of samples and assignment of ages from well-dated to initially less well-dated records. Such techniques include the identification of chemically “fingerprinted” fallout from particular volcanic eruptions, of changes in the composition of atmospheric gases trapped in ice cores, and of changes in cosmogenic isotope production or rock magnetization linked to changes in the earth’s magnetic field.
THE YOUNGER DRYAS AS AN EXAMPLE OF ABRUPT CLIMATE CHANGE
Sedimentary records reveal numerous large, widespread abrupt climate changes over the last 100,000 years and beyond. The best known of them is the Younger Dryas cold interval. The Younger Dryas was a nearly global event that began about 12,800 years ago when there was an interruption in the gradual warming trend that followed the last ice age. The Younger Dryas event ended abruptly about 11,600 years ago (Figures 2.1 and 2.2). Because the Younger Dryas can be tracked quite clearly in geologic records and has received extensive study, a rather detailed summary of the evidence is given here, followed by briefer reviews of other abrupt climate changes. We then target Holocene1 abrupt climate events as examples of substantial changes that have taken place when physical conditions on the earth were more similar to today. Understanding the causes of both types of abrupt
climate change is essential for assessing the importance of their role in our climate future.
Ice Core Evidence of the Younger Dryas
The Younger Dryas cold reversal is especially prominent in ice-core records from Greenland, but it is also observed in ice cores from other locations. The ice-core records provide a unique perspective that demonstrates the synchronous nature of the large, widespread changes observed.
Annual-layer counting in Greenland ice cores allows determination of the age, duration, and rapidity of change of the Younger Dryas event with dating errors of about one percent (Alley et al., 1993; Meese et al., 1997). Annual-layer thicknesses corrected for the effects of ice flow give the history of snow accumulation rate in Greenland (Alley et al., 1993). Concentrations of wind-blown materials—such as dust (which in central Greenland has characteristics showing its origin in central Asia [Biscaye et al., 1997]) and sea salt—reveal changes in atmospheric concentrations of these particles (Mayewski et al., 1997) after correction for variations in dilution caused by changing snow accumulation rate (Alley et al., 1995a). Gases trapped in bubbles reveal past atmospheric composition. Methane is of special interest because it probably records the global area of wetlands. Furthermore, differences between methane concentrations observed in Greenland ice cores and those from Antarctica allow inference of changes in the wetland areas in the tropics and high latitudes (Chappellaz et al., 1997; Brook et al., 1999).
The combination of the isotopic record of water making up the Greenland ice (see Plate 2; Figure 1.2) (Johnsen et al., 1997; Grootes and Stuiver, 1997) and the physical temperature of the ice (Cuffey et al., 1994, 1995; Johnsen et al., 1995) yields estimates of past temperatures in central Greenland, which can be checked by using two additional thermometers based on the thermal fractionation of gas isotopes after abrupt temperature changes (Severinghaus et al., 1998). Ice-core records from Greenland thus provide high-resolution reconstructions of local environmental conditions in Greenland (temperature and snow accumulation rate), conditions well beyond Greenland (wind-blown materials including sea salt and Asian dust), and even some global conditions (wetland area inferred from methane), all on a common time scale (Figures 2.1, 2.2, and 2.3).
A review of available Greenland ice-core data is given by Alley (2000). The data were collected by two international teams of investigators from multiple laboratories. The duplication shows the high reliability of the
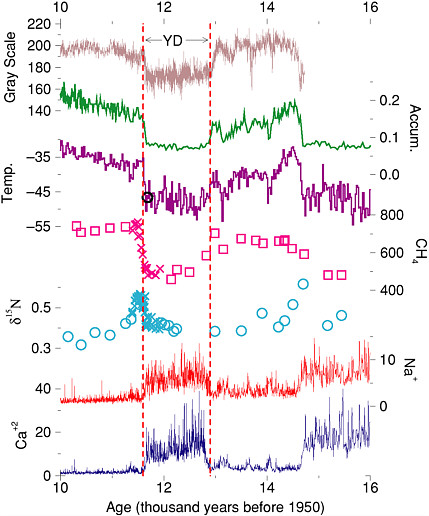
FIGURE 2.1 The Younger Dryas (YD) climate event, as recorded in an ice core from central Greenland and a sediment core from offshore Venezuela. The upper-most curve is the gray-scale (light or dark appearance) of the Cariaco Basin core, and probably records changes in windiness and rainfall (Hughen et al., 1998). The other curves are from the GISP2, Greenland ice core. The rate of snow accumulation and the temperature in central Greenland were calculated by Cuffey and Clow (1997), using the layer-thickness data from Alley et al. (1993) and the ice-isotopic ratios from Grootes and Stuiver (1997), respectively. The independent Severinghaus et al. (1998) temperature estimate is shown by the circle near the end of the Younger Dryas. Methane data are from Brook et al. (1996) (squares) and Severinghaus et al. (1998) (x), and probably record changes in global wetland area. Changes in the d15N values as measured by Severinghaus et al. (1998) record the temperature difference between the surface of the Greenland ice sheet and the depth at which bubbles were trapped; abrupt warmings caused the short-lived spikes in this value near the end of the Younger Dryas and near 14.7 thousand years. Highs in sea-salt sodium indicate windy conditions from beyond Greenland, and even larger changes in calcium from continental dust indicate windy and dry or low-vegetation conditions in the Asian source regions (Mayewski et al., 1997; Biscaye et al., 1997). Calcium and sodium concentrations measured in the ice have been converted to concentrations in the air over Greenland, and are displayed by dividing by the estimated average atmospheric concentrations over Greenland in the millennium before the Little Ice Age, following Alley et al. (1997). Most of the ice-core data, and many related data sets, are available on The Greenland Summit Ice Cores CD-ROM, 1997, National Snow and Ice Data Center, University of Colorado at Boulder, and the World Data Center-A for Paleoclimatology, National Geophysical Data Center, Boulder, Colorado, www.ngdc.noaa.gov/paleo/icecore/greenland/summit/index.html. Figure is modified from Alley (2000).
data from the cores over the most recent 110,000 years, and the multiparameter analyses give an exceptionally clear view of the climate system. Briefly, the data indicate that cooling into the Younger Dryas occurred in a few prominent decade(s)-long steps, whereas warming at the end of it occurred primarily in one especially large step (Figure 1.2) of about 8°C in about 10 years and was accompanied by a doubling of snow accumulation in 3 years; most of the accumulation-rate change occurred in 1 year. (This matches well the change in wind-driven upwelling in the Cariaco Basin, offshore Venezuela, which occurred in 10 years or less [Hughen et al., 1996].)
Ice core evidence also shows that wind-blown materials were more abundant in the atmosphere over Greenland by a factor of 3 (sea-salt, submicrometer dust) to 7 (dust measuring several micrometers) in the Younger Dryas atmosphere than after the event (Alley et al., 1995b; Mayewski et al., 1997) (Figure 2.1). Taylor et al. (1997) found that most of the change in most indicators occurred in one step over about 5 years at the end of the Younger Dryas, although additional steps of similar length but much smaller magnitude preceded and followed the main step, spanning a total of about 50 years. Variability in at least some indicators was enhanced near this and other transitions in the ice cores (Taylor et al., 1993), complicating identification of when transitions occurred and emphasizing the need for improved statistical and analytical tools in dealing with abrupt climate change. Beginning immediately after the main warming in Greenland (by less than or equal to 30 years), methane rose by 50 percent over about a century; this increase included tropical and high-latitude sources (Chappellaz et al., 1997; Severinghaus et al., 1998; Brook et al., 1999).
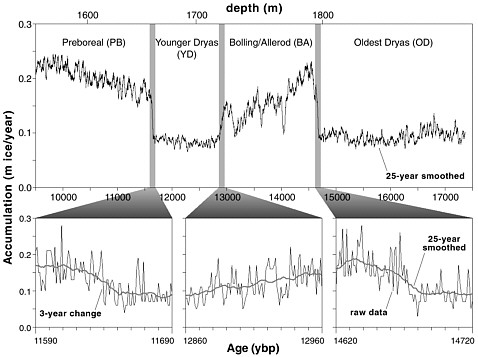
FIGURE 2.2 The accumulation rate of ice in Greenland was low during the Younger Dryas, and both the start and end of the period show as abrupt changes. Modified from Alley et al. (1993).
Ice cores from other sites, including Baffin Island, Canada (Fisher et al., 1995), Huascaran, Peru (Thompson et al., 1995), and Sajama, Bolivia (Thompson et al., 1998), show evidence of a late-glacial reversal that is probably the Younger Dryas, although the age control for these cores is not as accurate as for cores from the large ice sheets. The Byrd Station, Antarctica, ice core and possibly other southern cores (Bender et al., 1994; Blunier and Brook, 2001) indicate a broadly antiphased behavior between the high southern latitudes and much of the rest of the world, with southern warmth during the Younger Dryas interval (see Plate 2). The record from Taylor Dome, Antarctica, a near-coastal site, appears to show a slight cooling during the Younger Dryas, although details of the synchronization with other ice cores remain under discussion (Steig et al., 1998). The Southern Hemisphere records are not comparable with those from central Greenland in time resolution; further coring is planned.
The ice-core records demonstrate that much of the earth was affected simultaneously by the Younger Dryas, typically with cold, dry, windy con-
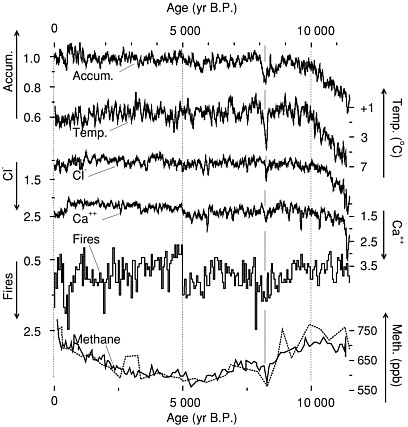
FIGURE 2.3 Climate data from the GISP2 core, central Greenland, showing changes about 8,200 years ago probably caused by outburst flooding from around the melting ice sheet in Hudson Bay (Barber et al., 1999) and affecting widespread regions of the globe. The event punctuated generally warm conditions not too different from recently, so warmth is not a guarantee of climate stability. Accumulation and temperature reflect conditions in Greenland, chloride is wind-blown sea-salt from beyond Greenland, and calcium is continental dust probably from Asia (Biscaye et al., 1997). Forest-fire smoke likely is from North America, and methane probably records global wetland area. Data are shown as approximately 50-year running means. Accumulation from Alley et al. (1993) and Spinelli (1996), chloride and calcium from O’Brien et al. (1995), and fire data shown as a 50-year histogram of frequency of fallout from fires (Taylor et al., 1996), expressed as ratios to their average values during the approximately 2,000 years just prior to the Little Ice Age. Temperature is calculated as a deviation from the average over the same 2,000 years, from oxygen-isotopic data of ice (Stuiver et al., 1995), assuming a calibration of 0.33 per mil per degree C (Cuffey et al., 1995). Methane concentrations from the GISP2 core (heavier line; Brook et al., 1996) and the GRIP core (Blunier et al., 1995) are shown in parts per billion by volume (ppb). Note that some scales increase upward and others downward, as indicated, so that all curves vary together at the major events. Modified from Alley et al. (1997).
ditions. However, those records do not provide much spatial detail, nor do they sample the whole earth. For those, one must consider a global array of data sources of various types, as described in the following subsections.
Terrestrial Pollen Evidence of the Younger Dryas
The Younger Dryas was first discovered by studying the biological records found in terrestrial sediments. These records clearly reveal the global reach of the event. Owing to dating uncertainties, including those associated with the conversion of radiocarbon measurements to calendar years, the phasing of events between different locations is not known exactly. The ice cores show that much of the world must have changed nearly simultaneously to yield the observed changes in methane, Asian dust, and Greenland conditions, but we cannot say with confidence whether all events were simultaneous or some were sequential. A summary of much of the relevant terrestrial pollen information follows, organized by region.
Europe
As the Northern Hemisphere was recovering from the last ice age about 15,000 years ago, the climate warmed dramatically and trees started to colonize the landscape. Evidence of the warming was first found in Scandinavia by geologists who noticed tree fossils in organic sediment. They named the warming interval the Allerød for the locale where it was first observed. Overlying the Allerød layer were leaves and fruits of Dryas octopetala, an arctic-alpine herb, in sandy or silty (minerogenic) layers above the peaty tree remains; this suggested that the climate had reverted several times to very cold conditions. Two such reversals to frigid conditions were named the Older and Younger Dryas (Jansen, 1938). Considerable evidence of this sequence in hundreds of pollen diagrams throughout Europe (Iversen, l954; Watts, l980) brought attention to the strongest effects of the event, which occurred in coastal Europe. During the Younger Dryas, pollen of tundra plants, such as Artemisia (wormwood) and Chenopodiaceae, abruptly replaced birch and even conifer pollen (e.g., Lowe et al., 1995; Walker, 1995; Renssen and Isarin, 1998; Birks and Ammann, 2000). In Norway, mean July temperature was about 7-9°C lower than today and about 2-4°C lower than the preceding warm Allerød interval (Birks and Ammann, 2000). It is now apparent that regional climate changes were also large in southern Europe (Lowe and Watson, l993; Beaulieu et
al., l994). For example, mean July temperatures in northern Spain might have been as much as 8°C lower than today (Beaulieu et al., l994).
North America
For many years, the Younger Dryas was thought to be a solely European event (Mercer, l969; Davis et al., 1983). It was the high-resolution reexamination of pollen stratigraphy, the identification of plant macrofossils, and the new technique of accelerator mass spectrometry 14C dating of these macrofossils that enabled documentation of the event in the southern New England region of the United States (Peteet et al., l990, 1993) and in the eastern maritime provinces of Canada (Mott, 1994; Mayle et al., l993). The climate signal in southern New England was a 3-4°C July cooling; in eastern Canada, a cooling of 6-7°C is estimated (from pollen). Midge fly fossils in lake sediments from the White Mountains of New Hampshire indicate about 5°C Younger Dryas cooling of maximum summertime lake temperatures, a somewhat smaller change than suggested for a coastal transect from Maine to New Brunswick (Cwynar and Spear, 2001). In the central Appalachians, a warm, wet interval coincident with the Younger Dryas event suggests a sharp climatic gradient that might have forced the northward movement of storm-track moisture (Kneller and Peteet, l999). Later North American studies have identified the Younger Dryas event in other regions, such as the US Midwest (Shane and Anderson, l993), coastal British Columbia (Mathewes, l993) and coastal Alaska (Peteet and Mann, l994). The documentation of the Younger Dryas event over much of North America demonstrated that it was not limited to the circum-Atlantic region (Peteet et al., l997).
Central America and the Caribbean
Marine evidence of the Younger Dryas event is recorded as an interval of increased upwelling or decreased riverine runoff from adjacent South American land in a core from the Cariaco Basin in the Caribbean (Hughen et al., 1996, 2000a,b; Peterson et al., 2000) (Figure 2.4). Terrestrial evidence is primarily from three sites (Leyden, 1995). Evidence indicates a temperature decline of 1.5-2.5°C during deglaciation, probably correlated with the Younger Dryas, registered at high and low elevations about 13,100-12,300 years ago as far south as Costa Rica, and just before 12,000 years ago in Guatemala (Hooghiemstra et al., l992; Leyden et al., l994). The
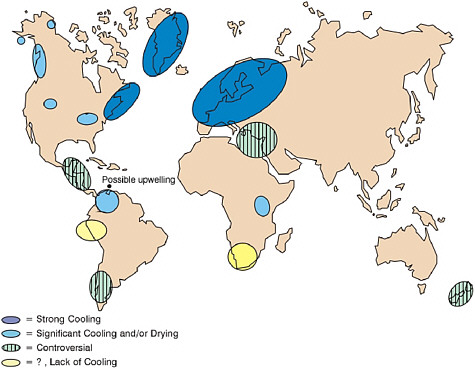
FIGURE 2.4 Global extent of terrestrial (pollen) and ice core (isotopic) evidence where the Younger Dryas cooling (11,500 – 13,000 BP) has been found. While northern hemispheric evidence is consistently strong for cooling, southern hemispheric sites contain controversial evidence and in some cases lack of evidence for a cooling during the YD interval. Possible upwelling in the Cariaco Basin during this time is also indicated, attributed to trade wind increase. Strong cooling ranges from 13-4° C; controversial means some sites show cooling and some do not (after Peteet, 1995).
decrease was not observed on the western Panamanian slope (Piperno et al., l990; Bush et al., l992).
South America
In Colombia, the El Abra stadial (a Younger Dryas equivalent) was a cold interval about 13,000-11,700 years ago characterized by low temperature and low precipitation (van der Hammen and Hooghiemstra, 1995). The upper forest line during the stadial was 600-800 m lower than today, and average temperatures were about 4-6°C lower than today. This evi-
dence comes from about 14 areas, mostly at high elevations (2000-4000 m) in the Eastern and Central Cordillera and in the Sierra Nevada de Santa Marta; some data were collected from the tropical lowlands.
Late-glacial records from Ecuador do not exhibit evidence of a climatic reversal (Hansen and Sutera, l995). Several sites in Peru give indications of a late-glacial climatic reversal although sediments from Laguna Junin indicate that the cooling occurred between 14,000-13,000 years ago, before what is normally observed for the Younger Dryas event (Hansen and Sutera, 1995). Further radiocarbon dating accompanied by high-resolution sampling is necessary. As noted above, ice cores from Peru and Bolivia show a strong late-glacial reversal (Thompson et al., 1995, 1998) that is probably correlative with the Younger Dryas, but dating is not yet unequivocal.
For several decades, southern South America has been a controversial region with respect to a possible Younger Dryas signal (Heusser, 1990; Markgraf, l991; Denton et al., 1999). Two recent studies continue the debate from different regions of southern Chile. A study in the Lake District (Moreno et al., 2001) describes three sites at which conditions approached modern climate by about 15,000 years ago followed by cooling in two steps and then by warming around 11,200 years ago in a pattern similar to that in Europe and Greenland. The rough synchronism between Northern and Southern Hemispheres argues for a common forcing or rapid transmission of a climate signal between hemispheres. In contrast, a study farther south of four lakes shows no Younger Dryas signal (Bennett et al., 2000).
New Zealand
Late-glacial pollen evidence from New Zealand shows no substantial reversal of the trend toward warmer conditions after deglaciation (McGlone et al., 1997; Singer et al., 1998). However, a later study (Newnham and Lowe, 2000) found an interval of cooling that began about 600 years before the Younger Dryas and lasted for about a millennium; also, as noted below, one New Zealand glacier advanced near the start of the Younger Dryas interval (Denton and Hendy, 1994; cf. Denton et al., 1999).
Africa
Data from Central Africa suggest that arid conditions characterized the Younger Dryas in both highlands and lowlands (Bonnefille et al., 1995). The research focused on a high-resolution record from Burundi and com-
pared data from 25 additional sites with limited sampling resolution and 14C dating. Similarly, evidence of dry conditions during the Younger Dryas is summarized by Gasse (2000) for equatorial regions, subequatorial West Africa, and the Sahel. In South Africa, however, no strong terrestrial evidence of changes in temperature or moisture during the Younger Dryas was observed (Scott et al., 1995).
Glacial-Geological Evidence of the Younger Dryas
Glaciers are highly responsive to rapid climate change. Notable Younger Dryas advances of Norwegian and Finnish outlet glaciers and those in the Scottish mountains have been documented (Mangerud, 1991; Sissons, 1967). In the Americas, potential glacial evidence of the Younger Dryas event was observed near the Crowfoot glacier in Canada (Osborne et al., 1995; Lowell, 2000), the Titcomb Lakes moraine in the Wind River range in Wyoming (Gosse et al., 1995), and the Reschreiter glacier in Ecuador. More recent research suggests that the Younger Dryas in Peru was marked by retreating ice fronts, probably driven by a reduction in precipitation (Rodbell and Seltzer, 2000). In New Zealand, the Franz Joseph glacier began advancing early in the Younger Dryas (Denton and Hendy, 1994).
Marine Evidence of Younger Dryas Oscillation
The first evidence of Younger Dryas cooling in marine sediment cores was the observation of a return to increased abundance of the polar planktonic foraminiferal species Neogloboquadrina pachyderma in the North Atlantic (Ruddiman and McIntyre, 1981). This change suggested that reduction in formation of North Atlantic deep water was responsible for the Younger Dryas cooling observed on land (Oeschger et al., 1984; Broecker et al., 1985; Boyle and Keigwin, 1987). Later work documented North Atlantic ice-rafting events that correlate with rapid climate oscillations in Greenland, not only during the glacial period but also throughout the Holocene (Bond and Lotti, 1995). Deep-water corals from Orphan Knoll in the North Atlantic show large changes in intermediate-water circulation during the Younger Dryas (Smith et al., 1997). Cadmium:calcium ratios in shells from the North Atlantic subtropical gyre indicate increased nutrient concentrations during the Younger Dryas and the glacial period, and suggest millennial-scale oscillations affecting climate (Marchitto et al., l998). Sediment color and other data from the Cariaco Basin in the Caribbean
indicate enhanced nutrient upwelling and thus higher productivity caused by increased trade wind strength during the Younger Dryas (Hughen et al., 1996), or decreased riverine runoff from adjacent land masses (Peterson et al., 2000).
In the last decade, substantial paleooceanographic oscillations correlated with the Younger Dryas have been documented from as far away as the North Pacific. In the Santa Barbara Basin (Kennett and Ingram, 1995) and the Gulf of California (Keigwin and Jones, 1990), sediments that are normally anoxic became oxic during the Younger Dryas. Evidence of rapid climate variability in the northwestern Pacific over the last 95,000 years has been observed (Kotilainen and Shackleton, 1995). Even the eastern equatorial Pacific has yielded a Younger Dryas event determined from δ18O and δ13C records (Koutavas and Lynch-Steiglitz, 1999).
In the North Arabian Sea and Indian Ocean, high-frequency climate variability linked to events in the Northern Hemisphere has also been demonstrated (Schulz et al., 1998). Off the coast of Africa at Ocean Drilling Program Site 658, an arid period corresponding to the Younger Dryas punctuated a longer humid period (deMenocal et al., 2000a). Between 20°N and 20°S, Younger Dryas cooling is observed on the basis of alkenone paleothermometry (Bard et al., 1997). In a sediment record that links land to ocean, Maslin and Burns (2000) documented evidence of a dry Younger Dryas in the tropical Atlantic Amazon Fan. As reviewed by Boyle (2000), work including that by Boyle and Keigwin (1987) and Bond et al. (1997) showed that changes in proxies from bottom-dwelling foraminiferal shells indicate reduction in deep export of waters that sank in the North Atlantic during the Younger Dryas. Alley and Clark (1999) reviewed evidence from several marine cores that show warmth during the Younger Dyras in the southern Atlantic and Indian Oceans, opposite to most global anomalies but consistent with the warmth indicated in most Antarctic ice cores at that time (Steig et al., 1998; Bender et al., 1999; Blunier and Brook, 2001).
Overall, the available data indicate that the Younger Dryas was a strong event with a global footprint. Available data are not sufficient to identify the climate anomaly everywhere, and further understanding almost certainly will require more data. Different paleoclimatic recorders respond to different aspects of the climate system with different time resolution, so it is not surprising that the picture is not perfectly clear. Broadly, however, the Younger Dryas was a cold, dry, and windy time in much of the world although with locally wetter regions probably linked to storm-track shifts. The far southern Atlantic and many regions downwind in the southern
Indian Ocean and Antarctica were warm during the Younger Dryas. Changes probably were largest around the North Atlantic and probably included reduced export of North Atlantic deep water. Changes into and especially out of the event were very rapid.
ABRUPT CLIMATE CHANGES BEFORE THE YOUNGER DRYAS EVENT
The 110,000-year-long ice-core records from central Greenland (Johnsen et al., 1997; Grootes and Stuiver, 1997) confirmed that the Younger Dryas was one in a long string of large, abrupt, widespread climate changes (Figure 2.5). To a first approximation, the Younger Dryas pattern of change (size, rate, extent) occurred more than 24 times during that interval; additional evidence from marine sediments indicates similar changes over longer times in earlier ice-age cycles (McManus et al., 1998).
Such climate oscillations have a characteristic form consisting of gradual cooling followed by more abrupt cooling, a cold interval, and finally an abrupt warming. Events were most commonly spaced about 1,500 years apart, although spacing of 3,000 or 4,500 years is also observed (Mayewski et al., 1997; Yiou et al., 1997; Alley et al., 2001). The name Dansgaard/ Oeschger oscillation is often applied to such changes on the basis of early work by Dansgaard et al. (1984) and Oeschger et al. (1984). The terminology can be inconsistent; the warm times associated with these during the ice age originally were termed Dansgaard/Oeschger events, but evidence of cyclic behavior suggests that oscillation is more appropriate.
The sequence of Dansgaard/Oeschger oscillations is observed in various records, such as the histories of surface-water temperatures near Bermuda (which were cold when Greenland was cold) (Sachs and Lehman, 1999); oxygenation patterns of the bottom waters in the Santa Barbara basin (which were oxygenated when Greenland was cold) (Behl and Kennett, 1996); wind-blown dust supply to the Arabian Sea (which was dusty when Greenland was cold) (Schulz et al., 1998); and temperature records from the Byrd ice core, West Antarctica (which was warm when Greenland was cold) (Blunier and Brook, 2001). Methane decreased with almost all the Greenland coolings and rose with the warmings, although it changed more slowly than temperature (Chappellaz et al., 1997; Brook et al, 1999; Dällenbach et al., 2000). The colder phases of Dansgaard/Oeschger oscillations in the North Atlantic were marked by increased ice rafting of debris into colder, fresher surface water and by reduction in the strength of
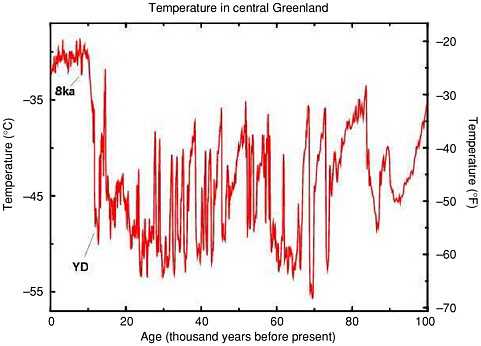
FIGURE 2.5 History of temperature in central Greenland over the last 100,000 years, as calculated by Cuffey and Clow (1997) from the data of Grootes and Stuiver (1997). The large Younger Dryas temperature oscillation (labeled YD), and the smaller temperature change of the event about 8,200 years ago (labeled 8ka) are just the most recent in a long sequence of such abrupt temperature jumps. Changes in materials from beyond Greenland trapped in the ice cores, including dust and methane, demonstrate that just as for the YD and 8ka events, the earlier events affected large areas of the earth nearly simultaneously.
North Atlantic deep water formation (e.g., Lehman and Keigwin, 1992; Oppo and Lehman, 1995; Bond et al., 1993; Bond and Lotti, 1995). The geographic pattern of climate anomalies associated with the cold phases of the Dansgaard/Oeschger oscillations is thus quite similar to that of the Younger Dryas event.
The millennial Dansgaard/Oeschger oscillations are bundled into multimillennial Bond cycles, although with variable spacing (Bond et al., 1993). Each Dansgaard/Oeschger oscillation is slightly colder than the previous one through a few oscillations; then there is an especially long, cold interval, followed by an especially large, abrupt warming. The latter parts of the especially cold intervals are marked by the enigmatic Heinrich layers in the North Atlantic (Heinrich, 1988).
Heinrich layers are extensive deposits of coarse-grained sediment across the North Atlantic Ocean. Much of the material in these layers is sufficiently coarse that important transport by icebergs must have occurred. Each Heinrich layer is as much as 0.5 m thick near Hudson Strait, thinning to less than 1 cm on the east side of the Atlantic (Andrews and Tedesco, 1992; Grousset et al., 1993). The ice-rafted sediments are dominated by material with geochemical signatures indicating an origin in Hudson Bay, whereas sediments between and in the thin edges of Heinrich layers include more diverse sources (Gwiazda et al., 1996a,b). Sedimentation of thicker parts of Heinrich layers was much faster than that of surrounding sediments (McManus et al., 1998) and occurred in an anomalously cold and fresh surface ocean (Bond et al., 1993).
Heinrich events are correlated with greatly reduced North Atlantic deep water formation (Sarnthein et al., 1994) and climate anomalies similar to, but larger than, those of the cold phases of the non-Heinrich Dansgaard/ Oeschger oscillations (reviewed by Broecker, 1994; and Alley and Clark, 1999).
The panoply of abrupt climate change through the cooling into and warming out of the most recent global ice age and probably earlier ice ages has not been convincingly explained. However, as reviewed later, many hypotheses exist, and there is strong evidence of change in the fundamental mode of operation of parts of the coupled system of atmosphere, ocean, ice, land surface, and biosphere.
EEMIAN RAPID CLIMATE CHANGE
Temperatures similar to those of the most recent 10,000 years have been reached during previous interglacials, which have occurred approximately each 100,000 years over the last 700,000 years in response to features of earth’s orbit. Each of these interglacials was slightly different from the others, at least in part because the orbital parameters do not repeat exactly. The penultimate interglacial, about 125,000 years ago, is known by several names including the Eemian, Sangamonian, and marine isotope stage 5e (with the different terminologies originating in different disciplines or geographic regions and being broadly but not identically equivalent).
As the most recent near-equivalent of the current warm period, the Eemian is of obvious interest in learning what behavior is likely during warm times (van Kolfschoten and Gibbard, 2000). The orbital parameters for the Eemian produced somewhat more incoming solar radiation than
today in high northern latitudes, bringing warmer conditions, at least during summers (Montoya et al., 1998). This probably led to major retreat of the Greenland ice sheet, which likely explains high sea levels during that interval without major changes in the West Antarctic ice sheet (Cuffey and Marshall, 2000). Ice-core records from Greenland for this interval originally were interpreted as showing extremely large and rapid climate fluctuations, but flow disturbances are now known to have occurred and affected the records (Alley et al., 1995; Chappellaz et al., 1997).
Much work remains to be done on intact records from the Eemian, but it is increasingly clear from many paleoclimatic archives that although the Eemian included important paleoclimatic variability and ended abruptly, the warm period was not as variable as the periods during the slide into and climb out of the ice age that followed. In this relative stability, the Eemian had much in common with the current warm period, the Holocene.
A comprehensive survey of Eemian paleoclimatic conditions is not yet available, but a few examples of results are highlighted here. Notable variations in Eemian conditions perhaps linked to changes in oceanic circulation were documented by Fronval et al. (1998) and Bjorck et al. (2000). North Atlantic surface-water temperature fluctuations during the Eemian may have been 1-2°C, as opposed to fluctuations of 3-4°C during the cold stage that followed immediately and a deglacial warming into the Eemian of about 7°C (Oppo et al., 1997).
European pollen records are interpreted by Cheddadi et al. (1998) as indicating one rapid shift to cooler temperatures of 6 to 10°C between 4,000 and 5,000 years after the beginning of the Eemian, followed by smaller fluctuations of 2 to 4°C and 200 to 400 mm water/yr in the following few millennia. However, Boettger et al. (2000) found that the Eemian climate as recorded in isotopic data from central Germany was relatively stable, and the Eemian climate oscillations recorded in pollen records from the Iberian Margin similarly had low amplitude (Goñi et al., 1999). Cortijo et al. (2000) found that mid-latitude North Atlantic conditions during the Eemian involved no major instabilities, but that the cooling into the following glaciation occurred abruptly in less than 400 years.
Large fluctuations reconstructed for Lake Naivasha (Kenya) from sediment characteristics and diatom assemblages bear similarities to those observed during the Holocene (Trauth et al., 2001). This is at least suggestive of a general pattern of relatively more important fluctuations in low-latitude moisture availability during warm times and high-latitude temperatures during cold times.
Overall, the Eemian is neither stable and boring, nor extraordinarily variable. Most regions for which good data are available record significant and important fluctuations, some of which were abrupt, but with reduced variability compared to during the cooling into and warming out of ice ages. Attention is especially focused on drought conditions in low latitudes rather than temperature in high latitudes.
HOLOCENE RAPID CLIMATE CHANGE
The relevance of abrupt climate change of the ice age to the modern warm climate or future warmer climates is unclear. However, although glacial and deglacial rapid shifts in temperature were often larger than those of the Holocene (the last roughly 10,000 years), Holocene events were also important with respect to societally relevant climate change (Overpeck, 1996; Overpeck and Webb, 2000). For example, there were large rapid shifts in precipitation (droughts and floods) and in the size and frequency of hurricanes, typhoons, and El Niño/La Niña events. If they recurred, these kinds of changes would have large effects on society. It is not surprising that many past examples of societal collapse involved rapid climate change to some degree (Weiss and Bradley, 2001; deMenocal, 2001a).
This section summarizes some of the compelling evidence of rapid change during the Holocene. When we view the available evidence of abrupt climate change in the Holocene, it is apparent that their temporal and spatial characteristics are poorly understood. In addition, the causes of abrupt change are not well constrained. The lack of a mechanistic understanding regarding past abrupt climatic change is one of the unsettling aspects of the state of the art.
Among the most widely investigated rapid climate events of the early to middle Holocene are two that took place about 8,200 and 4,000-5,000 years ago. The former event (Figures 2.3 and 2.4) has been recognized in Greenland ice, the North Atlantic, North America, Europe, Africa, and elsewhere and has been tied to a temporary reduction in the North Atlantic thermohaline circulation generated by late-stage melting of the North American ice sheets that released a large, abrupt meltwater flood from ice-marginal lakes through Hudson Strait to the North Atlantic (Bjorck et al., 1996; Alley et al., 1997; Barber et al., 1999; Gasse, 2000; Gasse and van Campo, 1994; Kneller and Peteet, 1999, von Grafenstein et al., 1999; Yu and Eicher, 1998; cf. Stager and Mayewski, 1997). If the mechanism for this event has been identified correctly, the event was a final deglacial, or
muted Younger Dryas-like event. Changes locally might have been as large as 10°C in the North Atlantic, with changes of about 2°C extending well into Europe (Renssen et al., 2001). High-resolution pollen studies show substantial and rapid vegetation response to the event in central Europe, with early biological changes lagging climate by less than 20 years (Tinner and Lotter, 2001). Because so many Holocene climate records are available and the cause of the event is rather clear, it provides an opportunity for an especially well-documented test case of model sensitivity. The event is also important because it punctuated a time when temperatures were similar to or even slightly above more recent levels, demonstrating that warmth is no guarantee of climate stability.
A less well-understood hydrologic event from wet to dry conditions, occurring roughly 5,000 years ago, also took place during a warm period. This event is not as well documented and suffers from less than ideal temporal resolution of available records. It is most evident in African records (Gasse and Van Campo, l994; Gasse, 2000), the North Atlantic (Duplessy et al., 1992; Bond et al., 1997; deMenocal et al., 2000b; Jennings et al., in press), the Middle East (Cullen et al., 2000), and Eurasia (Enzel et al., 1999; Morrill et al., in review). Four mechanisms have been proposed to explain the event, all of which could have contributed. First, it might have been associated with a cooling in the North Atlantic, perhaps related to a slow-down in thermohaline circulation (Street-Perrott and Perrott, 1990; Gasse and van Campo, 1994; Kutzbach and Liu, 1997; deMenocal et al., 2000b). Second, it might be related to a subtle (and variable) ca. 1500-year oscillation in Atlantic variability (Bond et al., 1997) of poorly understood origin, but almost certainly involving ocean processes (Alley et al., 1999), and extending beyond the North Atlantic regions; recent work (Jennings et al., in press and Morrill et al., in review) indicated that the spatio-temporal dimensions of this variability could be complex. Third, an abrupt shift in the El Niño-Southern Oscillation (ENSO) system might have led to a more widespread event at about the time in question (Morrill et al., in review). Fourth, atmosphere-vegetation feedbacks triggered by subtle changes in the earth’s orbit might have triggered the event (Claussen et al., 1999) or at least amplified it (Kutzbach et al., 1996; Ganopolski et al., 1998; Braconnot et al., 1999).
Increasing attention is also being focused on the possibility that the ENSO system has changed its pattern of variability, perhaps rapidly. The best-documented shift in the frequency of ENSO variability occurred in 1976 (Trenberth, 1990), and it was probably one of several shifts in frequency to occur over the
last 200 years (Urban et al., 2000). Discussion continues on the statistical significance and long-term persistence of these switches and on whether they should be considered evidence of normal oscillations, of short-lived abrupt shifts, or of long-lived abrupt climate change (e.g., Rajagopalan et al., 1999; Trenberth and Hurrell, 1999a,b). Further back in the Holocene, the ENSO system might have been dramatically different from today, with much reduced variability and fewer strong events (Overpeck and Webb, 2000; Diaz and Markgraf, 2000; Cole, 2001; Sandweiss et al., 2001; Tudhope et al., 2001). Although the time at which modern ENSO variability became established is not known, there have been several model-based efforts to explain the changes, all tied to the response of the coupled atmosphere-ocean system to small orbitally induced insolation changes (Bush, 1999; Otto-Bliesner, 1999; Clement et al., 2000, 2001). The shift to more-modern ENSO variability also might have been coincident with other earth-system changes 4,000-5,000 years ago. Sandweiss et al. (2001) suggested that ENSO events were absent or substantially different from more recently between 8,800-5,800 years ago, present but reduced between 5,800-3,200 years ago, and increased to modern levels between 3,200-2,800 years ago, that would be consistent with other data that they summarize. Rodbell et al. (1999) placed the Holocene onset of El Niños at 7,000 years ago, with the beginning of modern levels reached 5,000 years ago.
Although there are other hints of important abrupt climate changes in the Holocene record, most of them have not been studied to the degree needed to place them in a coherent context (for example, examined at multiple sites). One important observation is that the landfall frequency of catastrophic hurricanes has changed rapidly during the Holocene. For example, the period about 1,000-3,500 years ago was active on the Gulf Coast compared with the last 1,000 years and changes in North Atlantic climate could be the primary cause (Liu and Fearn, 2000; Donnelly et al., 2001a,b). The period near 1,000 years ago was also possibly marked by a substantial change in hydrologic regimes in Central and North America (Hodell et al., 1995, 2001; Forman et al., 2001).
Climate variations within the last millennium are, in general, better resolved temporally and spatially than are variations earlier in the Holocene. This is due largely to the greater availability of annually dated records from historical documents, trees, corals, ice cores and sediments, but this availability is also due to greater emphasis on the last millenium by large paleoenvironmental science programs, such as PAst Global changES (PAGES) of the International Geosphere-Biosphere Programme (IGBP). Per-
haps the most studied rapid temperature shift of the Holocene is the change that began in the latter half of the nineteenth century and ended the so-called Little Ice Age. The shift and later state of substantial global warming were unprecedented in the context of the last 500 years and might be due to a combination of natural (such as solar and volcanic) and human-induced (such as trace-gas) forcing (Overpeck et al., 1997; Jones et al., 1998; Mann et al., 1998, 1999, 2000; Huang et al., 2000; Crowley, 2000; Briffa et al., 2001; Intergovernmental Panel on Climate Change, 2001a).
In contrast with the abrupt late nineteenth to early twentieth century warming, timing of the onset of the Little Ice Age is difficult to establish in that the change manifests itself as a period of slow Northern Hemisphere cooling beginning at or before ca 1000 (Mann et al., 1999; Crowley, 2000; Crowley and Lowery, 2000; Briffa et al., 2001) with several sustained cooler intervals thereafter (for example, the seventeenth century and early nineteenth century).
There are insufficient paleoclimate records to allow complete reconstruction of the last 1,000 years of change in the Southern Hemisphere, and uncertainty remains on the amplitude of Northern Hemisphere change in this interval (e.g., Briffa et al., 2001; Huang et al., 2000). There is still debate as to whether the “Medieval Warm Period” was more than a Northern Hemisphere warm event (Mann et al., 1999; Crowley, 2000; Crowley and Lowery, 2000; Briffa et al., 2001; Broecker, 2001). Moreover, evidence is scarce outside the North Atlantic-European sector (Jennings and Weiner, 1996; Keigwin, 1996; Broecker, 2001) for medieval temperatures that were close to mean twentieth century levels. Additional annually resolved records for the last 2,000 years are needed to answer such fundamental questions.
Holocene Droughts
The existing temperature records, as described above, make it clear that natural variability alone can generate regional to hemispheric temperature anomalies that are sufficient to affect many aspects of human activity. However, the record of hydrologic change over the last 2,000 years suggests even larger effects: there is ample evidence that decadal, even century-scale, drought can occur with little or no warning.
A synthesis of US drought variability over the last 2,000 years (Woodhouse and Overpeck, 1998) used records from a diverse array of proxy sources (cf. Cronin et al., 2000; Stahle et al., 1998). From this synthesis, it was concluded that multi-year droughts similar to the 1930s Dust
Bowl or the severe 1950s southwest drought have occurred an average of once or twice per century over the last 2,000 years. Furthermore, decadal “megadroughts” have also occurred often, but at less frequent intervals. The last of these occurred in the sixteenth century, spanned much of northern Mexico to Canada, and lasted over 20 years in some regions (Woodhouse and Overpeck, 1998; Stahle et al., 2000). An earlier event in the thirteenth century also persisted for decades in some locations and involved the long-term drying of lakes in the Sierra Nevada of California (Stine, 1994) and the activation of desert dunes in parts of the High Plains (Muhs and Holliday, 1995, 2001). There is evidence of even longer droughts further back than the last millennium (Stine, 1994; Laird et al., 1996; Fritz et al., 2000), including an unprecedented multidecadal drought that has been implicated in the collapse of the Classic Mayan civilization (Hodell et al., 1995, 2001), several droughts that led to the remobilization of eolian landforms on the High Plains (Forman et al., 2001), and linkage between droughts in tropical and temperate zones (Lamb et al., 1995). An important conclusion from paleodrought research is that drought regimes can shift rapidly and without warning. A prominent example is the shift, at about 1200 BP, from a regime characterized by frequent long droughts on the High Plains to the current regime of less-frequent and shorter droughts (Laird et al., 1996; Woodhouse and Overpeck, 1998).
Despite growing knowledge of the paleodrought record, causal mechanisms of changes are poorly understood (Woodhouse and Overpeck, 1998). Persistent oceanic temperature anomalies, perhaps related to ENSO or the North Atlantic Oscillation (NAO) as described below, have been proposed as one potential forcing mechanism (Forman et al., 1995; Black et al., 1999; Cole and Cook, 1998; Cole et al., submitted), but cause and effect have yet to be proved in the case of any decadal or longer paleodrought in North America. There is also good evidence of late Holocene multidecadal droughts outside North America (e.g., Stine, 1994; Verschuren et al., 2000; Nicholson, 2001); their causes are equally enigmatic. Thus, although we know that droughts unprecedented in the last 150 years have occurred in the last 2,000 years and so could occur in the future, we do not have the scientific understanding to predict them or recognize their onset.
Holocene Floods
Just as the twentieth century instrumental record is too short to understand the full range of drought, it is too short to understand how the fre-
quency of large floods has changed (Baker, 2000). Data on past hydrological conditions from the upper Mississippi River (Knox, 2000) and from sediments in the Gulf of Mexico (Brown et al., 1999) record large, abrupt shifts in flood regimes in the Holocene, which may have been linked to major jumps in the location of the lower Mississippi (delta-lobe switching). In the western United States, there is growing evidence that flood regimes distinctly different from today, and also episodic in time, were the norm rather than the exception. The frequency of large floods in the Lower Colorado River Basin, for example, appears to have varied widely over the last 5,000 years (Ely et al., 1993; Enzel et al., 1996), with increased frequency from about 5,000-4,000 years ago, then lower frequency until about 2,000 years ago, and some abrupt shifts up, down, and back up thereafter (Ely, 1997). Those flood-frequency fluctuations and substantial fluctuations elsewhere around the world (e.g., Gregory et al., 1995; Baker, 1998; Benito et al., 1998) appear to be linked to climate shifts but in poorly understood ways. Clearly, a predictive understanding of megadroughts and large floods must await further research.
This observation about droughts and floods applies at some level to all the abrupt climate changes recorded in proxy records. The data are clear. Ice-age events were especially large and widespread and involved changes in temperature, precipitation, windiness, and so on. Holocene events were more muted in polar regions, might have been more regionalized, and usually involved water availability, but often with important temperature changes as well. Multi-characteristic global-anomaly maps are not available for any of the abrupt changes, and additional records and proxy techniques will be required to provide such anomaly maps. Coverage gaps appear especially large in the oceans and southern latitudes, although broad gaps also exist elsewhere.
RAPID CLIMATE CHANGES IN THE INSTRUMENTAL PERIOD
Instrumental records from scientific monitoring programs offer the possibility of capturing directly the relevant data on abrupt climate change with greater accuracy and spatial coverage than are possible from the necessarily limited proxy records. The relatively short period of instrumental records means that they have missed most of the abrupt changes discussed above, although some droughts and the warming from the Little Ice Age have been captured rather well. Instrumental records will become more valuable as their length increases, which argues for maintenance of key
observational data sets. Instrumental records also are critical in characterizing patterns of climate variability that might have contributed to paleoclimatic abrupt change, and might contribute to abrupt climate change in the future. It is important to the understanding of abrupt climate change that these patterns or “modes” of circulation and its variability be understood, particularly on the time-scale of decades to centuries. The abrupt changes surveyed here are smaller in strength than the extreme events of the paleoclimate record, yet they are nonetheless significant as human populations press the capacity of the environment, locally and globally.
Atmospheric instrumental data include surface values and vertical profiles of numerous physical variables, including temperature, pressure, radiation, and winds. Surface observations, satellite radiometric observations, and the global network of regularly launched radiosonde profilers are assimilated into computer models of the atmosphere to analyze weather and climate. They capture both the conditions that cause atmospheric circulation and the resulting atmospheric motions. Much of our current understanding of climate comes from the relatively accurately observed period since 1950. More subtle are the measurements of trace chemicals, which both affect the physical state of the atmosphere, and can be used to infer its motions. The longest atmospheric time series, dating back several hundred years, are surface temperature and pressure.
The ocean, like the atmosphere, is a thin fluid envelope covering much of the earth. Satellites are now collecting global observations of the temperature, elevation and roughness of the sea surface, which tell us the surface currents and winds fairly accurately. Crucial climate variables, such as sea-ice cover and movement (and to a lesser accuracy, ice thickness), have been measured by satellites beginning in the 1970s. Yet, oceanic data are still more restricted in coverage and duration than atmospheric data, for it is still difficult to penetrate the depths of the ocean with instruments in sufficient numbers.
In addition to the purely instrumental problem, ocean currents and eddies are smaller in size than major atmospheric wind fields, making the mapping of ocean circulation more difficult (weather patterns are well matched in size to the spacing of major cities, which historically made their discovery possible, using simple barometers). Another contrasting property is the time for fluid to adjust fully to a change in external forcing: in the atmosphere this time is a month or two, while in the ocean it is measured in millennia. The ocean dominates the global storage of heat, carbon, and
water of the climate system while the atmosphere dominates the rapid response of the climate system and more directly impacts human activity.
The ocean’s direct impact on the atmosphere is primarily through sea-surface temperature and ice-cover. Thus, it is fortunate that temperature records are among the longest oceanic time-series and have the best spatial coverage. Data sets include sea-surface temperatures from ocean vessels, long coastal sea-level and temperature records, and shorter or more scattered time-series of temperature and salinity from surface to sea-floor. Increasingly long time-series of directly measured ocean currents are becoming available, particularly in the tropics. The TAO (Tropical Atmosphere-Ocean) array in the Pacific, sometimes called the world’s largest scientific instrument, measures equatorial temperatures, winds and currents around one-quarter of the earth’s circumference (e.g., McPhaden et al., 1998). The array has given us detailed portraits of El Niño-Southern Oscillation (ENSO) cycles and equatorial general circulation.
Over longer times other aspects of oceanic circulation, chemistry and biology become important to climate. For example, the heat storage available to the atmosphere is strongly dependent on circulation and salinity stratification of the upper ocean. The depths of the ocean become involved as the thermohaline circulation (THC) and wind-driven circulation interact to reset surface conditions. There are “overturning circulations” at many scales, from the global THC (see Plate 4) to the shallow, near-surface cells of overturning lying parallel to the equator. Direct measurements of the circulation of the deep ocean are still sparse, and indirect means are often used to infer the circulation. Water density (from measured temperature and salinity) can be combined with dynamical constraints and atmospheric observations of air-sea interaction to estimate global ocean circulation (e.g., Ganachaud and Wunsch, 2000; Reid, 1994, 1998, 2001). The results are consistent with the limited direct measurements of currents, and also with the patterns of observed chemical tracers in the ocean. The tracers include natural dissolved gases and nutrients, dynamical quantities such as potential vorticity and potential density, and chemical inputs from human activity. Transient chemical tracers, injected into the atmosphere and subsequently absorbed by the ocean, provide particularly useful images of the ocean circulation. Bomb radiocarbon, tritium and chlorofluorocarbons (CFCs), for example, allow verification and quantitative assessment of the pathways of high-latitude sinking, equatorward flow in boundary currents, and interaction with the slower flow of mid-ocean regions (Broecker and Peng, 1982; Doney and Jenkins, 1994; Smethie and Fine, 2001).
The location, strength and depth penetration of the major sinking regions of the ocean at high latitude (see Plate 4) are known to have changed during glacial cycles, emphasizing the importance of sea-ice cover in insulating the ocean from the atmosphere, preventing deep convection and physical sinking from occurring (e.g., Sarnthein et al., 1994). The contrasting effect of freezing sea-water is that salty brine is rejected from the ice, yielding a small but very dense volume of water that can contribute to sinking events. During the twentieth century lesser yet still significant shifts of the deep circulation (e.g., Molinari et al., 1998) have been verified by tracers and direct current measurements.
Abrupt changes in climate can occur with spatial patterns that in some way reflect the natural dynamics of atmosphere and ocean. These “modes” of circulation are seen in the seasonal, interannual and decadal variability of the system, and have great potential as an aid to understanding just how abrupt changes can occur. At work in establishing the modes are “teleconnections” both vertically, and across the globe. Various waves, particularly Rossby (or “planetary”) waves and Kelvin waves, and unstable waves on the time-averaged circulation, are involved, as is the direct transport of climate anomalies by the circulation.
Natural variability of climate is now occurring in the context of global warming, so the discussion of abrupt climate change during the period of instrumental records must acknowledge the presence of anthropogenic and natural change, and the possibility of strong interaction between them.
PATTERNS OF CLIMATE VARIABILITY
Instrumental records show that the climate is characterized by patterns or modes of variability, such as the polar annular modes and ENSO of the equatorial Pacific, as described below. The spatial patterns can provide regional intensification of climate change in quite small geographic areas. The strong couplings and feedbacks among at least the atmosphere, oceans and sea ice, and probably other elements of the climate system, allow a pattern to persist for periods of years to many decades. The different regional modes also interact with one another. For instance, Amazonian rainfall responds to a mode of tropical Atlantic variability, which itself might be responding to ENSO or the Arctic Oscillation.
The behavior of highly idealized models of the climate system suggests that climate change can be manifested as a shift in the fraction of the time that climate resides in the contrasting phases (for example, warm/cold or
strong-wind/weak-wind) of such oscillations (Palmer, 1993). However, the scientific community is divided on the issue of whether analogous “regime-like” behavior exists in instrumental records related to the real climate system. Hansen and Sutera (1995), Corti et al. (1999), and Monahan et al. (2000) found evidence of such mode-shift behavior. However observational evidence has been questioned (e.g., Nitsche et al., 1994; Berner and Branstator, 2001). Also, questions remain about whether such behavior should be characteristic of an entity with as many degrees of freedom as the climate system (Dymnikov and Gritsoun, 2001).
The possibility that mode shifts participated in or provide clues to the large, abrupt climate changes of preinstrumental times suggests common mechanisms or even common causes. Thus, the study of abrupt climate change should involve consideration of the preferred modes of the climate system.
Annular Modes
The annular modes—the Arctic Oscillation (AO) and the Antarctic Oscillation (AAO)—primarily affect polar to middle-latitude regions in both the North and South and are the dominant modes of climate variability in these areas, especially in the winter. The AO and AAO represent a transfer of atmospheric mass between subtropical high-pressure regions and polar lows. A strongly positive state of an annular mode is associated with intensified highs and lows driving strong atmospheric circulation. The negative state has much less difference between high- and low-pressure regions and thus is related to weaker atmospheric circulation.
The southern annular mode is moderately symmetric about the pole, but owing to the complex geometry of northern continents, the AO is especially strong over the North Atlantic and less evident in other regions. Thus, the mode was originally described as the North Atlantic Oscillation (NAO), and an NAO index was based on the difference in atmospheric pressure between Portugal and Iceland (Hurrell, 1995). When the winter pressure difference is large, frequent strong storms take a northeasterly track across the North Atlantic, producing warm and wet weather in northern Europe, cold and dry conditions in northern Canada, and mild and wet conditions along the US East Coast. In contrast, a small pressure difference produces fewer, weaker storms, taking an easterly track to produce a moist Mediterranean, cold northern Europe, and a snowy US East Coast in response to frequent cold-air outbursts.
ENSO and ENSO-Related Variability
A weakening of the trade winds in the equatorial Pacific and attendant warming of the sea surface (or lack of cooling by upwelled cold water) is known as an El Niño event. Such events alternate with an opposing state, popularly referred to as “La Niña,” with strong trade winds and upwelling of cold waters off Peru and along the Equator. The few-year oscillation between those different states is the El Niño/Southern Oscillation. The coupled oscillation of the tropical ocean and atmosphere is important in global climate, with impacts that extend far beyond the tropical Pacific to the tropical Atlantic and Indian Oceans, to the Southern Ocean, and to middle to high latitudes in the Northern Hemisphere. There are speculations that greenhouse warming is sufficient to put the world into a warmer, near-perpetual El Niño state (e.g., Timmerman et al., 1999; Federov and Philander, 2000), but there is no strong consensus.
ENSO might be linked to another of the leading patterns of variability, the so-called Pacific North American (PNA) pattern, which exerts a strong influence on distribution of rainfall and surface temperature over western North America. Like the AO, the PNA pattern fluctuates randomly from one month to the next, but also exhibits what appear to be systematic variations on a much longer time scale. Since 1976-1977, the positive polarity of the PNA pattern—marked by a tendency toward relatively mild winters over Alaska and western Canada, below-normal rainfall and stream flows over the Pacific Northwest, and above-normal rainfall in the southwestern United States—has been prevalent, whereas during the preceding 30-year period the opposite conditions prevailed.
The abrupt shift toward the positive polarity of the PNA pattern in 1976-1977 was coincident with and believed to be caused by a widespread pattern of changes throughout the Pacific Ocean. Sea-surface temperatures along the equatorial belt and along the coast of the Americas became warmer, while farther to the west at temperate latitudes the sea surface became cooler (Nitta and Yamada, 1989; Trenberth, 1990; Graham, 1994). An array of changes in the marine ecosystem occurred around the same time (Ebbesmeier et al., 1991). For example, salmon recruitment underwent a major readjustment toward more abundant harvests along the Alaskan coast accompanied by deteriorating conditions in southern British Columbia and the US Pacific Northwest (Francis and Hare, 1994). Another basin-wide “regime shift” that was analogous in many respects to the one that occurred in 1976-1977, but in the opposite sense, was observed during the 1940s (Zhang et al., 1997; Minobe and Mantua, 1999), and there are
indications of prior shifts as well (Minobe, 1997). The suite of atmospheric and oceanic changes that have been linked to these basin-wide regime shifts is collectively referred to as the Pacific Decadal Oscillation (PDO) (Mantua et al., 1999).
The sea surface temperature (SST) patterns associated with the PDO and ENSO are similar, the main distinction being that the extratropical features are somewhat more prominent in the PDO pattern. As in the few-year variations associated with the swings between El Niño (warm) and La Niña (cold) conditions in the equatorial Pacific, warm and wet decades in the equatorial zone tend to be marked by extratropical circulation patterns that favor an unusually active storm track in the mid-Pacific that splits toward its eastern end. An unusually large fraction of disturbances moves northeastward, bringing mild, wet weather to the Alaska panhandle; many of the remainder track southeastward, bringing heavy rains to southern California and the US desert Southwest. The mountain ranges of British Columbia and the US Pacific Northwest, which lie directly downstream from the split in the storm track, tend to receive less than the normal amount of winter snowfall, and this reduces water supplies for the following summer season. The dynamic mechanisms responsible for the long-range “teleconnections” between the equatorial Pacific and the extratropics are better understood than the processes that control the evolution of this phenomenon on the decadal time scale. Hence, regime shifts such as the one that occurred in 1976-1977 are difficult to diagnose in real time, let alone to predict.
There are several different schools of thought as to the nature of the interdecadal PDO variability, which has shown both the abruptness and persistence to qualify under our definition of abrupt climate change. The default hypothesis is that the PDO is merely a reflection of stochastic variability originating in the atmosphere but amplified by positive feedbacks associated with coupling between the atmosphere and ocean (Bretherton and Battisti, 2000). If this interpretation is valid, it follows that this ENSO-like variability is inherently unpredictable (i.e., that it becomes clearly evident only with the benefit of hindsight). Hopes that the phenomenon is deterministic, and therefore predictable, are based on the notion that ocean dynamics play an active role in PDO evolution, to the extent of setting the time scale for the major swings back and forth between the positive and negative polarity of the PDO pattern. One oceanic process that could conceivably set the time scale is the recirculation time for water parcels in the clockwise North Pacific and counterclockwise South Pacific subtropical
gyres. A second subtropical gyre time scale is set by the time it takes for oceanic planetary waves to propagate to the western boundary currents, which then feed back on the atmospheric circulation. A third is the time required for water parcels subducted in the extratropical North and South Pacific at latitudes around 35°N and 25°S to reach the equatorial thermocline. Mechanisms that depend on those processes have been demonstrated to be capable of producing ENSO-like interdecadal variability in coupled atmosphere-ocean models (Latif and Barnett, 1996). Further data and model results are needed to learn the extent to which the time scales of the variability can change and whether the climate can “lock into” one or another phase of the major oscillations. Mean ice-age conditions in the tropical Pacific appear to have been more La Niña-like than during the Holocene; perhaps this suggests a linkage. Species and shell chemistry and isotopic ratios of planktonic foraminfera (Lee et al., 2001) and chemistry and isotopic ratios of corals (Tudhope et al., 2001) give evidence for equatorial Pacific sea-surface temperatures back at least 130,000 years. Cooler mean SST during the glaciations (~3°C cooler than modern at the last glacial maximum in the Lee et al. study; also, Patrick and Thunell, 1997; Pisias and Mix, 1997; also see Alley and Clark, 1999) and continued, yet weaker ENSO cycles are evident. Stronger glacial easterly equatorial winds are inferred (Lyle, 1988).
Tropical Variability in the Atlantic and Indian Oceans
Tropical variability arising from feedbacks within the Atlantic and Indian equatorial regions also contributes to regional climate modes, although of smaller global impact than ENSO, probably because of the vast width of the Pacific relative to the Atlantic or Indian. Tropical Atlantic variability correlates strongly with forcing from ENSO and the AO. The tropical Atlantic also has a mode that is symmetric about the equator with mechanisms similar to those in ENSO and might contribute to regional predictability (Amazonian and west African/Sahelian rainfall). Off-equatorial modes of tropical Atlantic variability are associated with the strength and location of the northern and southern Intertropical Convergence Zones (ITCZs); work in recent years has revealed that Northern and Southern Hemisphere SST variability are not tightly linked. Tropical Atlantic variability has a major impact on rainfall in northern Africa and northern South America and an impact on hurricane frequency and patterns in the North Atlantic.
In the Indian tropical region, the seasonal monsoon driven by ocean-land temperature contrasts has a major impact on human life. The monsoon is perhaps the classic example of ocean-atmosphere-land interactions. During boreal summer, a northward shift of the ITCZ to the Indian sub-continent creates a major precipitation and heat source in this region. Interannual variability in the Indian monsoon correlates closely with tropical Indian Ocean SST. Indian Ocean SST is affected by ENSO and by an intrinsic Indian Ocean east-west mode of variability similar in mechanism but uncorrelated with the Pacific’s ENSO.
Extended Summer Drought
The Northern Hemisphere’s annular mode and the decade-to-decade ENSO-like variability discussed in the previous sections both affect Northern Hemisphere climate mainly during the winter season, and they involve the atmosphere’s own preferred modes of month-to-month variability. In contrast, drought and desertification, when they occur in extratropical latitudes, are primarily summer phenomena whose geographic distribution and evolution are determined as much by land-surface processes as by atmospheric dynamics. Dynamical modes may still be involved, however, as the summer pattern of great anticyclones over the oceans responds to the heating of the continents. Kelvin and Rossby waves are active in determining the shape, extent, and flow of moisture in this pattern (Rodwell and Hoskins, 2001), and in turn these waves are involved in dynamical modes as noted above.
An extended drought popularly known as the Dust Bowl affected large areas of the United States through most of the decade of the 1930s. Over parts of the Great Plains and Midwest, the 1931-1939 summers were on the average substantially warmer than the long-term climatological mean for the season, with daily maxima often in excess of 40°C, and precipitation was deficient (Borchert, 1950; Skaggs, 1975; Karl and Quayle, 1981; Diaz, 1983; Chang and Wallace, 1987; Chang and Smith, 2001). Much of the topsoil was irreversibly lost—blown away in dust storms that darkened skies as far downstream as the eastern seaboard. Numerous farms were abandoned, and agricultural productivity dropped sharply. Many who lived through the Dust Bowl must have wondered whether climatic conditions would ever be suitable for farming again. Yet toward the end of the decade, the rains returned, and the region has never since been plagued by such an extended drought.
What initiated the Dust Bowl in the early 1930s and what caused the rains to return nearly a decade later are still open questions. The prevailing view is that drought is an inherently stochastic phenomenon, initiated and terminated by random fluctuations in atmospheric circulation patterns, and sustained over long periods of time by positive feedback from the terrestrial biosphere (Namias, 1960; Rind, 1982; Shukla and Mintz, 1982; Karl, 1983; Sud and Molod, 1988; Bravar and Kavvas, 1991; Xue and Shukla, 1993; Dirmeyer, 1994; Lare and Nicholson, 1994). A few weeks of abnormally hot, dry weather are sufficient to desiccate the upper layers of the soil, reducing the water available for plants to absorb through their root systems. The plants respond by reducing the rate of evapotranspiration through leaves during the daylight hours (Dirmeyer, 1994; Radersma and de Reider, 1996; Xue et al., 1996). Reduced evapotranspiration inhibits the ability of the plants to keep themselves and the earth’s surface beneath them cool during midday, when the incoming solar radiation is strongest (Somayao et al., 1980; Gardner et al., 1981). This favors higher afternoon temperatures and also reduces the humidity within the lower 1-2 km of the atmosphere (Walsh et al., 1985; Karl, 1986; Georgakakos et al., 1995; Huang et al., 1996; Dai et al., 1999). Because this boundary-layer air is the source of roughly half the moisture that condenses in summer rainstorms over the central United States, lower humidity favors reduced precipitation (Brubaker et al., 1993; Eltahir and Bras, 1996; Koster and Suarez, 1996; Findell and Eltahir, 1999; Trenberth, 1999). Higher daily maximum temperatures, lower humidity, and reduced precipitation all increase the stress on plants. If the stress is sufficiently severe and long, the physiological changes in plants become irreversible. Once the threshold is crossed, the earliest hope for the restoration of normal vegetation is the next spring growing season, which can be 6 or even 9 months away. Throughout the remainder of the summer and early autumn, the parched land surface continues to exert a feedback on the atmosphere that perpetuates the abnormally hot, dry weather conditions (Yeh et al., 1984; Huang and Van den Dool, 1993; Yang et al., 1994; Huang et al., 1996; Fennesy and Shukla, 1999).
The wilting of the plants also affects hydrological conditions in the ground. In the absence of healthy root systems, water runs off more rapidly after rainstorms, leaving behind less to nurture the plants. Once the water table drops substantially, an extended period of near- or above-normal precipitation is required to restore groundwater (Palmer, 1965; Entekhabi et al., 1992; Bravar and Kavvas, 1991; Stamm et al., 1994). The remarkable year-to-year persistence of the 1930s drought attests to the memory of the
vegetation and the ground. Once established, an arid climate regime, such as the one that prevailed during the Dust Bowl, appears to be capable of perpetuating itself until a well-timed series of rainstorms enables the vegetation to regain a foothold (Dirmeyer and Shukla, 1996; Wang and Eltahir, 2000a,b; Clark et al., 2001).
The onset and termination of the 1930s Dust Bowl are examples of abrupt regime shifts from a climate conducive to agriculture to a climate more characteristic of a desert region and back again. During the time covered by instrumental records, such shifts have occurred rather infrequently in the United States but more regularly in semiarid agricultural regions, such as the Sahel, northeast Brazil, and the Middle East (Nicholson et al., 1998; Street-Perrott et al., 2000). If such dry regimes are sufficiently frequent or long, the cumulative loss of topsoil due to wind erosion makes it increasingly difficult for vegetation to thrive, and difficult-to-reverse “desertification” occurs (United Nations, 1980). Thus far, the United States has experienced relatively little true desertification, but other regions of the globe have not been as fortunate. For example, it is well documented that the Sahara expanded northward and engulfed formerly productive agricultural regions of North Africa during the last few centuries of the Roman Empire (Reale and Dirmeyer, 2000); this transition might well have involved a series of prolonged drought episodes analogous to the Dust Bowl.
Agricultural practices influence the retention of topsoil. Poor cultivation practices and overgrazing have been blamed for the desertification that has plagued North Africa, the Sahel, and other semi-arid regions (Otterman 1981; Wendler and Eaton, 1983; Balling, 1988; Bryant et al., 1990; BenGai et al., 1998; Nicholson et al., 1998; Pickup, 1998), and the planting of hedgerows designed to impede the flow of wind-blown dust has been credited with sparing much of the US Great Plains from suffering a similar fate. Whether adherence to environmentally sound agricultural practices will be sufficient to prevent further desertification is less clear.
Global warming could render such regions as the western and central United States more vulnerable to extended drought episodes by increasing temperatures during the growing season, and thereby increasing the rate of evapotranspiration. There is no conclusive evidence of such behavior in response to the rapid warming of the last two decades, but simulations with climate models indicate that more pronounced warming like that predicted to occur by the end of the twenty-first century could serve to increase the frequency of drought episodes and the risk of irreversible desertification (Rind et al., 1989; Henderson-Sellers et al., 1995; Bounoua et al., 1999).
TRENDS RECORDED INSTRUMENTALLY
Instrumental records are becoming long enough to show trends in climate, although the distinction between trends and longer cycles is never simple. The Little Ice Age set the stage for the global warming of the last century, which probably had both natural and anthropogenic causes (Intergovernmental Panel on Climate Change, 2001b). A brief review of some of the main trends is provided here, showing that these trends often exhibit regional abruptness and are linked to modes of climate variability, again documenting the importance of instrumental records to the study of abrupt climate change.
Most long instrumental records were initiated in the nineteenth and twentieth centuries. The central England temperature time series is one of the longest continuous instrumental climate records (Figure 2.6), and it cap-
FIGURE 2.6 The Central England temperature time-series is one of the longest continuous instrumental records of climate change, with data from 1659 to 2000. Top figure shows summer and bottom figure shows winter. Temperature scale is in degrees Celcius. (Data courtesy of P. Jones, University of East Anglia.)
tured not only the warming of the last century, but also much of the preceding Little Ice Age (Jones and Bradley, 1992). Long cool periods, such as the summers throughout the nineteenth century, were punctuated by extreme events. The cold phases were known to have had important effects on human activity, as in the abrupt European cooling from the unusually warm 1730s to the cold 1740s. Famine occurred across western Europe, especially in Ireland and France, where farmers who depended on wheat and potatoes were slow to adapt. In Ireland, this is known as the “forgotten famine”; as many people died as in the famed “potato famine” of the 1840s.
In much of the northern United States, 1816 was the “year without a summer” (Stommel and Stommel, 1983); it was linked to the atmospheric veil from the volcanic eruption of Tambora in Indonesia. Snow fell in July in northern New England, farming was disrupted, and crops failed. The event might have spurred the westward migration of farmers from the thin soils of the hill farms of New Hampshire. Without suggesting a causal link, La Niña occurred in late 1815; by late 1816, a strong El Niño developed. There was severe drought in Brazil in 1816-1817. Single volcanic eruptions often have a widespread cooling effect (e.g., Grootes and Stuiver, 1997; Zielinski et al., 1997). Such effects ordinarily would be considered “noise” in a climate state; however the compounding of such noise with longer climate trends, such as the Little Ice Age, can increase the impacts, as observed. Volcanic forcing also represents an experiment in which the response of global climate modes can be observed in great detail, helping understand how modes might respond to other forcings.
AO/NAO Trends and Variability
The winter atmospheric circulation in the Northern Hemisphere has undergone some remarkable changes during the last several decades. Sea-level pressures over the Arctic have fallen by about 6 hPa (Walsh et al., 1996), and the subpolar westerly winds have strengthened, particularly over the Atlantic sector. Related circulation changes have favored mild winters over most of Russia, China and Japan, and drought over southern Europe and parts of the Middle East (Hurrell, 1995; Thompson et al., 2000). Warming during the period has been concentrated in central and northern Asia and northwestern North America. Retreating glaciers, warming permafrost, and decreasing sea-ice cover have been observed in Alaska, where temperatures increased abruptly in the late 1970s, distinct from the post-1980 acceleration of globally averaged temperature rise. The patterns in these
trends bear a strong resemblance to the Northern Hemisphere’s leading pattern of variability, the Arctic Oscillation/North Atlantic Oscillation (AO/ NAO) (Thompson and Wallace, 1998; Wallace, 2000). That is, the observed trends in the wintertime temperatures and precipitation appear to be largely regional expressions of the positive trend of the AO/NAO. There are indications of analogous trends in the Southern Hemisphere, in association with its annular mode (Thompson et al., 2000).
Several ideas have been put forth concerning the cause of those trends. Shindell et al. (1999, 2001) have proposed that they might be occurring in response to increasing concentrations of greenhouse gases, which warm the lower atmosphere but cool the stratosphere. Indeed, similar trends have been simulated in an atmospheric model driven by increasing concentrations of greenhouse gases. It has also been suggested that stratospheric ozone depletion (Volodin and Galin, 1999) and trends in sea-surface temperatures (Rodwell et al., 1999; Hoerling et al., 2001) might be capable of inducing similar trends in the AO/NAO. Because favored patterns of variability tend to be highly sensitive to external forcing, it is indeed quite plausible that they can be changed in a number of ways. Fyfe et al. (1999) give a contrasting view, that the AO/NAO did not appear to be altered substantially by greenhouse forcing, yet its Southern Hemisphere counterpart, the annular “AAO” mode, was indeed strongly amplified.
Whatever its cause, the observed trend in the AO/NAO is influencing other components of the earth system. The trend has altered the distribution of deep convection over the North Atlantic (Lilly et al., 1999, Dickson et al., 1996), caused glaciers in Norway to advance (Hurrell, 1995), and contributed to the thinning of the stratospheric ozone layer over middle and high latitudes of the Northern Hemisphere during winter and early spring (Thompson et al., 2000). Interactions with the oceanic thermohaline circulation (THC) have the potential to exert positive feedback on the AO/NAO itself, increasing its variability on decadal and longer scales. Owing to such feedback, it is conceivable that shifts in the AO/NAO contributed to some of the large climatic swings in the paleoclimate record.
If trends observed in the AO/NAO during the last 30 years were to continue into the twenty-first century, they could have important societal impacts. For example, the recovery of the stratospheric ozone layer from human-induced depletion during the twentieth century could be delayed by several decades (Shindell et al., 1999).
Abrupt Warming of the North Atlantic, 1920 to 1930
Global-average surface temperature records show two principal periods of warming during the twentieth century. The warming following 1970 has occurred widely, yet with regions of concentration in northern Asia and northwestern North America. Anthropogenic forcing is widely suspected to be a contributing cause (Intergovernmental Panel on Climate Change, 2001b). The warming earlier in the century is less likely to be of anthropogenic origin, although this is an unsettled issue; solar and volcanic forcing may have played a role (Delworth and Knutson, 2000; Stott et al., 2000; Hegerl et al., 2000).
Global temperature has evolved very differently, in space, during the two warmings (Figure 2.7). The earlier twentieth-century episode was concentrated in the far north. The warming seems to have appeared first in the Barents Sea; for example, in the records from Turuhansk, a city on the Yenisey River in northern Siberia. Sparse temperature records are supplemented by observations of a strong increase in ocean salinity and decrease in sea ice cover in the Nordic Seas (Kelley et al., 1982, 1987). Good records from Danish stations on the west Greenland coast show the strongest and most abrupt arrival of warming at Upernavik, where a 4°C rise in surface
FIGURE 2.7 Zonally averaged observed surface air temperature, plotted against latitude and time. Land stations only (Delworth and Knutson, 2000). Reading figure from left to right, one sees the rapid, concentrated arrival of warm temperatures in the 1920s, contrasting the late twentieth century warming that is spread across many latitudes. Temperature scale is in degrees Celsius.
air temperature occurred between 1920 and 1930; much of the warming of the twentieth century at this site took place during that decade (Figure 2.8, Durre, 2001).
Effects of those sudden changes on oceanic ecosystems were widespread (Intergovernmental Panel on Climate Change, 2001a, Ch. 13, 16; Dickson, 2001). Northward dislocations of plankton, fish, mammals, and birds were extreme, including the range of economically important species, such as herring (Figure 2.9) and cod. In the case of cod, the warm ocean greatly extended their range, as larvae were transported north by the Irminger Current from the waters around Iceland. The northern catch rose from nothing to 300,000 tons per year in the 1950s and 1960s, then declined abruptly when the surface cold water reappeared in the late 1960s. Earlier successful cod fisheries were seen near Greenland in the 1820s and 1840s, but none had occurred in the wide interval between then and 1920. Such effects were also widespread in the Nordic and Barents Seas.
Causes of the abrupt yet long-lasting northern warming are not clear. The Arctic region as a whole seems to amplify climate variability, as we are witnessing now. Relationship with the AO/NAO mode is not clear; the indexes of the mode were strongly negative in 1910-1920 and strongly positive in 1920-1930, indicating enhanced cyclone activity in the subpolar Atlantic through the 1920s with southerly winds at the entrance to the Nordic Seas. Climate-model simulations (Delworth and Mann, 2000) suggested that the warming could have occurred with strong natural variability, through an increase in oceanic meridional overturning circulation, which brought warm, saline surface waters into the sub-Arctic and Arctic. In that
FIGURE 2.8 Surface air temperature anomalies at Upernavik, West Greenland (Adapted from I.M. Durre, personal communication, 2001).
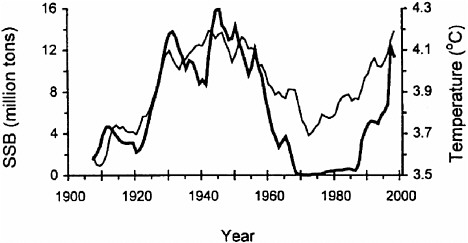
FIGURE 2.9 Spawning stock biomass (SSB) of herring in the Nordic Seas, responding to the abrupt warming of 1920s (Toresen and Ostvedt, 2000). SSB (bold line); temperature (thin line).
study, anthropogenic contributions to the earlier warming were also significant. The close proximity of the northern Atlantic focus of this warming to the dominant sinking regions of the global deep-ocean circulation makes this episode particularly relevant to global climate.
Abrupt Cooling and Freshening of the Subpolar North Atlantic, 1972-1996
Long-term measurements appropriate to climate variability studies are scarce in the ocean. Temperature records at a few coastal sites, and tide gauge records, have been sustained. Around 1948, a network of ocean weather stations was established by the International Civil Aviation Organization, mostly for atmospheric measurements. In the United States, these were manned by ships of the U.S. Coast Guard. A few, however—such as Bravo in the Labrador Sea, Mike in the Norwegian Sea, and Papa in the subpolar North Pacific—carried out deep hydrographic stations, as well as weather observations. Most were abandoned by the early 1970s; only one (Ocean Station Mike, at 65°N, 2°E in the Norwegian Sea; e.g., Gammelsrød et al., 1992) remains. The value of those time series is enormous.
Fortunately, for climate purposes, we do not always need rapidly sampled data. In the northwestern Atlantic the annual range of seasonal
temperature is typically 4°C in the upper mixed layer, 1°C at 150m, and 0.1°C or less at 1000 m. Sampling must be frequent enough so as not to be aliased by this cycle. Monitoring deep, “stable” water masses is good strategy.
Combining weather ship data, hydrographic work, particularly that of the CSS Hudson from Bedford Institute of Oceanography, Canada, and more recent moored instrumentation reveals a picture of climate change over the last 30 years that stands out in the 100-year record. There has been a persistent decline in salinity from top to bottom of the subpolar Atlantic Ocean and widespread cooling since 1972 (Figure 2.10) (e.g., Lazier, 1995). Accompanied by a surge of strong, cold winters with winds from the Canadian Arctic (and strongly positive NAO index), convection in the Labrador Sea has penetrated to great depth, yet episodically, during this period. The intense period of Labrador Sea convection produced a great outflow of the water mass, which has been traced along the western boundary of the Atlantic as far as the Antilles (Molinari et al., 1998; Smethie et al., 2000).
The positive values of the AO/NAO-index time series in this period stand out in the 150-year record. Then, suddenly, the cold winters in the northwest Atlantic reverted to an extremely mild state in early 1996. The AO/NAO indices had suddenly reversed, taking on minimums as extreme as anything seen during the century. The ocean has responded quickly, with warm, saline water invading the Labrador Sea to replace the cold, low-salinity water characteristic of intense wintertime forcing. While possible feedback coupling of the atmosphere-ocean system remains to be determined, the direct correspondence of northwest Atlantic deep convection and cold-air outbreaks from Canada is not in doubt.
The increasing supply of fresh water leading to the strong decline in salinity has several possible origins: increased flow of water and ice from the Arctic, decreased flow of saline waters northward in the Gulf Stream/North Atlantic Current system from the subtropical Atlantic, and both the increased hydrologic cycle and ice melt associated with global warming. The resemblance to the freshening seen in coupled global climate models may be misleading, because of the inaccuracy of the AO/NAO modes in many of the models. The enhanced AO/NAO mode actually increased the density and intensity of this intermediate-depth branch of the THC during this period, despite the decline in salinity. Cooling of the subpolar ocean during a general period of global warming is a dynamic negative feedback,
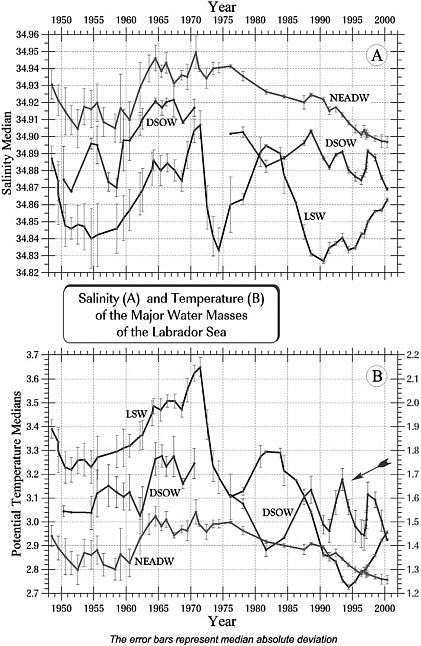
FIGURE 2.10 Variation of salinity (A) and potential temperature (B) with time, at three depths in the Labrador Sea. There is extensive cooling and salinity decline beginning abruptly in 1972, lasting for the last quarter of the 20th Century. The “LSW” (Labrador Sea Water) responds to winter weather locally, while the deeper “NEADW” (Northeast Atlantic Deep Water) and “DSOW” (Denmark Strait Overflow Water) cascade over the sills east of Greenland, and feed the deeper layers of the world ocean. (Courtesy of I. Yashayaev, Bedford Institute of Oceanography.)
which could delay by several decades the predicted slowing of the THC (e.g., Delworth and Mann, 2000).
Numerical simulations suggest that this enhanced production of intermediate-level water (which forms the upper North Atlantic Deep Water) is enough to energize, strongly and quickly, the entire THC of the Atlantic, and its closely correlated meridional heat transport (Häkkinen, 1999; Cheng, 2000). Model simulations allow us to make connections between observable and unobservable quantities, for example the sea-surface elevation field (seen by satellite altimeter), meridional heat transport and meridional volume flux (Häkkinen, submitted). These model simulations emphasize the fast-track response of the intermediate-depth THC during abrupt swings of climate, which may be quite different from changes in the deeper branch of the THC driven by overflows from farther north.
These changes during the instrumental era are in themselves large perturbations of the climate system. Still larger changes have been recorded in paleoclimate data, suggesting that complete shut-down of Labrador Sea deep convection, and its associated contribution to the THC, is possible. Hillaire-Marcel et al. (2001) inferred long periods without Labrador Sea convection during the previous interglacial period. Under a more heavily perturbed, warmer climate, we could see this state recur; learning to recognize its possible onset is a major goal of current research.
North Atlantic Surface Salinity Events
Important events embedded in the longer-term decadal variability of the Atlantic are the “great salinity anomalies,” which seem to involve out-pourings of low-salinity surface water and ice from the Arctic. One of the strongest developed during the late 1960s. The salinity of the upper subpolar Atlantic decreased during a series of mild winters at the same time that intense northerly winds occurred over the Fram Strait. It has been inferred that a great increase in Arctic ice and low-salinity water was driven into the Atlantic, although the influence is controversial. The combined effects of mild winters and buoyant surface layer all but halted deep convection in the Labrador and Irminger Seas. Low-salinity water was tracked as it progressed cyclonically around the high-latitude Atlantic (Dickson et al., 1988) and was seen moving into the Norwegian Sea in 1979; its influence was seen as far south as the Azores. “Lesser” salinity anomalies also appear in the instrumental record (Belkin et al., 1998). Finally, the long overall decrease in the salinity of the upper subpolar Atlantic since 1972 can similarly be at-
tributed to the increasingly positive NAO events whose southerly winds near Europe tend to drive warm, saline Atlantic water into the Arctic (and, by inference, low salinity water back to the Atlantic) (Dickson et al., 2000). Those events provide models for the more intense salinity anomalies of the paleo-record, and perhaps of the near future. Changes in Arctic river runoff and its mixing into the Arctic Ocean may prove to be important (Dickson, 1999; Macdonald et al., 1999; Guay et al., 2001; Ekwurzel et al., 2001).
Arctic Change in the 1990s
The strong interaction between the Arctic and Atlantic Oceans was discussed above. During the recent period of widely varying climate in the subpolar Atlantic, the Arctic has also experienced great change. Exchange between Arctic and Atlantic is a new focus within the larger climate system. The increasing incidence of the positive phase of the AO/NAO appears to have driven warmer, more-saline Atlantic water into the Arctic and pushed back the boundary with fresher, colder waters of Pacific origin (Carmack et al., 1995, Morison et al., 1998). Warming of the polar Atlantic layer has been so striking as to be invoked in possible future melting of the sea ice cover. Attendant thinning of the sea-ice, by about 40 percent, has occurred in the central Arctic, based on comparison of data from 1993 to 1997 with those from 1958 to 1976 (Rothrock et al., 1999), but once again dynamics and greenhouse warming might be interacting or obscuring one another. Arctic ice-cover history is complex, yet full of strong climate signals (e.g., McLaren et al., 1990; Chapman and Walsh, 1993; Yueh and Kwok, 1998; Kwok et al., 1999). The relationship with AO/NAO wind forcing and temperature variability is potentially strong (Rigor et al., submitted). With positive polarity of the AO/NAO, weakening occurs of the typically high atmospheric pressure over the Beaufort Sea, together with intrusion of cyclonic flow related to the Icelandic low pressure center farther north into the Arctic. Moisture transport into the Arctic by this circulation has increased with the AO/NAO index (Dickson et al., 2000).
Antarctic and Southern Ocean Climate Change
Attention has focused on changes in the Arctic, but concern remains that this amounts to looking under the street light, missing other high-latitude sites that are less well observed. Southern Ocean overturning has two
modes: through open ocean convection in polynyas (areas of open water that are surrounded by sea ice), in geographically suitable semi-enclosed seas (Ross and Weddell Seas), along the shelf of Australia, and driven by plumes of dense water descending from the shallow Antarctic shelf and slope, and interacting strongly with the overlying permanent ice. In contrast with the North Atlantic, the overturning that feeds the deepest waters is fed by cool mid-depth waters that first upwell near the Antarctic Circumpolar Current. Thus, the total heat transport associated with formation of dense waters in the Antarctic is not as dominant a part of the global heat budget as is the heat transport associated with the North Atlantic THC. However, variations in Antarctic overturning, and possibly surface warming, can affect freshwater budgets, as evidenced in large-scale freshening in the lower latitude oceans of the Southern Hemisphere (Wong et al., 1999; Johnson and Orsi, 1997). Both intermediate-depth and deeper branches of the THC form complex arteries of sinking and recirculating in the Southern Ocean (e.g., Orsi et al., 1999); both are important to the time-constants of response of the global ocean to abrupt change.
The possible alteration of northern and southern sinking in the global THC, known as the see-saw, arises from model simulations (Stocker et al., 1992; Crowley, 1992) and from comparison of climate anomalies in Greenland and Antarctic ice-core records (e.g., Blunier and Brook, 2001; see Plate 2). Instrumental data are scarce, but the inventory of CFC and other transient tracers can be interpreted to suggest a recent weakening of sinking around Antarctica, in comparison with the longer-term signal seen in steady-state tracers related to nutrients and dissolved oxygen (Broecker, 1999). A suggested link is proposed between this oceanic behavior and the Little Ice Age, one of the major climate events of the past 1,000 years in the northern hemisphere.
Identifying global connections in the climate system is a particularly important goal of modern observations. Toggweiler and Samuels (1995) have found that, using global ocean models, the THC is sensitive to forcing by westerly winds in the Southern Ocean (particularly those near the relatively narrow Drake Passage, south of South America). In their simulations the THC volume transport, as far north as the subpolar Atlantic, shifted in response to changes in this distant wind forcing.
In 1972, a large hole opened in the ice cover of the Weddell Sea. This polynya lasted until 1974, and its progress was tracked by the early Nimbus satellites. The polynya was supported by the breakdown of the usual stratification leading to open-ocean convection (Gordon and Comiso, 1988).
Elimination of the relative buoyancy of low-salinity upper waters allowed deep heat to be brought to the surface (so that the polynya can be selfsustaining; Martinson et al., 1981). The event left its mark on the ocean with anomalous cold, low-salinity deep water, which found its way into the deep circulation, as witnessed in the Argentine Basin farther north.
Global Ocean Heat Content
The archive of hydrographic data from throughout the world ocean gives us an instrumental record of climate change that integrates over time and space: the ocean dominates (by a factor of about 103) the heat capacity of the ocean-atmosphere system, and its storage of heat anomalies also greatly exceeds the land surface. Levitus et al. (1999) (also see Levitus et al., 2001 and Barnett et al., 2001) described the integrated ocean heat content from 1950 to 2000 (Figure 2.11). In every ocean, an overall warming during the last 50 years is evident. But in a hiatus 1978–1988, all the ocean basins other than the South Atlantic cooled substantially. The temporary cooling in Pacific and Indian Oceans (both north and south) amounted to about half the net rise (2 × 10²³J) over the 50 years. The abrupt cooling is mostly in the top 300 m of the water column. The anomalous air-sea heat flux during the event averaged about 1 watt m–2 which is several times as large as the half-century-long warming (0.31 watt m–2). The cooling event fails to resemble the well-known dip in atmospheric surface temperatures between roughly 1940 and 1970 in timing or duration. Heat is mercurial, and global budgets like this can be surprisingly responsive to localized forcing. Possible contributors to the downward lurches are the eruptions of the volcanoes Agung in 1963, El Chichon in 1982, and Pinatubo in 1991 (Levitus, 2001).
Couplings
Instrumental records show preferred modes of behavior of the earth’s climate system. Furthermore, those modes might be coupled not only in time (such as the unknown relation between the few-year ENSO and fewdecade PDO variability), but also in space. Although the principal modes of variability at high latitude (the AO/NAO, and related southern hemisphere annular mode) have some independence from ENSO, connections have been proposed. For example, Hoerling et al. (2001) suggested, comparing observations and coupled-model simulations, that the average tropi-
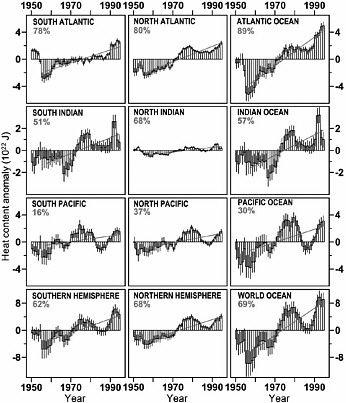
FIGURE 2.11 Time series for the period 1948 to 1998 of ocean heat content (1022J) in the upper 300 m for the Atlantic, Indian, Pacific, and world oceans. Note that 1.5 × 10²²J equals 1 W•year•m–2 (averaged over the entire surface of earth). Vertical lines through each yearly estimate represent ±1 standard error (SE) of the estimate of heat content. (SOURCE: Levitus et al., 1999.)
cal warming since 1950 is a cause of enhanced AO/NAO activity in the North Atlantic. This constitutes one pathway from anthropogenic forcing to high latitudes, and another comes via the stratosphere. Intensification of the stratospheric wintertime polar vortex under greenhouse-gas forcing has been a major prediction of models (e.g., Shindell et al., 2001). The AO/NAO is a mode of variability that grows more symmetric but no less energetic as one moves upward from troposphere to stratosphere (Perlwitz and Graf, 1995). Baldwin and Dunkerton (1999) demonstrated downward phase propagation of intense stratospheric anomalies. The possible intensification of the AO/NAO beneath an enhanced polar vortex is being investigated with models and observations (Shindell et al., 2001). Yet, crucial
internal linkages, particularly the decadal shifts in Rossby wave propagation upward from the troposphere, still need to be established.
ENSO has great reach, and can influence climate at high southern latitudes. A potentially important climate mode, the Antarctic Circumpolar Wave, involves the coupled ocean and atmosphere near the polar front, in the Southern Ocean (White and Peterson, 1996). This wavenumber-2 dislocation of the polar front propagates eastward at about 0.08 m. sec-1, thus taking 8 to 10 years to circumnavigate that ocean. The mode appears to be strongly excited by tropical ENSO events. At a much shorter timescale, blocking patterns in the strong westerly circulation in the southeast Pacific appear to be forced by ocean warming and divergence in the western tropical Pacific (Renwick and Revell, 1999). Couplings of this kind are achieved by Rossby-wave propagation.
The modal behavior of earth’s climate is one of the major research results of the instrumental era. This review emphasizes these modes as well as describing recent examples of such regional changes as the Dust Bowl and North Atlantic oceanic conditions that were abrupt and impacted humans and ecosystems. The connection stems from the possibility that climate can lock into one phase or another of a modal oscillation; for example, preferring the warm equatorial Pacific phase of ENSO. Possible interactions among the major climate-system modes (especially ENSO and the high-latitude annular modes) suggest that changes in one could be propagated globally. The major perturbations associated with greenhouse-induced climate change may affect the likelihood of such changes, and their geographic extent.
SYNOPSIS OF OBSERVATIONS
A great wealth of evidence related to abrupt climate change has been collected, although important data gaps remain. Interpretation of sedimentary records to learn about past climate changes is improving rapidly. The unequivocal evidence of repeated large, widespread, abrupt climate changes in the past is striking. Such events were especially prominent during the cooling into and warming out of the most recent global ice age. However, the events are not restricted to cold times as shown by the cooling about 8,200 years ago, which punctuated conditions that in many places were similar to or even slightly warmer than recently. Other events during the current Holocene warm time may not have been as globally dramatic as the
ice-age changes, but regional effects on water availability may have had large effects on humans and ecosystems.
Documentation of past abrupt climate changes is quite good in certain regions such as from Greenland ice cores and some of the pollen and other records summarized above. But no reliable global maps of climate anomalies are available for any of the abrupt changes of the past. Well-dated records with high time resolution are especially scarce in the Pacific, the tropics, and southern high latitudes, but no ideal record yet exists and additional useful information can be obtained almost everywhere. Past changes in the hydrological cycle are especially poorly characterized relative to its importance to humans and ecosystems.
The unavoidable incompleteness of the sedimentary record (spatially, temporally, and in variables recorded) means that changes from before the deployment of widespread instrumentation will never be understood as well as more recent changes. Instruments have not yet observed any of the large, global abrupt climate changes (a statement that some day may require modification in hindsight with respect to human-induced changes). However, regional events that satisfy the definition of abrupt climate change have been observed instrumentally. These are important in several ways: among others, they highlight observations required to characterize events and provide early warning of event onset and termination; they point to gaps in the observational system; and, they show the important role of coupled modes in such changes (and, by inference, perhaps also in the larger changes further in the past).
Instrumental study of abrupt changes has drawn on a broad-based range of observations collected for many purposes. However, few of these data sets are targeted on those parts of the climate system that are believed to have participated in past abrupt changes or that are likely to exhibit abrupt and persistent changes when thresholds in the climate system are crossed. Documentation remains sketchy of ocean circulation, especially in regions of deepwater formation, and interactions with sea-ice processes and with freshwater fluxes from the atmosphere and from land hydrology including glaciers and permafrost. Gaps also remain in documentation of land-surface processes linked to hydrology, and of modal behavior of the coupled climate system.
Much work is required to place all of the available observations into a coherent framework, capable of assimilating new observational data and contributing to an understanding of abrupt climate change. A start on such a framework is described in the next section.
Innovative instrumental methods have been developed that offer us hope of detecting abrupt climate change when it appears. These include both new in situ probes for atmosphere and ocean and remote sensing from satellites. New sensors (for chemical and biological fields as well as physical quantities) and new platforms (moored, drifting, gliding or profiling) are becoming available in large numbers. They provide efficient coverage globally and locally, at lower cost than classical observation methods. In reviewing the abrupt changes seen during the instrumental period, it is obvious how much more would now be understood if just a few well-placed modern instruments had been in place for an extended time.
For abrupt climate change, special emphasis on the dynamics of freshwater in both atmosphere and ocean is needed. Evaporation, precipitation, river flow, surface moisture, cryosphere dynamics, and related upper ocean dynamics are all relatively poorly observed, yet they are as important to climate as are the better observed thermodynamic fields. Cloud and water vapor dynamics in the atmosphere are crucial to climate, yet their representation in coupled numerical models is crude.
Models that are heavily involved in predicting or diagnosing abrupt climate change are known to be inaccurate in representing various high-latitude oceanic processes. Among them are deep convection, sinking and overflow dynamics, flow through narrow passages, over sills and in the descending branch of the oceanic overturning circulation, sea-ice dynamics, and flow and thermodynamics of shallow shelf regions at high latitude. Discrimination between sinking in the Labrador Sea and sinking farther north, with overflow at the Greenland-Scotland ridge system, is not well handled by such models.
For these reasons, sustained observations of the high-latitude ocean and its communication with the Arctic are needed. Hydrographic and chemical-tracer observations must be repeated, quasi-regularly, across important passages and major “stable” water masses. Direct observations of ocean circulation intensity using both in situ and satellite altimetric observations are particularly valuable for inferring meridional overturning variability.
Satellite scatterometer wind fields give us a component of global air/sea interaction with remarkable resolution. Passive radiometric observations give us a wealth of temperature, sea-surface structure and moisture data, and possibly new fields such as surface salinity. Synthetic aperture radar observations from satellites provide high resolution detail of ice fields, upper ocean flows, winds and terrestrial flooding and drainage-basin flows.
Tropical ocean observations near the sea-surface currently provide cov-
erage of the pace of ENSO activity, and its connections with higher latitude. Fixed arrays, which have revealed so much about the Pacific, could be extended to Indian and Atlantic oceans, at least in skeletal form.
The ocean near the coasts is a particularly sensitive and biologically productive region. Considering the close proximity of so many humans, it is surprising how poor the instrumental record is. As natural variability is overlaid on human-induced changes of many kinds, there is a lack of baseline observations for comparison. Our definition of climate and its impacts is expanding to include ecosystems and human activity, and in this spirit there are many more observations to be made, particularly aiming at biological fields. Regular coastal observational programs are hampered by overlapping jurisdictions and variable commitment to basic scientific questions. River systems are intimately connected with estuaries, and human modification again compounds natural climate variability of streamflow, water quality, and drainage patterns. Support for sustained observations in both coastal regions and watersheds should be of high priority.


