
Page 107
6
Population and Land Use in Haryana
Prem S. Vashishtha
Agricultural Economics Research Centre, University of Delhi
R. K. Sharma
Agricultural Economics Research Centre, University of Delhi
R. P. S. Malik
Agricultural Economics Research Centre, University of Delhi
Seema Bathla
Institute of Economic Growth, Delhi
Scientists and policymakers are concerned about the world's growing population. For them, two key issues are food security—the ability of nations to feed their growing numbers of citizens—and the sustainability of agricultural systems in the face of intensified cultivation, the rising use of chemical inputs, and the increasing pressure on already scarce water resources. Because the relationships among population growth, land use, and sustainability of resources are complex, exploration of these relationships must depend on detailed, region-specific studies and cross-regional comparisons.
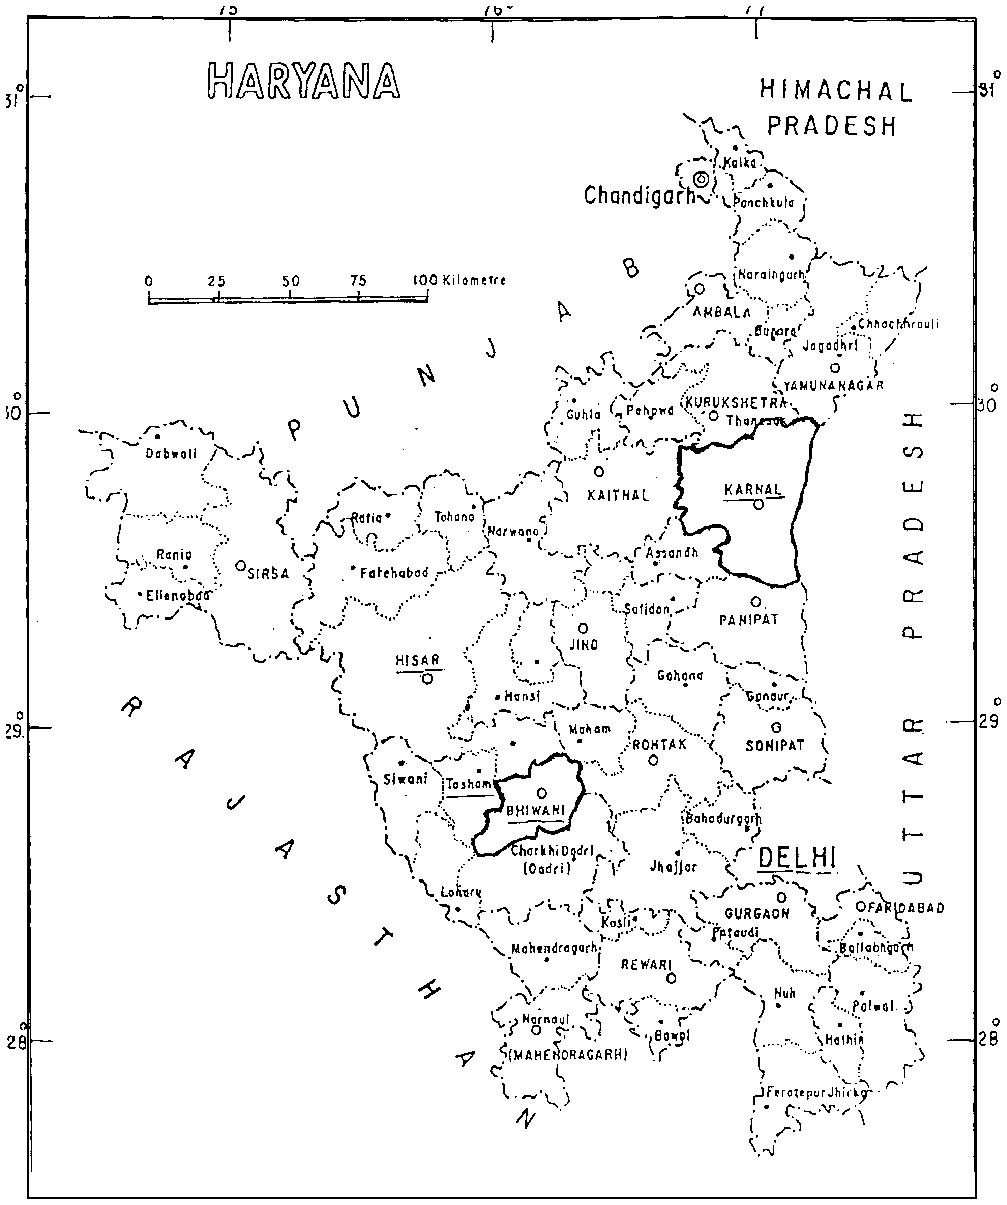
This study examines the relationships among land use, population growth, and consumption in Haryana, a landlocked state in northwest India. It borders on the states of Uttar Pradesh in the east, Himachal Pradesh in the northeast, Punjab in the north, and Rajasthan in the west, and the territory of Delhi in the south ( Figure 6-1). With a geographical area of 44,212 square kilometers and a population of 16.5 million in 1991, Haryana constitutes 1.3 percent of India's geographical area and 1.9 percent of its population. The capital of Haryana, Chandigarh, is shared by the neighboring state of Punjab.
Except for some low hills in the north and south, Haryana is flat. The state has no perennial river except for the Yamuna, which flows along its eastern side. Haryana has a subtropical monsoon climate with meager, aberrant rains, hot summers with excessive sunshine and intense heat, and cold winters. The minimum temperature in January is 1°C, and the maximum in the summer months is 48°C. The average annual rainfall varies across districts, from a minimum of 42 centimeters in Hissar to a
Page 108
~ enlarge ~
FIGURE 6-1 Districts of Haryana.
maximum of 156 centimeters in the district of Ambala. The average annual rainfall is 59 centimeters.
Based on its agroclimatic conditions, Haryana can be divided into two homogeneous regions: the eastern semiarid zone and the western arid zone. These regions show marked differences in patterns of land use, especially in the agricultural sector, and in levels of development. Intensity of land use in the two regions does not differ significantly, yet agriculture in the semiarid region is dominated by the cultivation of high-yielding, high-value crops such as rice and wheat, which accounted for 58.3 percent of the gross cropped area in 1991–1992. By contrast, in the same year a large proportion of the cropped area (63.4 percent) in the arid zone was allocated to lower-yielding, lower-value crops such as bajra (millet), pulses, oilseeds, and cotton.1 As a result, the per-hectare quantity and value of output in the two regions differ significantly.
1This contrast was even sharper in 1971–1972 when bajra (millet), pulses, oilseeds, and cotton together occupied 72.6 percent of gross cropped area in the arid zone and 34.2 percent in the semiarid zone. Rice and wheat together accounted for only 12.6 percent and 40.2 percent of gross cropped area in the arid and semiarid zones, respectively.
Page 109
Haryana has well-developed agricultural and industrial sectors, and its economy is growing rapidly—per capita income is the third highest among the sixteen major states in India. Haryana's outstanding agricultural development has been attributed primarily to the Green Revolution. Initiated over the period 1967–1978, it resulted in the intensification and expansion of agriculture in many developing countries and was very successful in India. Major aspects of the Green Revolution were the expansion of farmland and the adoption of double-cropping systems (two crop seasons per year) and seeds that had been improved genetically—that is, high-yielding varieties (HYV) of wheat, rice, corn, and millet. These practices continue to shape land use in Haryana today.
This study examines changes in land use in the arid and semiarid agroecological regions of Haryana and the extent to which such changes are consistent with the goals of sustainable development. More specifically, it explores land use patterns in the context of the roles of population, technology, prices, and public policies, and analyzes the ecological consequences, particularly on water resources, of the intensification of agriculture. This study also examines socioeconomic indicators to determine whether the success brought by advanced agricultural technology has been translated into social benefits. Finally, it looks at the role of Haryana in providing food security for the nation, contrasting the demand for agricultural commodities for local consumption with the demand from markets outside the region.
HARYANA: A DEMOGRAPHIC PROFILE
Two important forces driving changes in land use in Haryana are the size and growth rate of its population. These forces and their relationship to migration, land availability, and urbanization are examined in this section.
Population
Haryana experienced a low population growth rate throughout the first half of the twentieth century, but it is currently contributing to India's population expansion by an annual growth rate of 2.5 percent. In fact, Haryana is one of the fastest-growing states in India, despite its relatively high per capita income and commendable economic progress ( Table 6-1). In 1991 Haryana's total population was 16.5 million, or about 2 percent of India's 850 million people. The population of Haryana tripled over the period 1951–1991, from 5.6 million to 16.5 million. Although the annual
Page 110
|
Population Size (thousands) |
Annual Growth Rate (percent) |
||||||
|
State |
1901 |
1951 |
1971 |
1991 |
1901–1951 |
1951–1971 |
1971–1991 |
|
Bihar |
27,311 |
38,782 |
50,719 |
75,021 |
0.70 |
1.34 |
1.96 |
|
Haryana |
4,623 |
5,674 |
10,036 |
16,464 |
0.41 |
2.85 |
2.47 |
|
Kerala |
6,396 |
13,549 |
21,347 |
29,099 |
1.50 |
2.27 |
1.55 |
|
Punjab |
7,545 |
9,161 |
13,551 |
20,282 |
0.39 |
1.96 |
2.02 |
|
Tamil Nadu |
19,253 |
30,119 |
41,199 |
55,859 |
0.89 |
1.57 |
1.52 |
|
Uttar Pradesh |
48,628 |
63,220 |
88,342 |
139,112 |
0.52 |
1.67 |
2.27 |
|
India |
238,396 |
361,088 |
548,160 |
846,303 |
0.83 |
2.09 |
2.17 |
SOURCE: Srinivasan, K., ed. 1996. Population Policy and Reproductive Health. New Delhi: Population Foundation of India.
growth rate has declined from 2.85 percent for the period 1951–1971 to 2.47 percent for the period 1971–1991, the latter growth rate is still much greater than the national annual growth rate of 2.17 percent for the same period. The rapid decline in mortality in the last half-century is commonly ascribed to improvements in nutrition and sanitation in some urban areas and better health care.
Haryana's crude annual birth rate for the period 1991–1996 was 31.9 per thousand persons compared with 29.2 for India ( Table 6-2). Its death rate for the same period was 8.6 per thousand persons, which is lower than the national average of 9.8. Combining these rates results in a natural growth rate for 1991–1996 of 23.3 per thousand persons for Haryana compared with 19.4 for India.
Life expectancy at birth in Haryana is 59.5 years for females, 61.5 years for males. The state ranks third among the major states in life expectancy for males, after Kerala (65.9 years) and Punjab (63 years). Its life expectancy for females, however, is unimpressive; Haryana ranks eighth among the major states.
The increase in population has led to greater population density, because the land area remains unchanged. The population density of Haryana rose from 227 persons per square kilometer in 1971 to 372 in 1991, an increase of 64 percent. This density is much higher than the 1991 national average of 257 persons per square kilometer. Although the rate of increase of population density has been declining since the 1950s, it is projected to rise in the twenty-first century—to as high as 455 persons per square kilometer in the year 2001 and 530 by the year 2011 ( Table 6-3). Such high densities, in spite of the decline in population growth rates witnessed in recent years, stem from the high population growth main-
Page 111
|
Year |
Crude Birth Rate (number of live births per thousand persons) (1) |
Crude Death Rate (number of deaths per thousand persons) (2) |
Natural Growth Rate (increase per thousand persons) (3) = (1) − (2) |
|
Haryana |
|||
|
1951–1961 |
— |
— |
— |
|
1961–1971 |
44.00 |
16.90 |
27.10 |
|
1971–1981 |
42.10 |
9.90 |
32.20 |
|
1981–1991 |
36.50 |
11.30 |
25.20 |
|
1991–1996 |
31.90 |
8.60 |
23.30 |
|
1996–2001 |
24.00 |
7.75 |
16.25 |
|
2001–2006 |
22.75 |
7.09 |
15.66 |
|
2006–2011 |
21.98 |
6.90 |
15.09 |
|
2011–2016 |
21.01 |
6.85 |
14.15 |
|
India |
|||
|
1951–1961 |
41.70 |
22.80 |
18.90 |
|
1961–1971 |
41.20 |
19.00 |
22.20 |
|
1971–1981 |
36.90 |
17.70 |
19.20 |
|
1981–1991 |
33.90 |
12.60 |
21.30 |
|
1991–1996 |
29.20 |
9.80 |
19.40 |
|
1996–2001 |
24.10 |
8.99 |
15.11 |
|
2001–2006 |
22.84 |
8.27 |
14.57 |
|
2006–2011 |
22.27 |
7.80 |
14.48 |
|
2011–2016 |
21.41 |
7.48 |
13.94 |
NOTE: State-level estimates of crude birth rate and crude death rate for 1951 were unavailable.
SOURCES: All figures for 1971–1991: Nutrition Foundation of India. 1992–1993. National Family Health Survey-Haryana. New Delhi: Nutrition Foundation of India; all figures for 1996–2016: Population Projections—India and the States, 1996–2016, Census of India, 1991; 1951 and 1961 crude birth and death rates for India: Pathak, K. B. 1996. Fertility and mortality transition in India: Policy perspectives and priorities. In: Population Policy and Reproductive Health, K. Srinivasan, ed. New Delhi: Population Foundation of India.
tained in earlier decades. Therefore, the pace at which population pressures on the land are increasing is a matter of great concern.
Migration, Land Availability, and Urbanization
Migration is an important component of Haryana's demographic character. According to the census of India, the number of in-migrants to Haryana was 1.26 million in 1971, 1.51 million in 1981, and 1.84 million in 1991, for a compound growth rate of 1.90 percent a year ( Table 6-4). In-migrant workers in the categories of cultivators and agricultural wage
Page 112
|
Haryana |
India |
|||||
|
Year |
Population Density (number of persons per square kilometer) |
Change in Population Density (percent) |
Compound Annual Growth Rate of Population Density (percent) |
Population Density (number of persons per square kilometer) |
Change in Population Density (percent) |
Compound Annual Growth Rate of Population Density (percent) |
|
1951 |
128 |
111 |
||||
|
1961 |
172 |
34.17 |
2.98 |
134 |
21.41 |
1.96 |
|
1971 |
227 |
31.73 |
2.79 |
167 |
24.10 |
2.18 |
|
1981 |
292 |
28.78 |
2.56 |
208 |
25.02 |
2.26 |
|
1991 |
372 |
27.40 |
2.45 |
257 |
23.51 |
2.13 |
|
1996 |
420 |
12.69 |
2.42 |
284 |
10.39 |
2.00 |
|
2001 |
455 |
8.45 |
1.63 |
308 |
8.37 |
1.62 |
|
2011 |
530 |
16.56 |
1.54 |
359 |
16.45 |
1.53 |
SOURCES: Figures for 1996, 2001, and 2011: Population Projections—India and the States, 1996–2016 and Census of India, 1991. Other figures:Statistical Abstract of India (various issues).
Page 113
|
All (workers + nonworkers) |
Workers |
Cultivators |
Agricultural Laborers |
|
|
1971 |
||||
|
Haryana |
1,261,140 |
519,145 |
110,880 |
50,715 |
|
Arid region |
370,005 |
148,125 |
45,295 |
25,535 |
|
Semiarid region |
891,135 |
371,020 |
65,585 |
25,180 |
|
Central tract |
498,980 |
222,745 |
51,310 |
18,285 |
|
Southern tract |
392,155 |
148,275 |
14,275 |
6,895 |
|
1991 |
||||
|
Haryana |
1,835,796 |
564,533 |
81,851 |
54,927 |
|
Arid region |
510,941 |
131,752 |
39,326 |
25,351 |
|
Semiarid region |
1,324,855 |
432,781 |
42,525 |
29,576 |
|
Central tract |
746,488 |
236,982 |
29,700 |
20,507 |
|
Southern tract |
578,367 |
195,799 |
12,825 |
9,069 |
|
Compound Annual Growth Rate: 1971–1991(percent per annum) |
||||
|
Haryana |
1.90 |
0.42 |
−1.51 |
0.40 |
|
Arid region |
1.63 |
−0.58 |
−0.70 |
−0.04 |
|
Semiarid region |
2.00 |
0.77 |
−2.14 |
0.81 |
|
Central tract |
2.03 |
0.31 |
−2.70 |
0.58 |
|
Southern tract |
1.96 |
1.40 |
−0.53 |
1.38 |
aRefers to people residing in Haryana whose last place of residence was outside Haryana (all durations)—that is, in-migration is net of migration across districts within Haryana.
SOURCE: Prepared by the author based on data from: Census of India 1971, Haryana, Series 6-Haryana, Part II-D, Migration Tables; Census of India 1991, Haryana, Series 6-Haryana, Part II-D, Vol. 1, Migration Tables.
earners grew at a rate of −1.51 percent and 0.40 percent a year, respectively, over the period 1971–1991. Overall, in-migrants account for 12.57 percent and 11.15 percent of Haryana's population in 1971 and 1991, respectively ( Table 6-5).
The employment of a substantial proportion (24–31 percent) of inmigrants in cultivation and agricultural wage earning has contributed to a decline in net sown area per capita, thereby increasing the population pressure on land for the livelihood of the rural population. For the period 1971–1991, the net sown area per primary sector worker declined from 2.99 hectares to 2.03 hectares, and the decline in net sown area per capita of rural population was even greater—from 0.43 hectares to 0.29 hectares
Page 114
|
Indicator |
Unit |
1971 |
1991 |
Absolute Change, 1971–1991 |
|
Population |
number |
10,036,808 |
16,463,648 |
6,426,840 |
|
Rural |
number |
8,263,849 |
12,408,904 |
4,145,055 |
|
Urban |
number |
1,772,959 |
4,054,744 |
2,281,785 |
|
Share in total population |
||||
|
Rural |
percent |
82.34 |
75.37 |
−6.96 |
|
Urban |
percent |
17.66 |
24.63 |
6.96 |
|
Workers in total population engaged as |
||||
|
Cultivators |
number |
1,302,608 |
1,829,530 |
526,922 |
|
Agricultural laborers |
number |
430,312 |
896,782 |
466,470 |
|
Net sown area (NSA) |
thousand hectares |
3,565.40 |
3,575.00 |
9.60 |
|
Landholdings |
number |
998,704 |
1,529,779 |
531,075 |
|
Households |
number |
1,530,180 |
2,614,725 |
1,084,545 |
|
Rural |
number |
1,222,415 |
1,882,390 |
659,975 |
|
Urban |
number |
307,765 |
732,335 |
424,570 |
|
NSA per rural population |
hectares |
0.43 |
0.29 |
−0.14 |
|
NSA per primary sector worker |
hectares |
2.99 |
2.03 |
−0.96 |
|
NSA per landholding |
hectares |
3.57 |
2.34 |
−1.23 |
|
NSA per rural household |
hectares |
2.92 |
1.90 |
−1.02 |
|
In-migrant a population |
number |
1,261,140 |
1,835,796 |
574,656 |
|
Share of in-migrants a in total population |
percent |
12.57 |
11.15 |
−1.42 |
|
Share of in-migrant a workers engaged as |
||||
|
Cultivators |
percent |
21.36 |
14.50 |
−6.86 |
|
Agricultural laborers |
percent |
9.77 |
9.73 |
−0.04 |
|
Household industry workers |
percent |
2.62 |
1.69 |
−0.93 |
aRefers to people residing in Haryana whose place of last residence was outside Haryana (all durations)—that is, in-migration is net of migration across districts within Haryana.
SOURCES: (1) Census of India, 1971 & 1991, Series VI, Part II-D, Migration Tables, Haryana for migrant population data; (2) Census of India, 1971 & 1991, Series VI Part V-A & B, Vol.1, General Economic Tables, Haryana; (3) Statistical Abstract of Haryana (various issues) for rural and urban population, net sown area, landholding, and household data; (4) the rest of the figures were generated by the auther from these categories.
( Table 6-5). In addition, the number of landholdings increased at the rate of 2.15 percent a year, resulting in net sown area per rural landholding declining from 3.57 hectares to 2.34 hectares, a decline of 2.10 percent a year.
Haryana, with only one-fourth of its population residing in urban areas, is less urbanized than many developed states of India. However, urbanization is on the rise: the urban population, which constituted
Page 115
approximately 10 percent of the net population before 1951, had grown to 18 percent by 1971 and 25 percent by 1991 ( Table 6-5). The increasing rate of urbanization is clearly revealed by the difference in the growth rates of the rural and urban populations. Between 1971 and 1991 the urban population of Haryana grew at an average rate of 4.22 percent a year, while the rural population grew at an average rate of 2.05 percent a year.
The urban density of Haryana in 1991, at 5,309 persons per square kilometer, was greater than that in almost all states of India. From 1981 to 1991 urban density increased by 40 percent. According to the 1991 census, approximately 60 percent of Haryana's urban population is concentrated in metropolitan areas with populations equal to or above 100,000. Nearly 40 percent of the rural population is concentrated in villages with populations under 5,000.
CHANGES IN LAND USE
This section describes the history of agricultural development in Haryana since 1950, reports the results of a state-level analysis of changes in land use, examines how cropping patterns have changed over time, and compares the practices and effects of the Green Revolution in the two major agroecological regions of the state.2
Agricultural Development of Haryana since 1950: Five Phases
Haryana is primarily an agricultural region; more than 80 percent of its area is classified as net sown area. Since 1950 agriculture has been the main driver of the state's economic development. Haryana's agricultural development can be broken down into five phases that will help to illuminate changes in the state's land use patterns.
-
Phase I (1951–1966): Population Pressure and Extensive Cultivation. Although Haryana's population grew slowly during the first half of the twentieth century (0.41 percent a year), population pressure began to intensify after 1950; from 1951 to 1966 the population increased at a rate of 2.85 percent a year. Agriculturally, this phase was characterized by extensive cultivation, facilitated by the more widespread use of irrigation through the canal system. Increased population pressures led to expansion of the net sown area—from 3 million hectares in 1950 to 3.4 million in 1960—primarily to meet the food requirements of the fast-growing population ( Table 6-6).
2For land use data on major regions in the area, see J. F. Richards et al. 1994. Historic Use and Carbon Estimates for South and Southeast Asia, 1880–1980. Environmental Sciences Division Publ. No. 4174. ORNL/CDIAC-61 NDP-046, Oak Ridge National Laboratory.
Page 116
|
Indicator |
Unit |
1950 |
1960 |
1966 |
1971 |
1981 |
1991 |
1996 |
|
Gross irrigated area (GIA) |
thousand hectares |
657 |
1,205 |
1,736 |
2,200 |
3,500 |
4,340 |
4,673 |
|
Gross cropped area (GCA) |
thousand hectares |
3,470 |
4,583 |
4,599 |
5,000 |
5,800 |
5,600 |
5,976 |
|
GIA as percentage of GCA |
percent |
18.93 |
26.29 |
37.75 |
44.00 |
60.34 |
77.50 |
78.20 |
|
Net irrigated area (NIA) |
thousand hectares |
n.a. |
1,007 |
1,293 |
1,565 |
2,248 |
2,666 |
2,760 |
|
Net sown area (NSA) |
thousand hectares |
2,982 |
3,400 |
3,422 |
3,600 |
3,700 |
3,500 |
3,586 |
|
NIA as percentage of NSA |
percent |
n.a. |
29.62 |
37.80 |
43.47 |
60.76 |
76.17 |
76.97 |
|
Cropping intensity |
percent |
116.36 |
134.79 |
134.40 |
138.89 |
156.76 |
160.00 |
166.64 |
|
Area under high-yielding varieties of: |
||||||||
|
Rice |
thousand hectares |
70 |
441 |
475 |
498 |
|||
|
percent |
24 |
87 |
75 |
60 |
||||
|
Wheat |
thousand hectares |
796 |
1,437 |
1,760 |
1,863 |
|||
|
percent |
68 |
92 |
98 |
95 |
SOURCE: Statistical Abstract of Haryana (various issues).
Page 117
With the adoption of the double-cropping system, cropping intensity increased from 116 percent in 1950 to 135 percent in 1960. Public investments in canal irrigation systems also played an important role in creating favorable physical conditions for the intensification of agriculture. The net irrigated area, as a percentage of net sown area, increased from 30 percent in 1960 to 38 percent in 1966 ( Table 6-6). During this early phase, canals irrigated most of the net irrigated area; wells irrigated a smaller portion.
-
Phase II (1966–1971): Spread of the Green Revolution. After India faced a severe food crisis in the mid-1960s, the issue of food security assumed utmost priority. The national government implemented measures to facilitate the adoption of the new Green Revolution technology and to procure food from surplus areas such as Haryana, Punjab, and western Uttar Pradesh.3 Diffusion of Green Revolution technology was facilitated by the creation of infrastructure, including private investment in irrigation sources, and government regulation of wheat prices.
These activities benefited the economy of Haryana. The government expedited creation of the necessary infrastructure by increasing the number of regulated markets and opening branches of commercial banks outside large towns. Surplus supplies of wheat were sold mainly to public procurement agencies, and any remaining was sold in the open markets. Government intervention in the food market ensured that producers would receive fair prices and prevented wheat prices from crashing at the regional level.
During this phase the Green Revolution played a prominent role in land use change in Haryana. With the implementation of Green Revolution technology and the introduction of the high-yielding crop varieties over the period 1966–1971, the net sown area expanded by 5 percent and the irrigated area by 21 percent ( Table 6-6).
-
Phase III (1971–1981): Consolidation of the Wheat Revolution and Beginning of the Rice–Wheat Rotation. Three aspects of this phase are noteworthy. First, the area allotted for rice cultivation increased throughout Haryana—from 291,000 hectares in 1971 to about 505,000 hectares in 1981 ( Table 6-7). Second, groundwater exploitation began in both the semiarid and arid regions, and the number of tube wells rose. Third, with continuation of the price support system for wheat and rice, the rice-wheat crop rotation became a lucrative proposition for the farmers.
-
Phase IV (1981–1991): Intensive Cultivation and Depletion of Natural Resources. In the 1980s new environmental problems emerged in agriculture, including those related to groundwater depletion and soil degradation.
3In 1971 government agencies procured 709,000 tonnes of wheat from Haryana, or 29.5 percent of Haryana's wheat production and 13.9 percent of the total wheat procured at the national level.
Page 118
Tanwar (1994) has pointed out that during the 1980s about 60 percent of the area of Haryana faced a declining water table. Thus overutilization of groundwater was a major concern. The decline was more conspicuous in areas where freshwater was available (approximately 40 percent of the land area of the state). Almost 50 percent of the state area depended on groundwater that was marginal in quality; 9 percent depended on water that was brackish (Tanwar, 1995).
-
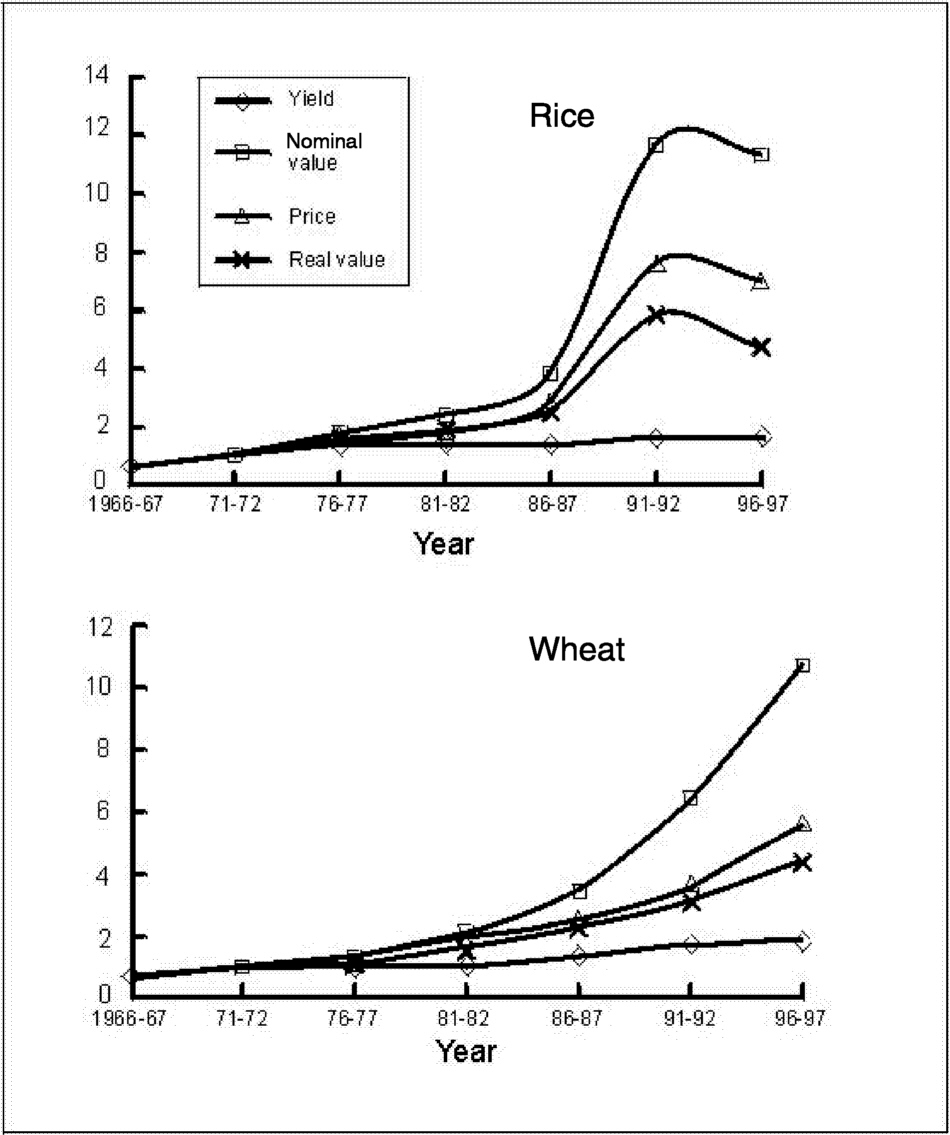
Phase V (1991–1997): Stagnating Yield Levels and Depletion of Natural Resources. During the 1990s the highly intensive cultivation in Haryana began to face a crisis situation. The yields of major cereal crops were either stagnating or declining, and little increase in the rice yield had been observed since 1991 ( Figure 6-2). Although the value of wheat per hectare continued to increase in the 1990s, the value of rice per hectare showed a decline over the same period ( Figure 6-2). Both agricultural scientists and policymakers became very concerned about the situation (ICAR, 1998).
|
Rice |
Wheat |
Bajra (Millet) |
|||||||
|
1971 |
1981 |
1991 |
1971 |
1981 |
1991 |
1971 |
1981 |
1991 |
|
|
Area undercrop (thousand hectares) |
291 |
504.6 |
637 |
1,117 |
1,561.9 |
1,805.8 |
882.1 |
851.9 |
556.6 |
|
Percent of gross cropped area |
5.8 |
8.7 |
11.4 |
23.3 |
26.8 |
32.4 |
17.5 |
14.6 |
10 |
Another concern is soil degradation. According to the National Bureau of Soil Survey and Land Use Planning (NBSS&LUP), which classifies soil by its physical and chemical degradation, one-third of the land area of Haryana has degraded soil, of which 23 percent suffers from medium-level degradation and 5 percent from high-level degradation ( Table 6-8). Chemical degradation, probably from the excessive use of chemical fertilizers and pesticides, accounts for 6 percent of soil degradation.
State-level Analysis
The Statistical Abstract of Haryana describes five broad land use categories: (1) forest; (2) land not available for cultivation; (3) other uncultivated land, excluding fallow; (4) fallow land; and (5) net sown area ( Table 6-9). These categories are cumulatively referred to as the “reported area.”
Net sown area has remained static at 81 percent of total area since 1971, indicating that the potential for expansion of cultivation was al-
Page 119
~ enlarge ~
FIGURE 6-2 Indices of yield, value, and price of rice and wheat, 1966–1997. NOTE: Nominal value (rupees/hectare at current prices) is computed from yield and price and converted to “real value” (rupees/hectare at constant 1981–1982 prices) using NSDPagr as a deflator. All four categories were then measured relative to their 1971–1972 levels. SOURCES: Statistical Abstract of Haryana (various issues); Agricultural Prices in India, Ministry of Agriculture, Government of India (various issues).
ready exhausted more than 20 years ago. A related yet striking feature of the land use pattern in Haryana is the very small proportion of the reported area under forest cover, 2.3 percent in 1970 and 2.5 percent in 1995. Such low forest cover values indicate extensive use of land for cultivation. Although the area under forest cover increased slightly in the 1980s from efforts to promote environmental preservation, Haryana's percentage of land under forest cover remains far below the national norm of 33 percent. The Ninth Plan (1997–2002) of India specifies that not less than 2 percent of the land area of each district should be classified as forest cover.
A combination of government policies, population pressures, and available technological options are responsible for other types of changes
Page 120
|
Class of Severity |
||||||||
|
Area (hectares) |
As Percent of Total State Area |
|||||||
|
Type of Soil Degradation |
Low |
Medium |
High |
Total |
Low |
Medium |
High |
Total |
|
Physical degradation a |
||||||||
|
Water erosion |
305,273 |
9,894 |
315,167 |
6.90 |
0.22 |
7.13 |
||
|
Water erosion and stoniness |
23,023 |
13,408 |
36,431 |
0.52 |
0.30 |
0.82 |
||
|
Wind erosion |
392,235 |
143,993 |
536,228 |
8.87 |
3.26 |
12.13 |
||
|
Wind erosion and stoniness |
2,609 |
2,609 |
0.06 |
0.06 |
||||
|
Flooding |
89,550 |
52,539 |
4,336 |
146,315 |
2.03 |
1.19 |
0.10 |
3.31 |
|
Water erosion and salinity |
26,740 |
26,740 |
0.60 |
0.60 |
||||
|
Wind erosion and salinity |
90,119 |
2,270 |
92,389 |
2.04 |
0.05 |
2.09 |
||
|
Flooding and salinity |
33,580 |
22,491 |
56,071 |
0.76 |
0.51 |
1.27 |
||
|
Chemical degradation b |
||||||||
|
Salinity and sodicity |
124,636 |
92,637 |
38,381 |
255,654 |
2.82 |
2.10 |
0.87 |
5.78 |
|
Total |
247,766 |
1,007,666 |
212,172 |
1,467,604 |
5.60 |
22.79 |
4.80 |
33.19 |
a
Refers to displacement of soil material principally by wind and water.
b
Refers to internal soil deterioration resulting from the accumulation of chemical substances such as salt and loss of nutrients.
SOURCE: National Bureau of Soil Survey and Land Use Planning. 1996–1997. Soil of India. NBSS Publication 44, Series 3.
Page 121
|
Area (thousand hectares) |
Percent of Reported Area |
|||||||
|
Category |
1970 |
1980 |
1990 |
1995 |
1970 |
1980 |
1990 |
1995 |
|
1. Forest |
99.1 |
132.0 |
169.0 |
110.0 |
2.3 |
3.0 |
3.9 |
2.5 |
|
2. Not available for cultivation |
489.5 |
434.0 |
417.0 |
494.0 |
11.1 |
9.9 |
9.5 |
11.2 |
|
2.1 Nonagricultural uses |
308.8 |
369.0 |
338.0 |
400.0 |
7.0 |
8.4 |
7.7 |
9.1 |
|
2.2 Barren and uncultivated |
180.7 |
75.0 |
97.0 |
94.0 |
4.1 |
1.7 |
2.2 |
2.1 |
|
3. Other uncultivated land, excluding fallow |
98.0 |
60.0 |
48.0 |
51.0 |
2.2 |
1.4 |
1.1 |
1.2 |
|
3.1 Permanent pastures and grazing |
54.2 |
30.0 |
23.0 |
24.0 |
1.2 |
0.7 |
0.5 |
0.5 |
|
3.2 Under trees, crops not included in NSA |
2.6 |
0 |
4.0 |
4.0 |
0.1 |
0 |
0.1 |
0.1 |
|
3.3 Cultivable waste |
41.2 |
30.0 |
21.0 |
23.0 |
0.9 |
0.7 |
0.5 |
0.5 |
|
4. Fallow land |
149.8 |
177.0 |
169.0 |
156.0 |
3.4 |
4.0 |
3.9 |
3.5 |
|
4.1 Other than current fallow |
0.3 |
0 |
0 |
0 |
0 |
0 |
0 |
0 |
|
4.2 Current fallow |
149.5 |
177.0 |
169.0 |
156.0 |
3.4 |
4.0 |
3.9 |
3.5 |
|
5. Net sown area (NSA) |
3,565.4 |
3,602.0 |
3,575.0 |
3,586.0 |
81.0 |
81.8 |
81.7 |
81.5 |
|
Total, all categories (1+2+3+4+5) |
4,402 |
4,405 |
4,378 |
4,398 |
100 |
100 |
100 |
100 |
Page 122
in land use. For example, an increase in the area devoted to nonagricultural uses is the direct result of increasing urbanization, industrialization, and the state government's policy of creating industrial estates.4 The area under nonagricultural uses increased from 309,000 hectares in 1970 to 338,000 hectares in 1990, a change that can be attributed to increased land use for housing, industrial estates, and infrastructure (such as roads).
By contrast, barren and uncultivated land, land used for grazing and as permanent pasture, and cultivable wasteland have all decreased. The decrease in land area in the “barren and uncultivated” category (it declined from 4.1 percent of the reported area in 1970 to 2.2 percent in 1990) is a result of land reclamation policy. The availability of technology for reclaiming land affected by severe salinity and sodicity has made such reclamation feasible and financially viable. Reclamation of barren land for cultivation has in part mitigated the negative effects of the expansion of the area under nonagricultural uses.
The decline in area classified as permanent pastures and grazing land is a direct result of the increased population pressure from both humans and animals. Permanent pastures and grazing land declined by 30,000 hectares between 1970 and 1990. As a proportion of reported area, they declined from 1.2 percent in 1970 to only 0.5 percent in 1990. Fallow lands increased by about 20,000 hectares from 1970 to 1990, while net sown area declined by about 25,000 hectares (a small proportion of the total) in the 1980s, possibly indicating the retirement of cultivated land deficient in soil nutrients or suffering from increased salinity. Unacceptable salinity levels may be related to the combined effects of inappropriate agricultural practices, lack of proper drainage, and exploitation of groundwater.
Cropping Patterns
Changes in land use over a period of time can be classified as: (1) conversion of land from one use category to another (for example, land is shifted from agricultural uses to nonagricultural uses; (2) changes in land use within a given land use category (for example, agricultural land is shifted from one crop to another); and (3) changes in land use intensity (for example, a farmer grows more than one crop a year, resulting in increased cropping intensity). These three types of land use change may occur concurrently; they are not necessarily sequential in nature.
Over the past three decades Haryana has undergone these three types of change in land use to varying degrees. In addition to the changes from one category of land use to another over the years, significant shifts also
4The best-known examples are the big industrial estates created in Faridabad and Gurgaon by the government of Haryana.
Page 123
have occurred within categories of land use. The most notable of these have been within the agricultural sector. For example, the absolute area and proportion of cropped area allocated to traditional crops such as jowar, bajra, maize, barley, and gram have declined, and the area allocated to rice, wheat, and cotton has increased. While some of these increases in area have stemmed from the increased availability of cropped area, most of the changes have resulted from crop switching.
Significant changes in cropping patterns have been implemented in Haryana over the years. The proportion of cropped area allocated to cereals increased from 45 percent in 1960 to more than 57 percent three decades later ( Table 6-10). The proportion of area allocated to oilseeds and cotton also increased over this period, while that allocated to sugarcane declined very slightly. Finally, there has been a notable decline in the proportion of area allocated to pulses, from 33 percent in 1960 to 7 percent in 1990.
As a result of shifts in cropping area and technological progress, wheat production increased from 2.4 million tonnes in 1971 to 6.5 million tonnes in 1991 ( Table 6-11). Likewise, rice production increased from 536,000 tonnes in 1971 to 1.8 million tonnes in 1991. Pulse production, however, declined—from 682,000 tonnes to 273,000 tonnes over the same period.
In Haryana, where more than 80 percent of the total reported area is utilized by cropping systems, farmers individually own and operate small
|
Year |
||||
|
Area allocated to: |
1960 |
1970 |
1980 |
1990 |
|
Cereals |
2,039.9 (45.33) |
2,750.3 (54.48) |
3,232.1 (55.48) |
3,187.5 (57.23) |
|
Pulses |
1,504.4 (33.43) |
1,205.1 (23.87) |
1,115.5 (19.14) |
389.1 (6.99) |
|
Oilseeds |
203.5 (4.52) |
175.6 (3.48) |
216.5 (3.72) |
701.3 (12.59) |
|
Cotton |
108 (2.40) |
241.7 (4.79) |
329.5 (5.66) |
505.8 (9.08) |
|
Sugarcane |
138 (3.07) |
114.4 (2.27) |
145.1 (2.49) |
160.9 (2.89) |
|
Other |
506.2 (11.25) |
560.9 (11.11) |
787.3 (13.51) |
625.4 (11.22) |
|
Cropped area |
4,500 (100) |
5,048 (100) |
5,826 (100) |
5,570 (100) |
NOTE: Figures in parentheses are percentage of each crop in the gross cropped area.
SOURCE: Statistical Abstract of Haryana (various years).
Page 124
|
Year |
|||
|
Crop |
1971 |
1991 |
Percent Change |
|
Wheat |
2,402 |
6,496 |
170 |
|
Rice |
536 |
1,803 |
236 |
|
Coarse grains |
923 |
506 |
−45 |
|
Total cereals |
3,861 |
8,805 |
128 |
|
Pulses |
682 |
273 |
60 |
|
Foodgrains |
4,545 |
9,078 |
100 |
SOURCE: Statistical Abstract of Haryana (various years).
parcels of much of the available land. While conversion of the agricultural land to purposes other than agricultural is generally not permitted, farmers do make almost all the other decisions related to crop production and allocation of land.
Effects of the Green Revolution on the Arid and Semiarid Regions
Haryana is a relatively small state in area, but, like other states, its climate, rainfall, soils, and infrastructure development vary widely across districts. Because these factors have a significant impact on the economy of each administrative unit, a study that correlates population and land use at the district level is useful. Such a study does have its limitations, however, because district boundaries have changed over time for administrative purposes without regard for agroclimatological and ecological differences.
The districts of Haryana can be classified into two main agroecological regions: arid and semiarid ( Table 6-12). The semiarid region is further subdivided into the central and southern tracts. These regions differ in cropping patterns, level of agricultural technology, and infrastructure development. A more disaggregated analysis can be carried out at the regional level using the detailed agroclimatic/ecological characteristics furnished by the National Bureau of Soil Survey and Land Use Planning (1992) and presented by Vashishtha et al. (1999). However, a grouping of districts into arid and semiarid regions is more helpful in understanding broadly the nature of the forces driving land use change. Values of certain parameters computed for the arid and semiarid regions on the basis of aggregation of districts into two regions are not perfectly accurate. Yet the benefit of offering an intertemporal comparison far outweighs the loss of marginal accuracy (see Vashishtha et al., 1999).
Certain shifts in cropping pattern, however, have occurred in both regions. The semiarid region, with its more favorable conditions for agri-
Page 125
|
Region |
Soils and Climate |
Districts |
|
Arid |
Hot arid with desert and saline soils |
Mahendragarh, Hisar, Rewari, Bhiwani, Sirsa |
|
Semiarid |
Hot semiarid with alluvium-derived soils |
Central tract: Karnal, Jind, Kurukshetra, Panipat, Sonipat, Kaithal, Ambala, Yamunanagar Southern tract: Rohtak, Faridabad, Gurgaon |
NOTE: The physical boundaries of districts have been divided and reorganized, and new districts have been created over time. In 1971 Haryana had 12 districts, and that figure was used as the base of the intertemporal comparison of change in various parameters at the district level. Central tract areas have intensive irrigation facility. Part of the district of Ambala is a hilly tract. Southern tract areas have poor drainage and waterlogging and are affected by soil salinity.
SOURCE: Prepared by the author on the basis of detailed information provided by: National Bureau of Soil Survey and Land Use Planning. 1992. Agro-Ecological Regions of India. Indian Council of Agricultural Research, Nagpur.
culture, more than doubled its area under rice cultivation from 1971 to 1991—from 272,000 hectares to 574,000 hectares—as the rice–wheat crop rotation became more widespread. Even in the arid region, which is less favorable for agriculture, the area devoted to rice cultivation increased from 19,000 hectares in 1971 to 64,000 hectares in 1991 ( Table 6-13). In both regions the area under wheat, the dominant cereal in the state, increased substantially between 1971 and 1991. The area under coarse cereals (bajra) went down drastically.
|
Rice |
Wheat |
Bajra (millet) |
|||||||
|
Region |
1971 |
1981 |
1991 |
1971 |
1981 |
1991 |
1971 |
1981 |
1991 |
|
Arid |
19.2 (0.9) |
41.2 (1.6) |
63.6 (2.6) |
237.8 (11.7) |
396.9 (14.9) |
560.7 (22.9) |
521.1 (25.6) |
535.4 (20.1) |
399.5 (16.3) |
|
Semiarid |
271.8 (9.0) |
463.4 (14.6) |
573.7 (18.4) |
939.2 (31.2) |
1,165 (36.8) |
1245.1 (39.9) |
361 (12) |
316.5 (10) |
157.1 (5) |
NOTE: Figures in parentheses are the percentage each crop occupies of the gross cropped area.
SOURCE: Prepared by the author based on district-level data obtained from Statistical Abstract of Haryana (various issues).
Page 126
Expansion of irrigated area and a price policy favoring oilseeds and cotton were common factors in the pattern shifts. In the arid region both oilseeds and cotton gained at the cost of pulses, while in the semiarid region only oilseeds replaced pulses. Higher prices as well as the technological thrust to raise productivity for oilseeds were mainly responsible for making this crop more profitable. As for pulses, although prices rose significantly over the period 1971–1991, the lack of technological breakthroughs in yield kept it a low-priority crop, even in the arid region.
One marked difference in the cropping patterns of the two regions is that the semiarid region uses a much higher percentage of area for water-intensive crops ( Table 6-14). For example, in 1991 in the arid region cereals accounted for about 43 percent of the gross cropped area (GCA), pulses 11 percent, oilseeds 18 percent, and cotton 18 percent. By contrast, in 1991 in the semiarid region cereals accounted for 68 percent of the GCA, pulses 4 percent, oilseeds 9 percent, and cotton 2 percent. Rice cultivation occupied only a small portion of the GCA—3 percent—in the arid region in 1991 and 18 percent of the GCA in the semiarid region ( Table 6-13). The expansion of area used for cultivating rice in the semiarid region has been impressive, increasing from 9 percent in 1971 to 18 percent in 1991.
|
Cereals |
Pulses |
Oilseed |
Cotton |
Sugarcane |
Total |
|
|
1971 |
||||||
|
Arid region |
40.8 |
32.9 |
4.4 |
9.7 |
0.6 |
88.3 |
|
Semiarid region |
63.7 |
17.8 |
2.9 |
1.5 |
3.4 |
89.3 |
|
Central tract |
65.8 |
14.5 |
2.0 |
1.9 |
3.5 |
87.6 |
|
Southern tract |
61.2 |
21.8 |
4.0 |
1.0 |
3.3 |
91.4 |
|
All Haryana |
54.5 |
23.9 |
3.5 |
4.8 |
2.3 |
88.9 |
|
1981 |
||||||
|
Arid region |
39.0 |
30.9 |
4.8 |
10.5 |
0.4 |
85.5 |
|
Semiarid region |
69.3 |
9.3 |
2.8 |
1.6 |
4.2 |
87.3 |
|
Central tract |
71.2 |
7.7 |
1.8 |
1.9 |
4.7 |
87.3 |
|
Southern tract |
65.3 |
12.8 |
5.1 |
0.9 |
3.2 |
87.3 |
|
All Haryana |
55.5 |
19.1 |
3.7 |
5.7 |
2.5 |
86.5 |
|
1991 |
||||||
|
Arid region |
43.4 |
11.3 |
17.6 |
18.2 |
0.3 |
90.8 |
|
Semiarid region |
68.1 |
3.6 |
8.7 |
2.0 |
4.9 |
87.2 |
|
Central tract |
71.6 |
2.8 |
4.3 |
2.4 |
5.4 |
86.6 |
|
Southern tract |
58.9 |
5.5 |
19.7 |
0.9 |
3.6 |
88.8 |
|
All Haryana |
57.2 |
7.0 |
12.6 |
9.1 |
2.9 |
88.8 |
SOURCE: Prepared by the author based on district-level data obtained from Statistical Abstract of Haryana (various issues).
Page 127
|
Area |
Degraded Area |
||||
|
(square kilometers) |
(as percent of all Haryana) |
(square kilometers) |
(as percent of all Haryana) |
(percent of region) |
|
|
Arid region |
18,937 |
42.83 |
6,410 |
14.50 |
33.85 |
|
Semiarid region |
25,275 |
57.17 |
8,267 |
18.70 |
32.71 |
|
Central tract |
15,999 |
45.57 |
6,101 |
13.80 |
38.14 |
|
Southern tract |
9,276 |
11.60 |
2,166 |
4.90 |
23.35 |
|
All Haryana |
44,212 |
100.00 |
14,678 |
33.20 |
33.20 |
NOTE: These figures are approximate, because the area has been computed by superimposing arid and semiarid zones of Haryana showing district boundaries.
SOURCE: Prepared by the author based on district-level data obtained from the National Bureau of Soil Survey and Land Use Planning. 1996–1997. Soil of India. NBSS Publication 44, Series 3. Indian Council of Agricultural Research, Nagpur.
Both the arid and semiarid regions suffer from soil degradation of one kind or another ( Table 6-15). About one-third of both regions are categorized as degraded area. In the central tract of the semiarid region, the heart of Haryana's rice production, 39 percent of the land suffers from degradation; the water table in this region also is markedly low.
|
Cereals |
Pulses |
Oilseed |
Cotton |
Sugarcane |
|
|
1971 |
|||||
|
Arid region |
1,001.9 |
476 |
547.9 |
351.2 |
4,621.8 |
|
Semiarid region |
1,577.7 |
683 |
575.2 |
218.7 |
4,476.6 |
|
Central tract |
1,842.5 |
707 |
585.7 |
209.5 |
4,594.3 |
|
Southern tract |
1,224.8 |
664 |
568.8 |
240.0 |
4,321.3 |
|
All Haryana |
1,403.9 |
568 |
561.4 |
326.9 |
4,491.7 |
|
1981 |
|||||
|
Arid region |
1,352.8 |
319 |
696.8 |
366.7 |
3,153.2 |
|
Semiarid region |
1,953.8 |
287 |
692.9 |
280.0 |
4,037.3 |
|
Central tract |
2,180.5 |
180 |
725.2 |
285.4 |
3,941.2 |
|
Southern tract |
1,423.6 |
426 |
668.0 |
255.9 |
4,343.8 |
|
All Haryana |
1,761.1 |
311 |
695.2 |
353.4 |
3,969.7 |
|
1991 |
|||||
|
Arid region |
2,479.5 |
660 |
1,102.4 |
471.3 |
5,588.2 |
|
Semiarid region |
2,903.7 |
806 |
1,046.2 |
301.8 |
5,626.2 |
|
Central tract |
3,115.5 |
912 |
1,233.1 |
316.4 |
5,778.7 |
|
Southern tract |
2,246.9 |
670 |
941.2 |
207.3 |
5,046.7 |
|
All Haryana |
2,762.4 |
702 |
1,080.7 |
450.7 |
5,624.6 |
SOURCE: Prepared by the author based on district-level data obtained from Statistical Abstract of Haryana (various issues).
Page 128
The overall difference in productivity between the arid and semiarid regions is narrowing over time ( Table 6-16). While the semiarid region has attained much higher yields of cereals and pulses than the arid region, the latter has performed better with crops that require relatively little water such as oilseed and cotton. In 1971 cereal yields in the semiarid region were 57 percent higher than in arid region. By 1991 this difference in yield had declined to 17 percent. By contrast, in 1971 the cotton yield in the arid region was greater than that in the semiarid region, and the difference had increased further by 1991.
The semiarid region has more advanced irrigation and agricultural technology than the arid region as indicated by the number of tube wells and tractors per thousand hectares of net sown area utilized by the semiarid region from 1971 to 1991. But in both regions the amount of fertilizer applied per hectare and the percentage of irrigated area increased signifi-
|
Gross Irrigated Area as Percent of Gross Cropped Area |
Cropping Intensity (percent) |
Use of Agricultural Technology (per thousand hectares of net sown area) |
Fertilizer Consumption (kilograms per hectare) |
||
|
Tube Wells |
Tractors |
||||
|
1971 |
|||||
|
Arid region |
41.5 |
139 |
10.1 |
3.0 |
7.3 |
|
Semiarid region |
49.2 |
143 |
50.4 |
6.7 |
18.3 |
|
Central tract |
62.1 |
147 |
64.2 |
7.2 |
26.5 |
|
Southern tract |
33.1 |
138 |
34.4 |
6.2 |
8.1 |
|
All Haryana |
46.1 |
142 |
33.9 |
5.2 |
13.9 |
|
1981 |
|||||
|
Arid region |
50.9 |
163 |
33.4 |
17.8 |
20.5 |
|
Semiarid region |
66.3 |
156 |
100.0 |
38.5 |
55.6 |
|
Central tract |
75.2 |
161 |
122.1 |
46.5 |
72.3 |
|
Southern tract |
47.4 |
147 |
56.9 |
22.9 |
19.8 |
|
All Haryana |
59.3 |
159 |
70.3 |
29.3 |
39.6 |
|
1991 |
|||||
|
Arid region |
70.7 |
159 |
77.4 |
49.5 |
84.6 |
|
Semiarid region |
83.5 |
159 |
195.5 |
83.8 |
121.4 |
|
Central tract |
90.9 |
169 |
230.6 |
95.8 |
142.0 |
|
Southern tract |
64.8 |
138 |
122.4 |
58.6 |
69.0 |
|
All Haryana |
77.9 |
159 |
143.6 |
68.7 |
105.3 |
SOURCE: Prepared by the author based on district-level data obtained from Statistical Abstract of Haryana (various issues).
Page 129
cantly during this period ( Table 6-17). The level of adoption of high-yielding rice varieties did not differ significantly between the two regions.
While differences in the pattern of crop allocations and agricultural development between the two regions can be attributed in part to differences in their climatic and natural resource endowments, the regional differences also have been accentuated by policies that tend to favor the better-endowed regions. Although several public policies influence the pace and pattern of development, two of these policies—on infrastructure development and the pricing of crop inputs and outputs—appear to be critical.
The policies on crop input and output pricing, unlike the infrastructure policies, do not have an apparent regional bias. Most of these policies are decided at the national level and do not vary much across states. Within the state, the pricing of inputs and outputs does not differ between regions, but the pricing policies tend to favor the better-endowed regions indirectly by offering more remunerative prices for crops suitable for cultivation in such regions. Because these crops use large amounts of fertilizer, water, and electricity, input subsidies prove more beneficial to farmers in the better-endowed regions. Even research and extension activities favor the crops suitable for cultivation in such regions. Thus unintended biases emerge from the actual implementation of such policies. The better-endowed regions gain relatively more, although not at the expense of the less-well-endowed regions.
WATER RESOURCES
Paradoxically, Haryana is facing the threat of a declining water table because of the exploitation of resources in some areas and a rising water table caused by increased waterlogging and soil salinity in others. The decline in the water table is more marked in the semiarid region than in the arid region. The semiarid region, which has good groundwater quality, derives approximately 80 percent of water for irrigation and drinking purposes from subsurface sources. The arid region, by contrast, consists of desert and drought-prone areas and has poor groundwater quality. Approximately 76 percent of the water used for irrigation in the arid region is obtained from surface water canals.
Declining Water Table
Over the last two and a half decades a shift has been observed in the cropping pattern for irrigated crops in Haryana. The area devoted to wheat cultivation has increased by more than 150 percent, and the area used for the cultivation of paddy, a highly water-intensive crop, has increased threefold (Gangwar and van den Toorn, 1987; Joshi and Tyagi,
Page 130
1991). After remunerative price policies for paddy rice were initiated in the late 1970s, the area devoted to rice cultivation expanded, resulting in exploitation of groundwater resources. Subsidies for the use of electricity in the rural sector and the lack of regulatory measures for the use of groundwater only exacerbated the exploitation and encouraged inefficient use of groundwater. As a result, the water table declined rapidly, especially in the semiarid region.
At the state level, more groundwater could be harnessed, because only 68 percent of the resources are being utilized (M. C. Agarwal, 1995). The semiarid region, however, is experiencing an average fall in the water table of 0.3–0.6 meters annually, indicating that groundwater utilization is exceeding recharge. The districts of Yamunanagar, Karnal, Kurukshetra, and Ambala have shown signs of overextraction, and in other districts the rate of decline of the water table is alarming. In Kurukshetra the water table declined from 8.2 meters in 1974 to 17.8 meters in 1994 ( Table 6-18). The phenomenon of a declining water table is not confined to the semiarid region. In Mahendragarh, in the arid region, the water table declined from 19.7 meters in 1974 to 30.4 meters in 1994. The cost of replenishing groundwater in these locations will be enormous if the trend continues. For example, according to the Tata Energy Research Institute (TERI), the cost of replenishing groundwater in districts like Karnal and Panipat is likely to be Rs. 371 million ($8.5 million) and Rs. 169 million ($3.9 million), respectively.
The overdependence on subsurface sources of groundwater stems from low natural recharge, meager tanks and surface water reservoirs, and uncertain and low canal water supplies in good-quality groundwater zones (R. P. Agarwal, 1995; Singh, 1995; Tanwar, 1994). Researchers and
|
District |
Water Table Depth in October 1974 (meters) |
Water Table Depth in October 1994 (meters) |
Rate of Fall of Water Table (meters/year) |
Projected Water Table Depth in 2047, Assuming Past Trends (meters) |
|
Karnal |
5.27 |
8.47 |
0.16 |
17.00 |
|
Panipat |
4.60 |
7.90 |
0.17 |
18.00 |
|
Rewari |
11.85 |
15.80 |
0.20 |
26.00 |
|
Kurukshetra |
8.18 |
17.79 |
0.48 |
41.00 |
|
Mahendragarh |
19.65 |
30.41 |
0.54 |
57.00 |
NOTE: The districts of Karnal, Panipat, and Kurukshetra are in the semiarid region; the others are in the arid region (see Table 6-12).
SOURCE: The figures on water table depth in October 1974 and October 1994 were obtained from the State Groundwater Board, Chandigarh, Haryana.
Page 131
others fear that overuse has lowered the water yield from tube wells. Lower yield may affect overall irrigation efficiency at the farm level, thereby increasing energy consumption and operating costs as farmers must pump water for longer hours to irrigate the same area. Otherwise, they must increase operating costs by purchasing high-powered electric motors. This situation often leads to conflicts and competition over the use of the resource.5 In addition, the falling water table already has contributed toward a nutritional imbalance, deterioration in soil health and texture, and the emergence of weeds and insects (Tanwar, 1994).
The falling water table in Haryana does not result entirely from the overuse associated with paddy cultivation and maintaining the rice–wheat rotation. It also results from faulty drainage operations, leading to a diminished recharge. This situation was brought about by the increased drainage efficiency achieved by the large-scale construction of river control works and lined drains, which had the secondary effect of reducing recharge of the aquifer (Tanwar, 1994). Thus the environmental problems related to the falling water table must be addressed on two levels: at the policy level, by discouraging the rice–wheat rotation, and at the operations level, by dealing with the engineering aspects of drainage operations. The underlying problem is that profit-driven farmers are making excessive use of groundwater through tube wells. The problem of faulty drainage calls for appropriate technical solutions.6
Waterlogging and Salinization
In contrast to the emerging water scarcity in Haryana's semiarid region, the water table is rising elsewhere in the state, primarily in the arid region. This rise is occurring below canals underlain with brackish and highly saline water, leading to waterlogging and salinization. Estimates reveal that nearly 65 percent of the central, southern, and western parts of the state covering districts such as Sirsa, Jind, Bhiwani, and Hisar are affected by waterlogging. Heavy rainfall, compounded by high discharges from the rivers and inadequate drainage outlets to the Yamuna and Ghaggar Rivers, has contributed to a rise in the level of groundwater, increased waterlogging, and salinity. As a result, the water level in the area is rising at a rate of 0.30–1.0 meters a year (Tanwar, 1997).
5Interstate conflicts over water sharing, intrabasin conflicts between upstream and downstream users of water, and allocation of water between domestic and agriculture uses are problems in various parts of India. See Chopra and Bathla (1997) and Bhalla and Singh (1996) for descriptions of such conflicts in Punjab and the Sabarmati basin in Gujarat.
6Tanwar (1994) points out that drainage systems should not be overly oriented toward flood management. In fact, they should be regulated and reoriented to focus on water conservation and recharging.
Page 132
Overall, an estimated 18 percent (8,000 square kilometers) of the state is waterlogged, of which 3,500 square kilometers are highly saline (Tanwar, 1997). The waterlogging will degrade some areas, and flooding could be more frequent and severe in the future. Chaudhary Charan Singh Haryana Agricultural University (1996–1997) has estimated the loss in agricultural production from waterlogging and soil salinity at Rs. 270 million ($6.2 million). The amount may increase to Rs. 860 million ($20 million) in 2000 if no remedial measures are taken to rectify the situation.
Water Table Dynamics
A study of water table dynamics in the semiarid district of Karnal has just been completed by the Agricultural Economic Research Centre at the University of Delhi (Bathla, 1998). Researchers chose this district for further analysis because it is representative of irrigated, mechanized, and agriculturally developed cropping systems and because it faces exploitation of its water resources. To examine the potential water scarcity in Karnal, they enlisted a dynamic model that simulates the interactions between water resources and agricultural demand. Researchers determined the annual water supply through observed precipitation patterns and the hydrological cycle. They then linked the hydrological cycle to demands originating from increases in cropping intensity and population growth rate in the district's rural and urban areas.
The simulation was conducted over a 30-year period, 1997–2027; it assumes no changes in cropping pattern and policy interventions in that period.7 Model results reveal that Karnal receives an average of 210,000 hectare-meters of replenishable recharge in its annual groundwater supply, including the initial stock. The estimated base year demand, derived on the basis of crop requirements and drinking water norms, is approximately 300,000 hectare-meters for irrigation, 3,500 hectare-meters for drinking water, and 2,000 hectare-meters for industrial uses. The irrigation demand is projected to rise to 450,000 hectare-meters in 2027, based on an increase in cropping intensity of 1.3 percent a year. Of the total estimated irrigation demand, approximately 65 percent will be met by groundwater resources, the rest by surface water and rainfall.
The model indicates that when demand for drinking water is given priority, the total demand for water for irrigation purposes is constrained by the supply over the simulation period. The result, then, is an unsustainable pattern of resource use, where the extraction of the resource exceeds its supply. If the existing pattern of resource use continues and the resource is extracted to meet demand, the water table will continue to
7A statistical package, SENECA (Simulation Environment for Ecological Applications), was used to develop and implement the simulation model.
Page 133
decline at the annual rate of 11 centimeters over the period 1997–2007, 9.4 centimeters over 2007–2017, and 7.9 centimeters over 2017–2027. If it is assumed that land allocation in Haryana is more responsive to the price of rice-wheat relative to the price of sugarcane, more land will be allocated to the cultivation of rice, thereby contributing to the overuse of water.
As long as farmers are able to manage the declining water table by incurring higher capital costs to pump water from greater depths, and as long as they continue to reap profits from farming, they will likely continue the existing rice–wheat cropping sequences.8 Nevertheless, the growing shortage of water may defeat the goals of achieving higher levels of foodgrain production and productivity and endanger efforts to achieve sustainable use of the resources.
Water Resource Policies
The falling water table is a direct threat to the future of agriculture in Haryana. Policy alternatives for conserving and increasing the water supply are available, however. They include support for development of technological options; implementation of incentives for efficient water allocation and use; and pricing of crop inputs and outputs to encourage cultivation of less water-intensive crops.
Artificial recharge, efficient irrigation practices, and a watershed management approach that saves and mobilizes water resources have long been implemented in Haryana, but it is essential to continue these operations. Moreover, information should be adequately disseminated on optimum irrigation scheduling and efficient irrigation practices in the case of water-intensive crops, with the objective of conserving water without a negative impact on crop yields. Sophisticated technologies, such as drip and sprinkler irrigation, should be evaluated, but these technologies may not be feasible or easily accessible because of the high capital costs involved.
Water must be used efficiently and allocated equitably across regions. A reduction in per capita water consumption or a reduction in quantity allocated can aid in conserving existing water resources. Researchers have recommended that, on an international level, populations reduce their water consumption, meeting a basic water requirement criterion of 50 liters per capita per day in urban areas (Gleick, 1997). India's Ministry of Urban Development (1991) has recommended a quantity of 70–100 liters per capita per day, which is believed sufficient to meet urban domestic requirements. In Karnal the urban population consumes 225 liters per capita per day, which is quite high in view of the recommended consumption level.
8Lower discharge rates and the higher cost of pumping water will adversely affect small farmers, who may lack access to water.
Page 134
Changes in the state-level commodity pricing policies are another avenue toward conserving resources. The output pricing of products can, at best, encourage the substitution of less water-intensive crops for wheat and paddy, but in light of the present trend toward adopting the highly profitable rice–wheat production sequence, such a substitution may not be feasible in Haryana. Farmers could increase the area used to cultivate vegetables and fruits, but, because storage facilities for these perishable commodities are not available, farmers often do not fetch higher returns for these crops.
An increase in input prices could have a substantial impact on efficient use of available resources. At present, the state government provides subsidized electricity to farmers based on a flat rate structure. The government might consider following a more rational pricing policy, based on a unit rate, that would prevent exploitation and misuse of water resources.9 Moreover, if consumers were aware of the growing water scarcity in the region, they might find higher electricity charges more acceptable, provided the power supply is uninterrupted. In one of the studies done in the Karnal and Kurukshetra Districts of Haryana, water consumers were willing to pay one-third more than the present rate of Rs. 29 (0.67 cents) per BHP (break horsepower) per month for a dependable supply of electricity. Indeed, during kharif season, when rice is grown, they were willing to pay from Rs. 30.2 (0.70 cents) to Rs. 78.9 (2 cents) per BHP per month, or an average of Rs. 40.1 (0.9 cents) per BHP per month (Malik and Goldar, 1998).
A mix of these policy measures could be adopted to solve the emerging problem of water depletion in Haryana. Government intervention also is required to achieve a solution. India's Ministry of Water Resources has proposed a bill that would regulate and control the development of groundwater (Government of India, 1992). It proposes to set up a single, unified agency of the groundwater authority at the state level, which would operate under the jurisdiction of the Central Groundwater Authority.10 The former would regulate and manage groundwater resources through technical planning and also take the necessary remedial measures. Moreover, it would help to create awareness of the need for judicious use of water and promote education among farmers and other users. The canal irrigation system also should be reviewed in accordance with the irrigation demands of the existing cropping pattern across districts.
9Researchers have found that farmers are overirrigating rice and wheat to safeguard the crops against electric power disruptions.
10Personal communication with B. S. Tanwar, director, Haryana State Minor Irrigation and Tubewell Corporation, Karnal.
Page 135
SOCIOECONOMIC INDICATORS
A closer look at changes in the size and composition of income across different sectors of Haryana's economy will shed light on the dynamics of population and land use in the state over time. This section examines the nature of the economic changes and changes in household consumption taking place in Haryana.11
Economic Indicators
In India the primary sector consists of agriculture, forestry, logging, fishery, mining, and quarrying; the secondary sector is made up largely of manufacturing; and the tertiary sector comprises services that support other sectors and expands along with urbanization. The absolute number of workers engaged in each sector has increased substantially over time, and the distribution of workers engaged across sectors has changed significantly as well. According to the census of India, the proportion of workers engaged in the primary sector was 48 percent in 1971 and 55 percent in 1991. The proportion of these workers has gone up as the proportion of those engaged in the secondary and tertiary sectors has gone down. The share of workers in industry declined from 19 percent in 1971 to 15 percent in 1991, and the share of workers in the service sector declined from 33 percent to 30 percent over the same period.
In 1970 the per capita net state domestic product (NSDP) of Haryana was 1.2 times the national average and 1.5 times greater in 1992 ( Table 6-19). Among all states, the per capita NSDP of Haryana ranks second, after Punjab. While the contribution of the primary sector to the NSDP declined substantially between 1971 and 1991, its share of workers increased over the same period. The shares of the secondary and tertiary sectors, however, declined over the corresponding period. The primary sector (mainly the agricultural sector) thus continues to absorb large numbers of the workforce despite its decline in relative importance in the NSDP.
Changes in Household Consumption
Consumption patterns changed throughout India between 1972 and 1993 ( Table 6-20). In terms of total household expenditures, the overall share of food declined in rural areas from 73 percent in 1972 to 63 percent in 1993 and in urban areas from 65 percent to 55 percent. The share of cereal grains in total food expenditure declined from 63 percent in 1972 to
11The section on household consumption is largely based on surveys on “Consumer Expenditure in India,” carried out in Haryana between 1972 and 1993 by the National Sample Survey Organisation (NSSO).
Page 136
|
Haryana |
India |
||
|
Year |
(1) |
(2) |
(1)/(2) |
|
1970 |
1,944 |
1,572 |
1.24 |
|
1980 |
2,370 |
1,625 |
1.46 |
|
1990 |
3,467 |
2,258 |
1.54 |
|
1992 |
3,411 |
2,267 |
1.50 |
|
1996 |
3,956 |
2,774 |
1.43 |
SOURCE: National Accounts Statistics 1998. Central Statistical Organization, Ministry of Planning, Government of India; State Domestic Product 1998, CSO (floppy).
45 percent in 1993 in rural regions and from 42 percent to 32 percent in urban regions. Conversely, the shares of other food products, especially fruits, vegetables, and livestock products, increased significantly. The substantial increase in the per capita monthly household expenditure in both rural and urban areas stemmed from large increases in prices. Expenditures on nonfood items increased more than expenditures on food. A decline in the fraction of income spent for food is customarily recognized as an indicator of improved economic well-being. It is interesting to note that this change occurred in both urban and rural areas.
In Haryana's expenditure on food from 1972 to 1993, the share of cereal grains, as expected, declined significantly in rural and urban areas, indicating a shift in consumption from cereal grains to other food products ( Table 6-21). An important feature of the food consumption pattern
|
Rural |
Urban |
|||
|
1972 |
1993 |
1972 |
1993 |
|
|
Percent share of total expenditure |
||||
|
Food |
72.8 |
63.2 |
64.5 |
54.7 |
|
Nonfood |
27.2 |
36.8 |
35.5 |
45.3 |
|
Percent share of total food expenditure |
||||
|
Foodgrains |
63.1 |
44.8 |
42.1 |
31.7 |
|
Fruits and vegetables |
6.3 |
12.3 |
9.9 |
14.8 |
|
Livestock products |
13.4 |
20.3 |
19.5 |
24.1 |
|
Edible oil |
4.9 |
7.0 |
7.5 |
8.0 |
|
Sugar |
5.2 |
4.8 |
5.6 |
4.3 |
|
Spices and salt |
3.8 |
4.2 |
3.5 |
3.8 |
|
Beverages and refreshments |
3.3 |
6.6 |
11.8 |
13.2 |
SOURCE: Sarvekshana, Vol. 2 (January 1979) and Vol. 20 (October–December 1996), National Sample Survey Organisation.
Page 137
|
Rural |
Urban |
|||||
|
Product |
1972 |
1993 |
Percent Change |
1972 |
1993 |
Percent Change |
|
Per capita monthly expenditure (rupees) |
||||||
|
Food |
46.97 |
231.24 |
392 |
44.19 |
255.33 |
478 |
|
Foodgrains |
19.80 |
59.10 |
198 |
14.94 |
61.19 |
309 |
|
Vegetables |
1.86 |
16.95 |
811 |
2.80 |
25.25 |
802 |
|
Fruits |
0.48 |
6.10 |
1,170 |
1.61 |
12.62 |
683 |
|
Milk and dairy products |
16.16 |
98.19 |
507 |
12.56 |
87.08 |
593 |
|
Meat, fish, and eggs |
0.35 |
1.77 |
405 |
0.62 |
3.43 |
453 |
|
Sugar |
4.83 |
20.68 |
328 |
3.80 |
16.05 |
322 |
|
Edible oil |
0.87 |
9.13 |
949 |
2.97 |
16.85 |
467 |
|
Beverages and refreshments |
1.52 |
11.78 |
675 |
3.32 |
24.26 |
630 |
|
Percent share of total food expenditure (percent) |
||||||
|
Foodgrains |
42.15 |
25.55 |
−17 |
33.80 |
23.96 |
−10 |
|
Vegetables |
3.96 |
7.34 |
3.4 |
6.33 |
9.89 |
3.6 |
|
Fruits |
1.02 |
2.64 |
1.6 |
3.64 |
4.94 |
1.3 |
|
Milk and dairy products |
34.41 |
42.46 |
8.05 |
28.42 |
34.10 |
5.7 |
|
Meat, fish, and eggs |
0.75 |
0.76 |
0.1 |
1.41 |
1.35 |
−0.1 |
|
Sugar |
10.28 |
8.95 |
−1.3 |
8.60 |
6.28 |
−2.32 |
|
Edible oil |
1.84 |
3.95 |
2.11 |
6.72 |
6.60 |
−0.12 |
|
Spices and salt |
2.35 |
3.26 |
0.91 |
3.56 |
3.37 |
−0.19 |
|
Beverages and refreshments |
3.24 |
5.09 |
1.85 |
7.52 |
9.51 |
1.99 |
|
Total food |
100 |
100 |
100 |
100 |
SOURCE: Sarvekshana, Vol. 2 (January 1979) and Vol. 20 (October–December 1996), National Sample Survey Organisation.
was the relatively higher expenditure on milk and dairy products. In 1972 these products accounted for 34 percent of the expenditure on food in rural areas, compared with a national rural average of 10 percent. From 1972 to 1993 the expenditure on dairy products in rural areas increased by 507 percent. As a result, the share of these products in the total expenditure on food increased from 34 to 43 percent over the same period. Dairy products have replaced cereal grains as the most important component of food expenditure in both rural and urban areas.
Trends in Livestock
The rapid growth of agriculture has significantly shifted the pattern of household food consumption in favor of livestock products, particularly milk. Other livestock products, such as meat and eggs, have exhibited marginal increases in consumption. The proportion of households reporting consumption of meat, eggs, and fish in Haryana is smaller than
Page 138
the national average proportion, primarily because of the strong religious taboos on nonvegetarian food.12
Judging from the large increase in the consumption of livestock products observed over the last three decades, it appears likely that this consumption will continue to increase in Haryana and in India. Because Haryana fulfills a sizable portion of the demand for livestock products from Delhi and several other urban centers, increased consumption of livestock products may bring about significant changes in land use. Production of livestock products requires much more land than production of cereal grains, although currently only 2 percent of cereal grains produced in India are fed to livestock, compared with 20 percent in China, 50 percent in Japan, and 70 percent in the United States (Dunning and Brough, 1991).
Animal husbandry is an integral part of Haryana's agriculture. Several agroclimatic features, such as the dry climate, presence of lime in the soil, availability of abundant grazing land, and predominance of semifodder crops, have favored the rearing of quality livestock. Bovines, camels, horses, ponies, mules, donkeys, pigs, sheep, goats, and poultry made up the 1992 livestock census of Haryana. Changes in the livestock population in recent decades are attributable to several factors ( Table 6-22). Intensive cultivation of wheat and rice after the spread of the Green Revolution necessitated rapid completion of tillage and sowing operations. Thus farmers invested heavily in tractors and threshers, and the number of bullocks, which constituted about 85 percent of the draft animal force for cultivation, declined by 41 percent between 1972 and 1992. All in all, the number of working animals declined by 13 percent. Their share of total livestock (in terms of standard feed units) declined from 35 percent to 23 percent during this period.
Another factor affecting changes in the livestock population is the increased demand for milk, eggs, and meat caused by the 64 percent increase in the human population and rising incomes. As a result, the number of milch animals increased by 47 percent between 1972 and 1992. Because of the strong cultural taboo against consumption of beef, nonvegetarians depend on goat, sheep, chicken, and pigs for meat. Thus the population of these animals increased substantially over 1972–1992, though it continues to constitute only a small proportion (5 percent) of the total livestock population.
Social Welfare
In spite of making considerable progress on the economic front, particularly in the agricultural sector, Haryana has not shown equally en-
12National Sample Surveys Organisation, 50th Round, 1993–1994.
Page 139
|
Number (thousands) |
Percent Change |
||
|
Animal |
1972 |
1992 |
1972–1992 |
|
Cattle |
|||
|
Adult male |
948.0 |
557.4 |
−41.20 |
|
Adult female |
726.0 |
716.2 |
−0.13 |
|
Young stock |
777.0 |
860.0 |
10.68 |
|
Total |
2,451.0 |
2,133.6 |
−12.95 |
|
Buffalo |
|||
|
Adult male |
61.8 |
246.5 |
298.86 |
|
Adult female |
1,283.1 |
2,262.5 |
76.33 |
|
Young stock |
1,173.0 |
1,863.9 |
58.90 |
|
Total |
2,517.9 |
4,372.9 |
73.67 |
|
Others |
|||
|
Camels |
132.8 |
128.3 |
−3.38 |
|
Horses and mules |
33.3 |
75.2 |
125.82 |
|
Donkeys |
72.7 |
73.6 |
1.24 |
|
Sheep and goats |
937.5 |
1,843.2 |
96.61 |
|
Pigs |
143.2 |
517.3 |
261.24 |
|
Poultry |
963.3 |
8,580.2 |
790.71 |
|
Draft animals |
|||
|
Cattle |
948.0 |
557.4 |
−41.20 |
|
Buffalo |
61.8 |
246.5 |
298.86 |
|
Camels |
132.8 |
128.3 |
−3.38 |
|
Other (horses, mules, etc.) |
106.0 |
148.8 |
40.37 |
|
Total |
1,248.6 |
1,081.8 |
−13.42 |
|
Milch bovine |
|||
|
Cattle |
717.0 |
702.8 |
−1.99 |
|
Buffalo |
1,273.0 |
2,219.7 |
74.36 |
|
Total |
1,990.0 |
2,922.5 |
46.86 |
SOURCE: Livestock Census, 1972 and 1992.
couraging results in reducing its population growth rate, which is currently 2.5 percent. The National Family Health Survey indicates that fertility rates are lower among women in urban areas than those in rural areas and are inversely proportional to the level of education of women ( Table 6-23). Furthermore, urban households have lower infant mortality rates than rural households. Infant mortality rates seem to decline with higher levels of education among women and with the availability of maternal and prenatal care.
High income standing and relatively high human development in Haryana do not appear to translate into improved welfare for all segments of society. Of the sixteen major states of India, Haryana ranks third
Page 140
|
Background Characteristic of Woman |
Desired Fertility Rate (desired number of children per woman in the 15–45 age group) (1) |
Total Fertility Rate (number of children per woman in the 15–45 age group) (2) |
Infant Mortality Rate (number of infant deaths per thousand live births) (3) |
Under 5 Mortality (number of deaths in the age group 0–5 per thousand children below 5 years of age) (4) |
|
Residence |
||||
|
Urban |
2.16 |
3.14 |
59.20 |
80.60 |
|
Rural |
3.05 |
4.32 |
86.20 |
116.40 |
|
Education |
||||
|
Illiterate |
3.33 |
4.69 |
86.60 |
121.80 |
|
Literate |
||||
|
Less than middle school completed |
2.58 |
3.52 |
77.20 |
95.50 |
|
Middle school completed |
2.26 |
3.48 |
66.00 |
68.50 |
|
High school completed |
2.06 |
2.75 |
46.30 |
50.80 |
|
Medical maternity care |
||||
|
No prenatal or delivery care |
87.00 |
113.70 |
||
|
Either prenatal or delivery care |
71.00 |
84.40 |
||
|
Both prenatal and delivery care |
57.07 |
68.70 |
||
|
Total |
2.81 |
3.99 |
79.70 |
107.60 |
NOTE: Information in columns (1) and (2) refers to the three years preceding the survey. Information in columns (3) and (4) refers to the 10-year period preceding the survey.
SOURCE: National Family Health Survey (NFHS) 1992–1993: India, Haryana, Kerala, Tamil Nadu, Uttar Pradesh. International Institute for Population Sciences, Bombay.
Page 141
in income and sixth in human development. Yet Haryana ranks ninth in terms of a gender-related health index and tenth in female literacy rate, indicating that females appear to be at a disadvantage in social status, health, and education.
CONCLUSION
Known as a Green Revolution state, Haryana has become the bread-basket of India, playing a crucial role in the food security of the nation. Because Haryana's rice and wheat production far exceeds the demand for these two crops by the local population, the state has become a net exporter of these crops to the rest of the nation. Most of the production surpluses are procured by government agencies for sale through public distribution system networks in India.
The Green Revolution also brought profound changes in land use in Haryana through a complex set of interacting biophysical and socioeconomic factors. The driving forces behind land use change in both semiarid and arid regions are increased cultivation intensity, utilization of high-yielding varieties of wheat and rice, and high inputs of fertilizer and water. Other forces are infrastructure development, private investment in irrigation sources, and a wheat/rice support policy regulated by the government of India.
Even though Haryana has benefited from its enormous agricultural achievements brought about by the Green Revolution, its success is built on a receding water resource. Intensification of agriculture has caused the groundwater table to drop in some areas and has caused waterlogging in others. The economic growth resulting from urbanization, industrialization, and the changing lifestyles of an increasing population also has led to overextraction of groundwater. Equally worrisome, excessive use of fertilizers and pesticides has led to a deterioration of land and soil quality.
To cope with falling water tables, farmers often must replace their pumps with higher-capacity ones and incur higher capital and operating costs to pump the same amount of water from a greater depth. The thousands of farmers with small operational holdings in Haryana who meet a large part of their staple food requirements from rice and wheat are unlikely to comprehend the long-term problems of resource degradation and environmental pollution and thus are likely to continue this lucrative cropping system. Such a development could deteriorate the environmental resource base and make the rice–wheat cropping sequence environmentally unsustainable. In response, researchers are trying to identify technologies that are more resource conserving and less environmentally polluting. Government policy initiatives also could be used to encourage farmers to adopt such technologies, thereby enhancing food security and environmental sustainability.
Page 142
In fact, government policies are responsible for changes in land use patterns aimed at intensification of agriculture and development. These policies generally give priority to expansion of canals and groundwater irrigation through large-scale investments, the provision of subsidized electricity for tube wells, credit and marketing facilities, crop output price supports, and other institutional support. The policies related to infrastructure development and pricing of crop inputs and outputs seem to be the most crucial.
While the Green Revolution has contributed to achieving food security in Haryana as well as in the country at large, environmental constraints arising out of the shifts in cropping patterns in favor of crop rotation such as rice–wheat are beginning to surface. The development policies aimed at increasing the production of cereal grains did not take into consideration the possible effects of these policies on the environment and the use of natural resources. Some of the research results indicate that factor productivity and the input use efficiency of the system are declining and that crop yields in the system lack sustainability. Average crop yields have been increasing, yet the rate of increase in crop yields is on the decline; they have not been rising in proportion to the increased use of inputs. As a result, although the rice–wheat farming system is still financially profitable and economically viable, the profitability of the system is declining. Thus the sustainability of the Green Revolution in Haryana in economic, social, and environmental terms is now a matter of serious concern.
ACKNOWLEDGMENTS
This paper is based on Vashishtha et al. (1999), the project report prepared for the Indian National Science Academy and the National Research Council, USA. The authors are grateful to P. S. Ramakrishnan for being a constant source of encouragement to the study team at all stages of this study, to Gordon M. Wolman for steering the proceedings of the Tri-Academy meetings, and to Michael Greene for a very patient and meticulous handling of both academic and administrative problems of the project. The authors would also like thank their colleagues C. S. C. Sekhar and Narinder Singh for data management, Soma Bhattacharya for her efficient and untiring research assistance in bringing the study to the present form, Moolchand and S. P. Sharma for helping in field trips, and N. L. Sharma and Munish Sindwani for providing overall administrative and secretarial support. Thanks are due to the Indian National Science Academy, particularly to A. K. Jain, collaboration with whom made the implementation of the project possible.
Page 143
REFERENCES
1995 . Extent and utilisation of groundwater resources in Haryana. In: Proceedings of 2nd Dr. D. P. Motiramani Memorial Lecture and Panel Discussion on Agricultural Water Management: Issues and Priorities, October 21, 1995, Chaudhary Charan Singh Haryana Agricultural University , Hisar .
1995 . Water management in rice–wheat cropping system in Haryana. In: Proceedings of 2nd Dr. D. P. Motiramani Memorial Lecture and Panel Discussion on Agricultural Water Management: Issues and Priorities, October 21, 1995, Chaudhary Charan Singh Haryana Agricultural University , Hisar .
1998 . Sustainability of Land and Water Resources in Haryana: Some Ecology–Economy Interactions. Report submitted to Agricultural Economic Research Centre (AERC), University of Delhi , Delhi .
, and . 1996 . Impact of GATT on Punjab Agriculture. Chandigarh : Institute for Development and Communication .
Chaudhary Charan Singh Haryana Agricultural University (CCSHAU) , Hisar . 1996–1997 . Indo–Dutch Operational Research Project on Hydrological Studies. Project initiated by CCSHAU, Hisar; International Institute for Land Reclamation and Improvement, The Netherlands; and DLO Win and Staring Centre for Irrigated Land, Soil and Water Research, The Netherlands.
, and . 1997 . Water Use in the Punjab Region: Conflicts and Frameworks for Resolution. Paper presented at the IDPAD Seminar on Managing Water Scarcity: Experience and Prospects, Amerfoort, The Netherlands, October 1997.
, and . 1991 . Taking Stock: Animal Farming and the Environment. Worldwatch Paper 103, July.
, and . 1987 . The economics of adverse groundwater conditions in Haryana state. Indian Journal of Agricultural Economics 42(April–June) .
1997 . Human population and water: Meeting basic needs in the 21st century. In: Population, Environment and Development, R. K. Pachauri and L. F. Quershy, eds. New Delhi : Tate Energy Research Institute .
. 1992 . Model Bill to Regulate and Control the Development of Groundwater. Ministry of Water Resources, Government of India.
, 1998 . Haryana : Current population scenario, problems, policies and strategic thrust areas for the future. Photocopy.
. 1998 . Decline in Crop Productivity in Haryana and Punjab: Myth or Reality? Report of the Fact-Finding Committee, Indian Council of Agricultural Research , New Delhi .
, and . 1991 . Sustainability of existing farming system in Punjab and Haryana—Some issues in groundwater use. Indian Journal of Agricultural Economics 46(July–September) .
, and . 1998 . Electricity Pricing and Sustainable Use of Groundwater: Farmers' Willingness to Pay for Electricity in Haryana. Paper presented at the Third Applied Development Economics Workshop, Centre for Development Economics, Delhi School of Economics, January 15–17, 1998.
. 1991 . Manual on Water Supply and Treatment. 3d ed. Prepared by the Expert Committee Constituted by Government of India, Central Public Health and Environmental Engineering Organisation, Ministry of Urban Development , New Delhi , March.
. 1992 . Agro-Ecological Regions of India. Indian Council of Agricultural Research , Nagpur .
Page 144
1994 . Historic Land Use and Carbon Estimates for South and Southeast Asia, 1880–1980. Environmental Sciences Division Publ. No. 4174. ORNL/CDIAC-61 NDP-046, Oak Ridge National Laboratory .
1995 . Efficient utilisation of canal water. In: Proceedings of 2nd Dr. D. P. Motiramani Memorial Lecture and Panel Discussion on Agricultural Water Management: Issues and Priorities, October 21, 1995, Chaudhary Charan Singh Haryana Agricultural University , Hisar .
1994 . Environmental Impact of Groundwater Development. Paper presented at the Regional Workshop on Environmental Aspects of Groundwater Development, Kurukshetra, Haryana, October 17–19, 1994.
1995 . Disposal of drainage effluent options for Haryana. In: Reclamation and Management of Waterlogged Soils, K. V. G. K. Rao, ed. Reclamation and Management of Waterlogged Saline Soils, National Seminar Proceedings, April 5–8, 1994, Central Soil Salinity Research Institute , Karnal, Haryana .
1997 . Strategy for Water Logging and Flood Control in Canal Commands of the Semiarid Region. Paper accepted for 7th ICID International Drainage Workshop, November 17–21, 1997.
, , and . 1999 . Interactions between Population Growth, Consumption and Land Use Change in Haryana (India). Research Study No. 99/2, Agricultural Economics Research Centre, University of Delhi, Delhi.


