
Page 7
1
Carbon Management: The Challenge
James A. Edmonds, J. F. Clarke, and J. J. Dooley
Pacific Northwest National Laboratory 1
The Framework Convention on Climate Change (FCCC) was negotiated in Rio de Janeiro in 1992 and entered into force on March 21, 1994. It has been ratified by 186 parties, including the United States. 2 The ultimate objective of the FCCC is set forth in Article 2:
The ultimate objective of this Convention and any related legal instruments that the Conference of the Parties may adopt is to achieve, in accordance with the relevant provisions of the Convention, stabilization of greenhouse gas concentrations in the atmosphere at a level that would prevent dangerous anthropogenic interference with the climate system. Such a level should be achieved within a timeframe sufficient to allow ecosystems to adapt naturally to climate change, to ensure that food production is not threatened and to enable economic development to proceed in a sustainable manner.
In addition, Article 3 of the FCCC specifies that, “. . . policies and measures to deal with climate change should be cost-effective so as to ensure global benefits at the lowest possible cost.”
The FCCC established many important principles but left most of the critical details to be worked out by later conferences of the parties to the convention. For example, the objective of the convention is the stabilization of the concentration of greenhouse gases, but the level at which they should be stabilized is not specified. There is as yet no scientific basis for preferring one concentration limit to another,
1Disclaimer: This report was prepared as an account of work sponsored by an agency of the U. S. government. Neither the U. S. government or any agency thereof, nor Battelle Memorial Institute, nor any of their employees makes any warranty, express or implied, or assumes any legal liability or responsibility for the accuracy, completeness, or usefulness of any information, apparatus, product, or process disclosed, or represents that its use would not infringe privately owned rights. Reference herein to any specific commercial product, process, or service by trade name, trademark, manufacturer, or otherwise does not necessarily constitute or imply its endorsement, recommendation, or favoring by the U.S. government, any agency thereof, or Battelle Memorial Institute. The views and opinions of authors expressed herein do not necessarily state or reflect those of the U.S. government or any agency thereof. (Pacific Northwest National Laboratory, operated by Battelle Memorial Institute for the United States Department of Energy under Contract DE-AC06-76RLO 1830.)
2As such it differs from its more controversial cousins such as the Kyoto Protocol, which was negotiated in 1997 under the FCCC, but has not entered into force.
Page 8
and there likely will never be. 3 Preindustrial concentrations of carbon dioxide, for example, were in the neighborhood of 275 parts per million volume (ppmv). They had risen to 368 ppmv by 1999. Under a variety of scenarios this concentration rises to anywhere from 500 to more than 700 ppmv over the course of the twenty-first century.4
The natural carbon cycle governs the relationship between emissions and concentrations. Anthropogenic emissions originating from net changes in land-use and fossil fuel oxidation initially enter the atmosphere but are eventually partitioned between the atmosphere and the ocean. While the oceans ultimately take up much of the net release, a fraction of any net emission remains in the atmosphere for more than a millennium. As a consequence, the preindustrial level of 275 ppmv concentration of CO2 is no longer accessible in the present millennium without reversing the net flow from fossil fuel oxidation and land-use change.
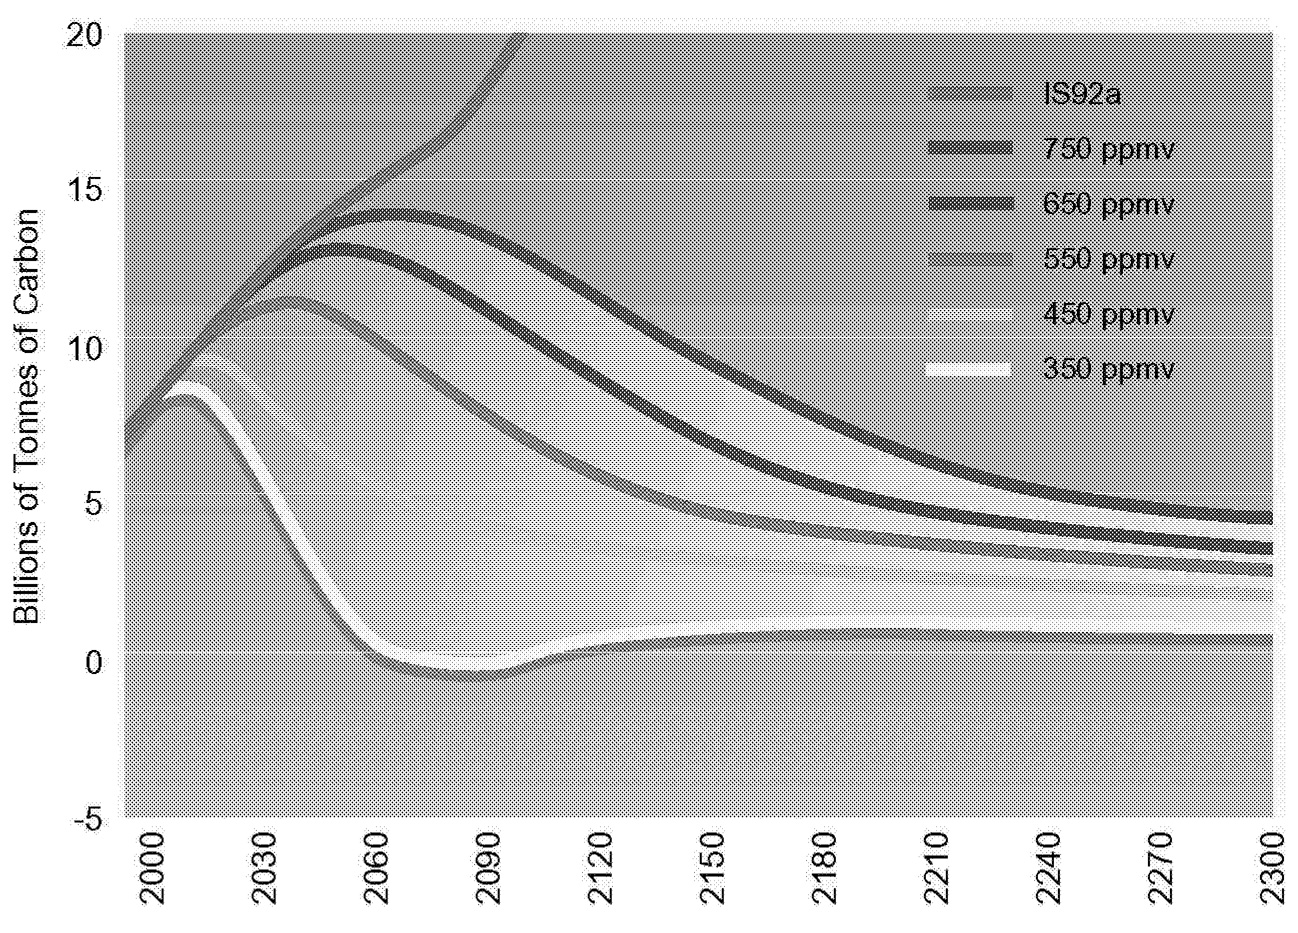
Stabilizing the concentration of CO2 in the atmosphere therefore implies that net emissions ultimately fall to zero from present levels, which are in excess of 6 petagrams of carbon per year (PgC/yr). 5 It is cumulative emissions that matter. Therefore, the particular time path of emissions will depend on the concentration to which atmospheric CO2 is limited. It also means that to satisfy the cost-effectiveness objective of the FCCC, emissions may rise before finally declining. Emissions trajectories consistent with five alternative concentration limits are shown in Figure 1.1. Key characteristics associated with emissions paths consistent with CO2 concentrations limits are shown in Table 1.1.
FACTORS SHAPING FUTURE GLOBAL CARBON EMISSIONS
Understanding the key drivers of historic and future carbon emissions is critical to developing policies to control emissions. Yoichi Kaya developed a simple analytical framework to understand the relationship between population, economic activity, energy, and emissions. He observed a simple identity that has significant analytical power:
C = (C/E)*(E/Y)*(Y/N)*N.
In this equation, C = carbon emissions per year, E = energy consumption per year, Y = GNP per year, 6 and N = population. It implies that the rate of change in carbon emissions is simply the sum of the rates of change of carbon intensity (C/E), energy intensity (E/Y), per capita income (Y/N), and population growth.
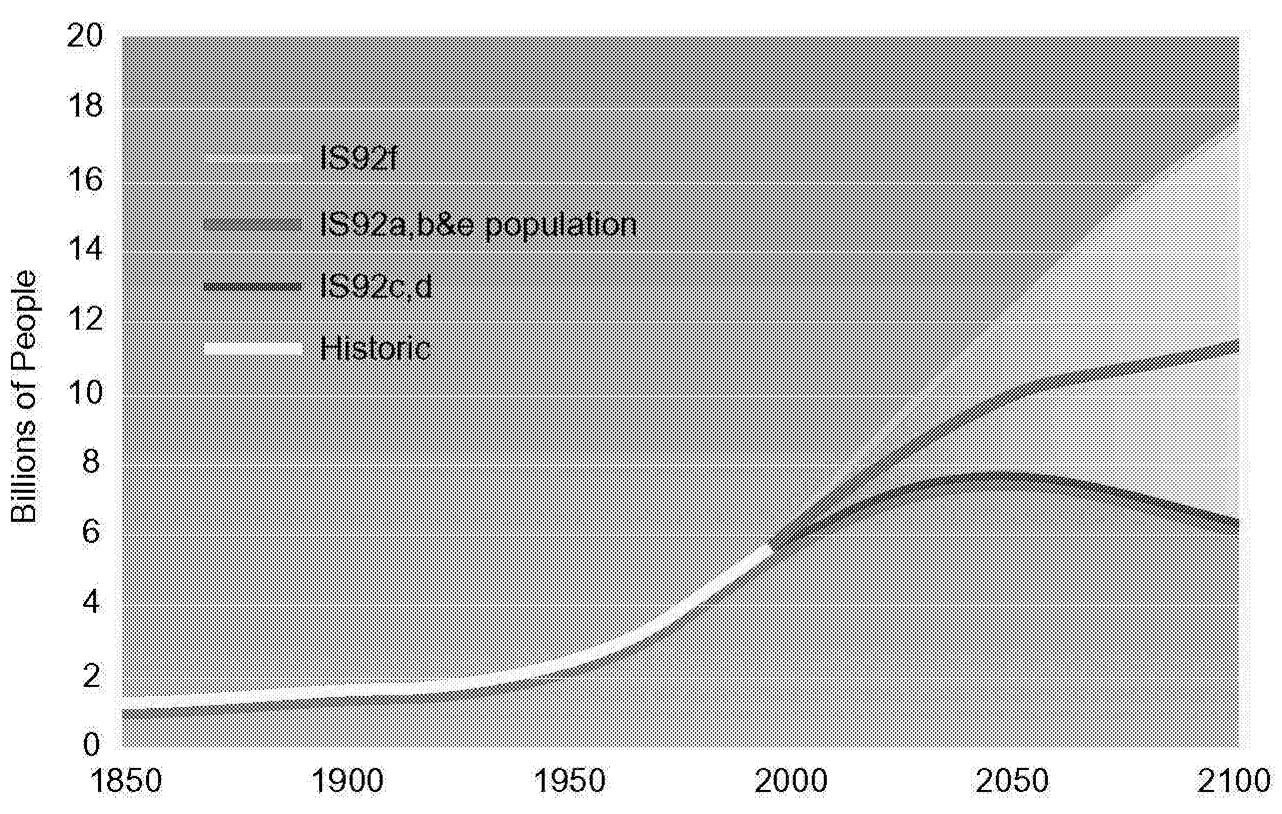
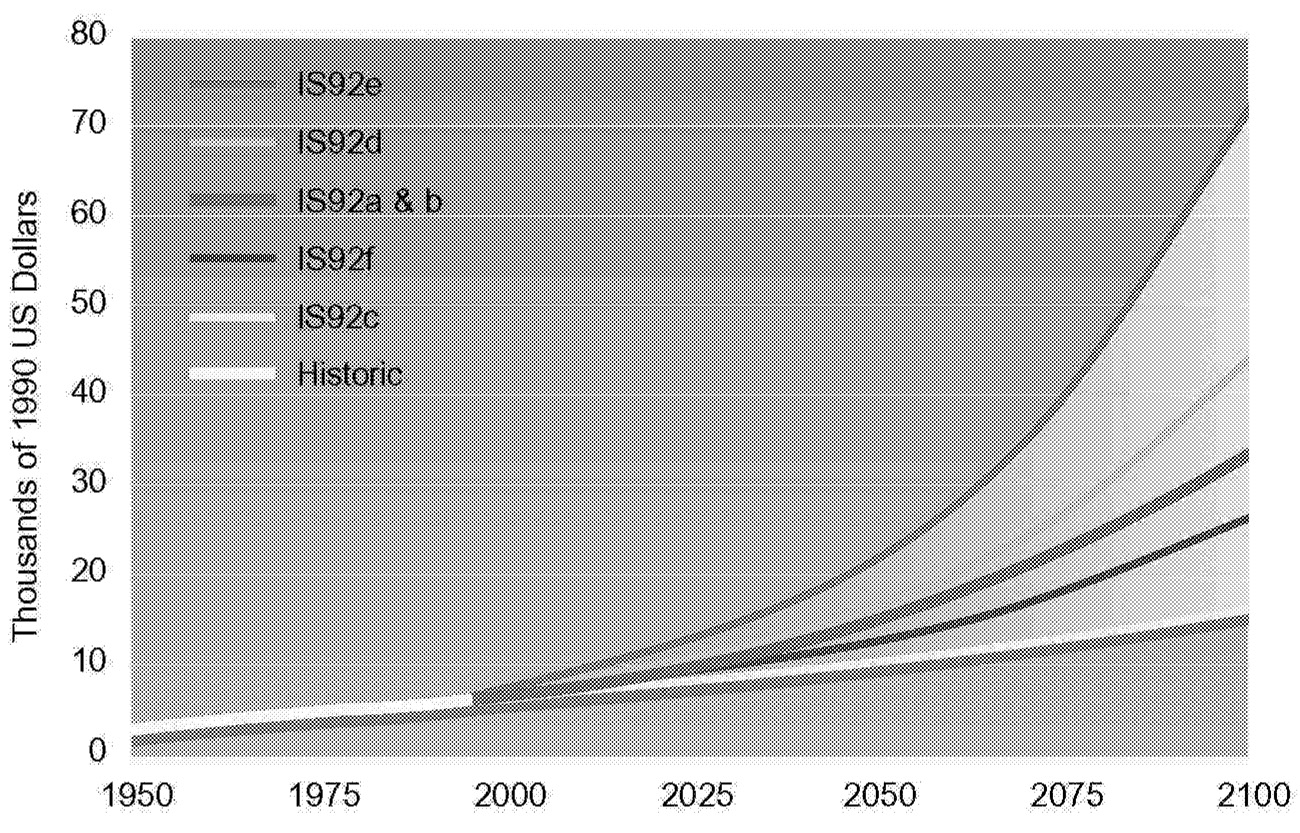
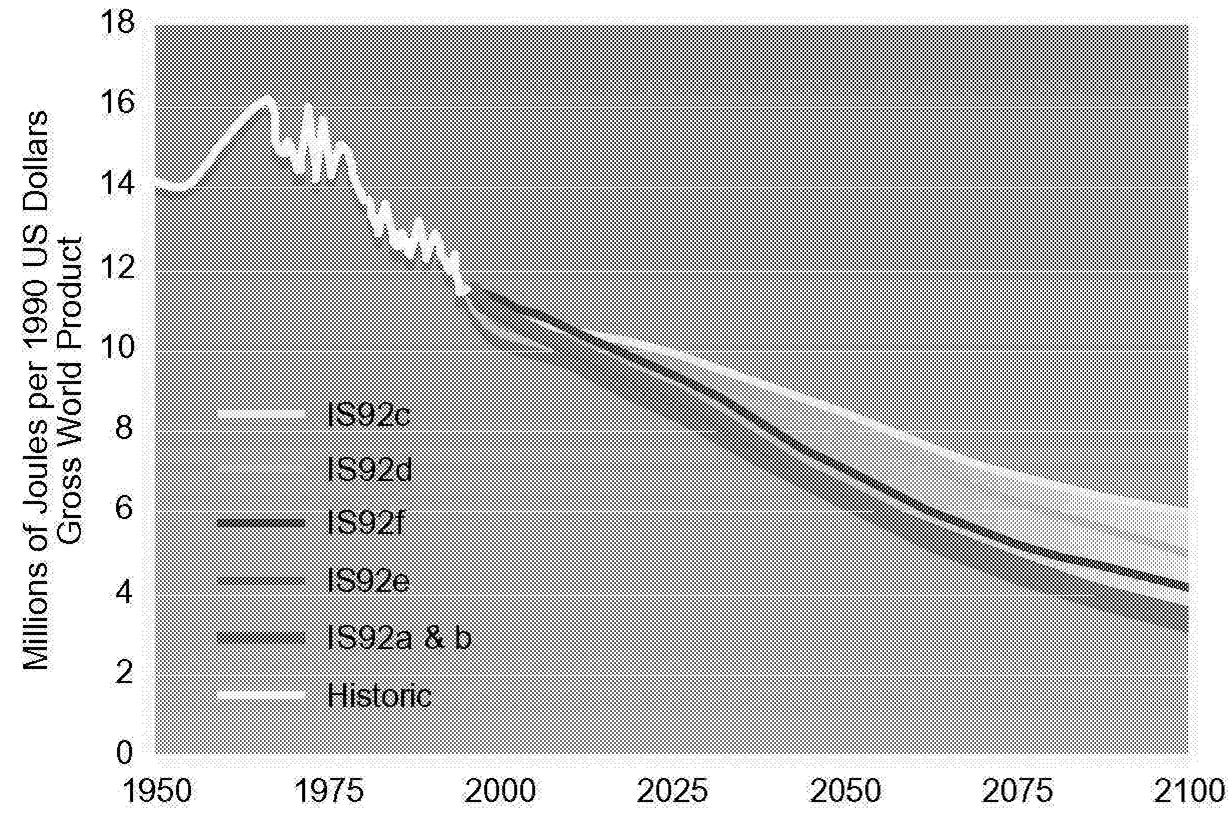
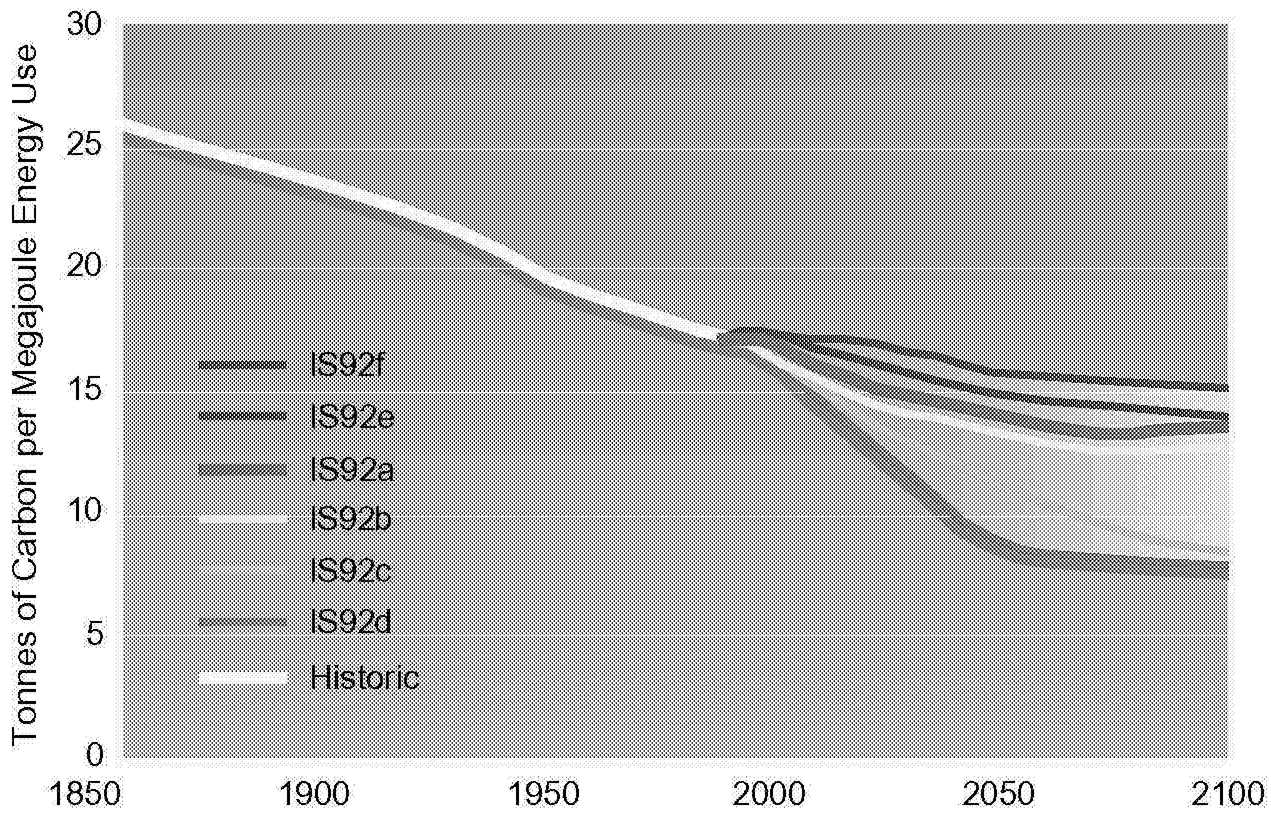
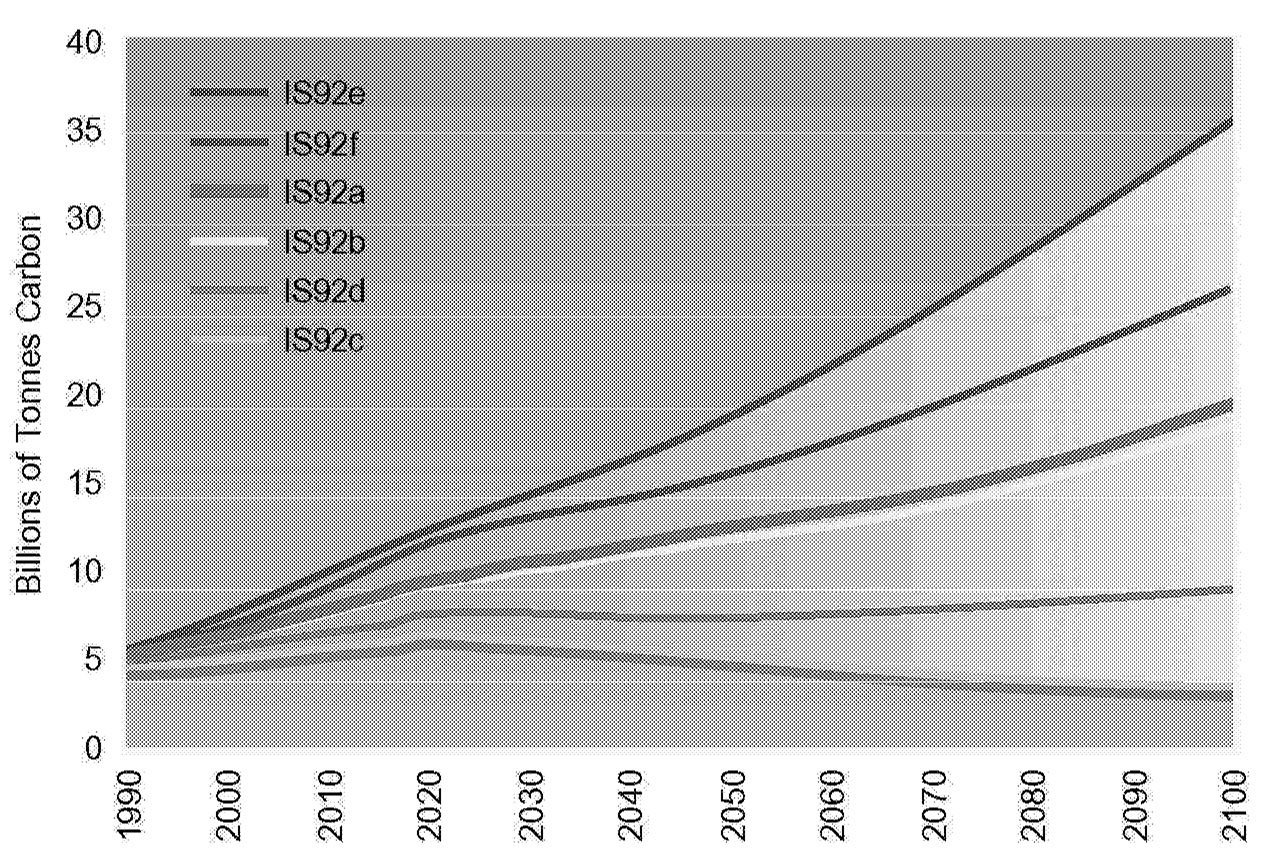
By using the above equation, historical trends can be examined and future analysis dissected. Figure 1.2, Figure 1.3, Figure 1.4 through Figure 1.5 show population, GNP per capita, energy intensity, and carbon intensity for historical and forecast years. Data for forecast years are taken from Pepper et al. (1992), which docu-
3There are multiple greenhouse-related gases. These include water vapor, carbon dioxide, carbon monoxide, methane, nitrous oxide, odd nitrogen compounds, the chlorofluorocarbons and their replacements, and aerosol compounds. Carbon dioxide is the most important human-released greenhouse gas from the perspective of potential change in future climate. Its principal source of emissions is fossil fuel use, however, land-use change in general and deforestation in particular also play important roles.
4See for example IPCC (1996a) and Nakicenovik et al. (2000), although the latter gives only emissions and cumulative emissions calculations.
51 Pg = 1 billion tonnes.
6In this equation GNP refers to “gross world product.” Therefore we use GNP to mean the value of all new final goods and services produced in the world in a given year. We continue to use the acronym GNP to avoid confusion with the concept of global warming potential (GWP), which is also found in the literature.
Page 9
~ enlarge ~
FIGURE 1.1 Net annual anthropogenic carbon emissions paths consistent with alternative CO2 concentration limits and the assumed population growth from the IS92a scenario of the Intergovernmental Panel on Climate Change. The curve marked IS92a assumes no CO2 concentration limit. The specified limit occurs in the year 2150.
ments the Intergovernmental Panel on Climate Change (IPCC) IS92 scenario series.7 Historical declines in carbon intensity and energy intensity have been more than offset by increases in population and GNP per capita. IPCC carbon emissions scenarios shown in Figure 1.2, Figure 1.3, Figure 1.4 and Figure1.5 span a range of trajectories. Most cases exhibit higher carbon emissions at the end of the twenty-first century than in 1990. All cases exhibit higher CO2concentrations at the end of the twenty-first century than in 1990. The range of
|
Ceiling (ppmv) |
|||||
|
350 |
450 |
550 |
650 |
750 |
|
|
Date when emissions are lower in the control case than in the reference case, IPCC IS92a |
Today |
2007 |
2013 |
2018 |
2023 |
|
Maximum global emission (PgC/yr) |
6.0 |
8.0 |
9.7 |
11.4 |
12.5 |
|
Year of maximum global emissions |
2005 |
2011 |
2033 |
2049 |
2062 |
|
Annual rate of long-term emissions decline (%) |
— |
1.1 |
0.8 |
0.6 |
0.5 |
|
Cumulative emissions, 1990 to 2100 (PgC) |
363 |
714 |
1,043 |
1,239 |
1,348 |
7The IS92 scenarios are a set of assumptions, the more significant of which concern population, economic growth, rate of end-use energy intensity improvement, and elasticity of demand for energy in developing nations.
Page 10
~ enlarge ~
FIGURE 1.2 Global population scenarios.
emissions scenarios developed by Nakicenovic et al. (2000) is similar to that explored by Pepper et al. (1992), in Figure 1.6.
Contrary to popular belief, 8 there is no practical resource limit to human ability to load fossil fuel carbon into the atmosphere. While the resource base of conventional oil and gas is limited, the amount of carbon stored in fossil fuels is not. Table 1.2 describes the distribution of carbon in fossil fuel resources. The amount of carbon stored in the form of conventional oil and gas is only about half the mass of carbon existing in the atmosphere. The amount of carbon stored in the form of coal resources could exceed the amount of carbon in the atmosphere by as much as an order of magnitude. Further, the
~ enlarge ~
FIGURE 1.3 Global GNP per capita under various scenarios.
8See for example Kaku (1997, p. 277)—“Within the next thirty years, fossil fuels will become increasingly scarce and prohibitively expensive.”
Page 11
~ enlarge ~
FIGURE 1.4 Energy-GNP ratio under different scenarios.
amount of carbon stored in the form of unconventional liquids and gases exceeds the carbon stored in the form of coal. There is no serious prospect for “running out” of fossil fuels during the course of the twenty-first century. Therefore, the idea that society will soon develop noncarbon energy forms to provide for growing energy demands, because there is no fossil fuel alternative, is unlikely.
TECHNOLOGY IN A REFERENCE FUTURE
Energy technology is assumed to evolve dramatically in reference scenarios, a feature that can go unappreciated. The IS92a scenario, for example, assumes that noncarbon energy forms are sufficiently inexpensive that by the end of the twenty-first century, approximately 75% of all electricity is provided by non-carbon-emitting sources. Similarly, commercial biomass is assumed to grow to the point that it
~ enlarge ~
FIGURE 1.5 Global carbon intensity under various scenarios.
Page 12
~ enlarge ~
FIGURE 1.6 Range of IPCC IS92 anthropogenic carbon emissions under various scenarios.
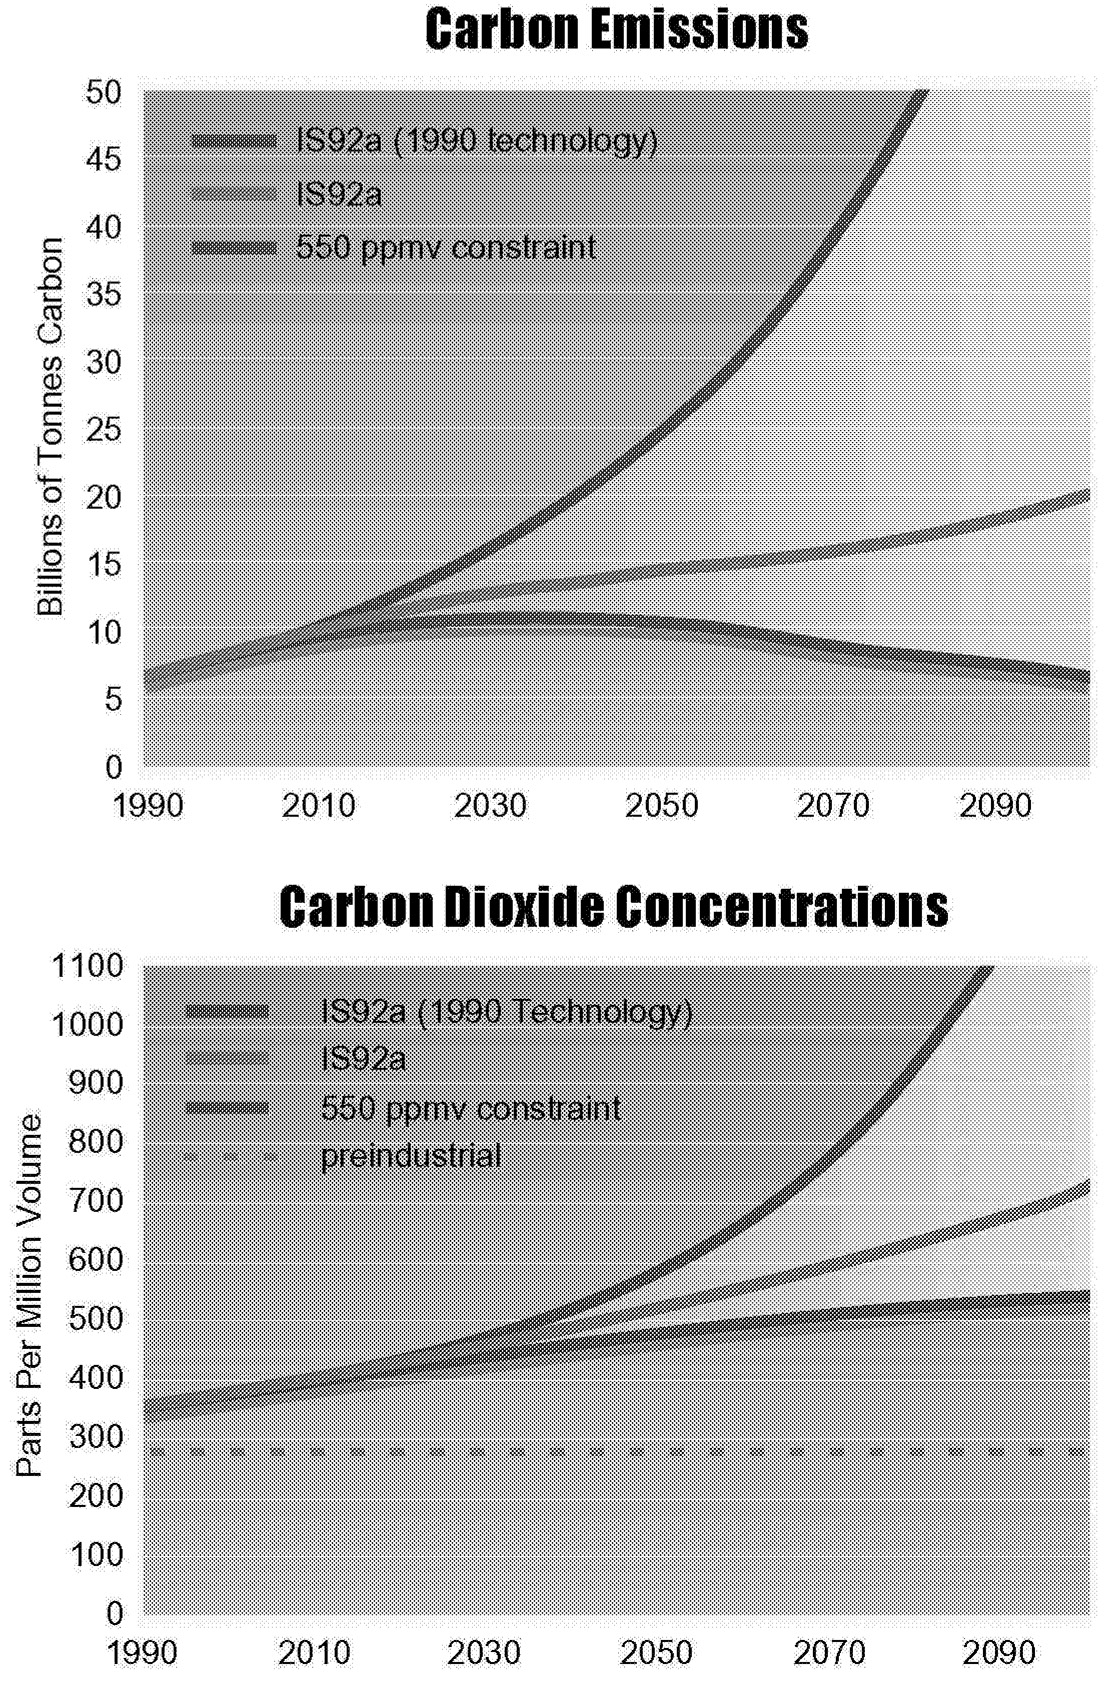
provides more energy than did all oil and gas production in the year 1990. This all happens in a “business-as-usual” scenario in which there is no explicit policy to address climate change. At the same time, end-use energy intensity continues to fall to less than half of the level in 1990. To understand the impact of these technological changes on the reference case, we have calculated the emissions under static 1990 technology assumptions and compare these with the reference scenario IS92a. The results of this calculation are shown in Figure 1.7.
The impact of assumed technological change on carbon emissions is huge. Yet the reduction in emissions brought about by these expected developments is insufficient to stabilize CO2 concentrations. Figure 1.7 shows a path that stabilizes CO2 concentrations at 550 ppmv. The selection of this concentration is arbitrary. As discussed earlier, other concentration limits could as easily have been selected. The
|
Energy Form |
Resource Base (PgC) |
Range of Resource Base Estimates (PgC) |
Additional Occurrences (PgC) |
Resources plus Additional Occurrences (PgC) |
|
Conventional oil a |
170 |
156-230 |
200 |
156-430 |
|
Conventional gas a |
140 |
115-240 |
150 |
115-390 |
|
Unconventional gas a |
410 |
— |
340 |
750 |
|
Coal a, b, c |
3,240 |
— |
3,350 |
3,240-6,590 |
|
Tar sands and heavy oils e, d |
720 |
600-800 |
— |
600-800 |
|
Oil shale c, e |
40,000 |
— |
— |
40,000 |
|
Gas hydrates a |
— |
— |
12,240 |
12,240 |
aIPCC (1996b p. 87).
bAssumes 50% unrecoverable coal in the resource base.
cRange estimates are not available due to the abundance of the resource.
dRogner, (1996).
eEdmonds and Reilly, (1985).
Page 13
~ enlarge ~
FIGURE 1.7 Comparison of carbon emissions and CO2 concentrations with and without technological change and compared to a 550-ppmv CO2 limit.
principal virtue of this particular number is that it happens to be approximately twice preindustrial concentration levels and much work in the climate sciences has employed this value.
The excess of carbon emissions associated with any reference trajectory over those needed to limit the concentration to some prescribed level can be thought of as defining a “gap.” Clearly the technology mix must change for that gap to be closed. Either new or improved energy technologies, or both, will be needed to close the gap.
THE ENERGY SYSTEM WITH AND WITHOUT AN EMISSIONS CEILING
To begin to explore the role of technology in filling the gap, we first construct a reference energy system and compare its evolution to an alternative path with a CO2 concentration limit. We have
Page 14
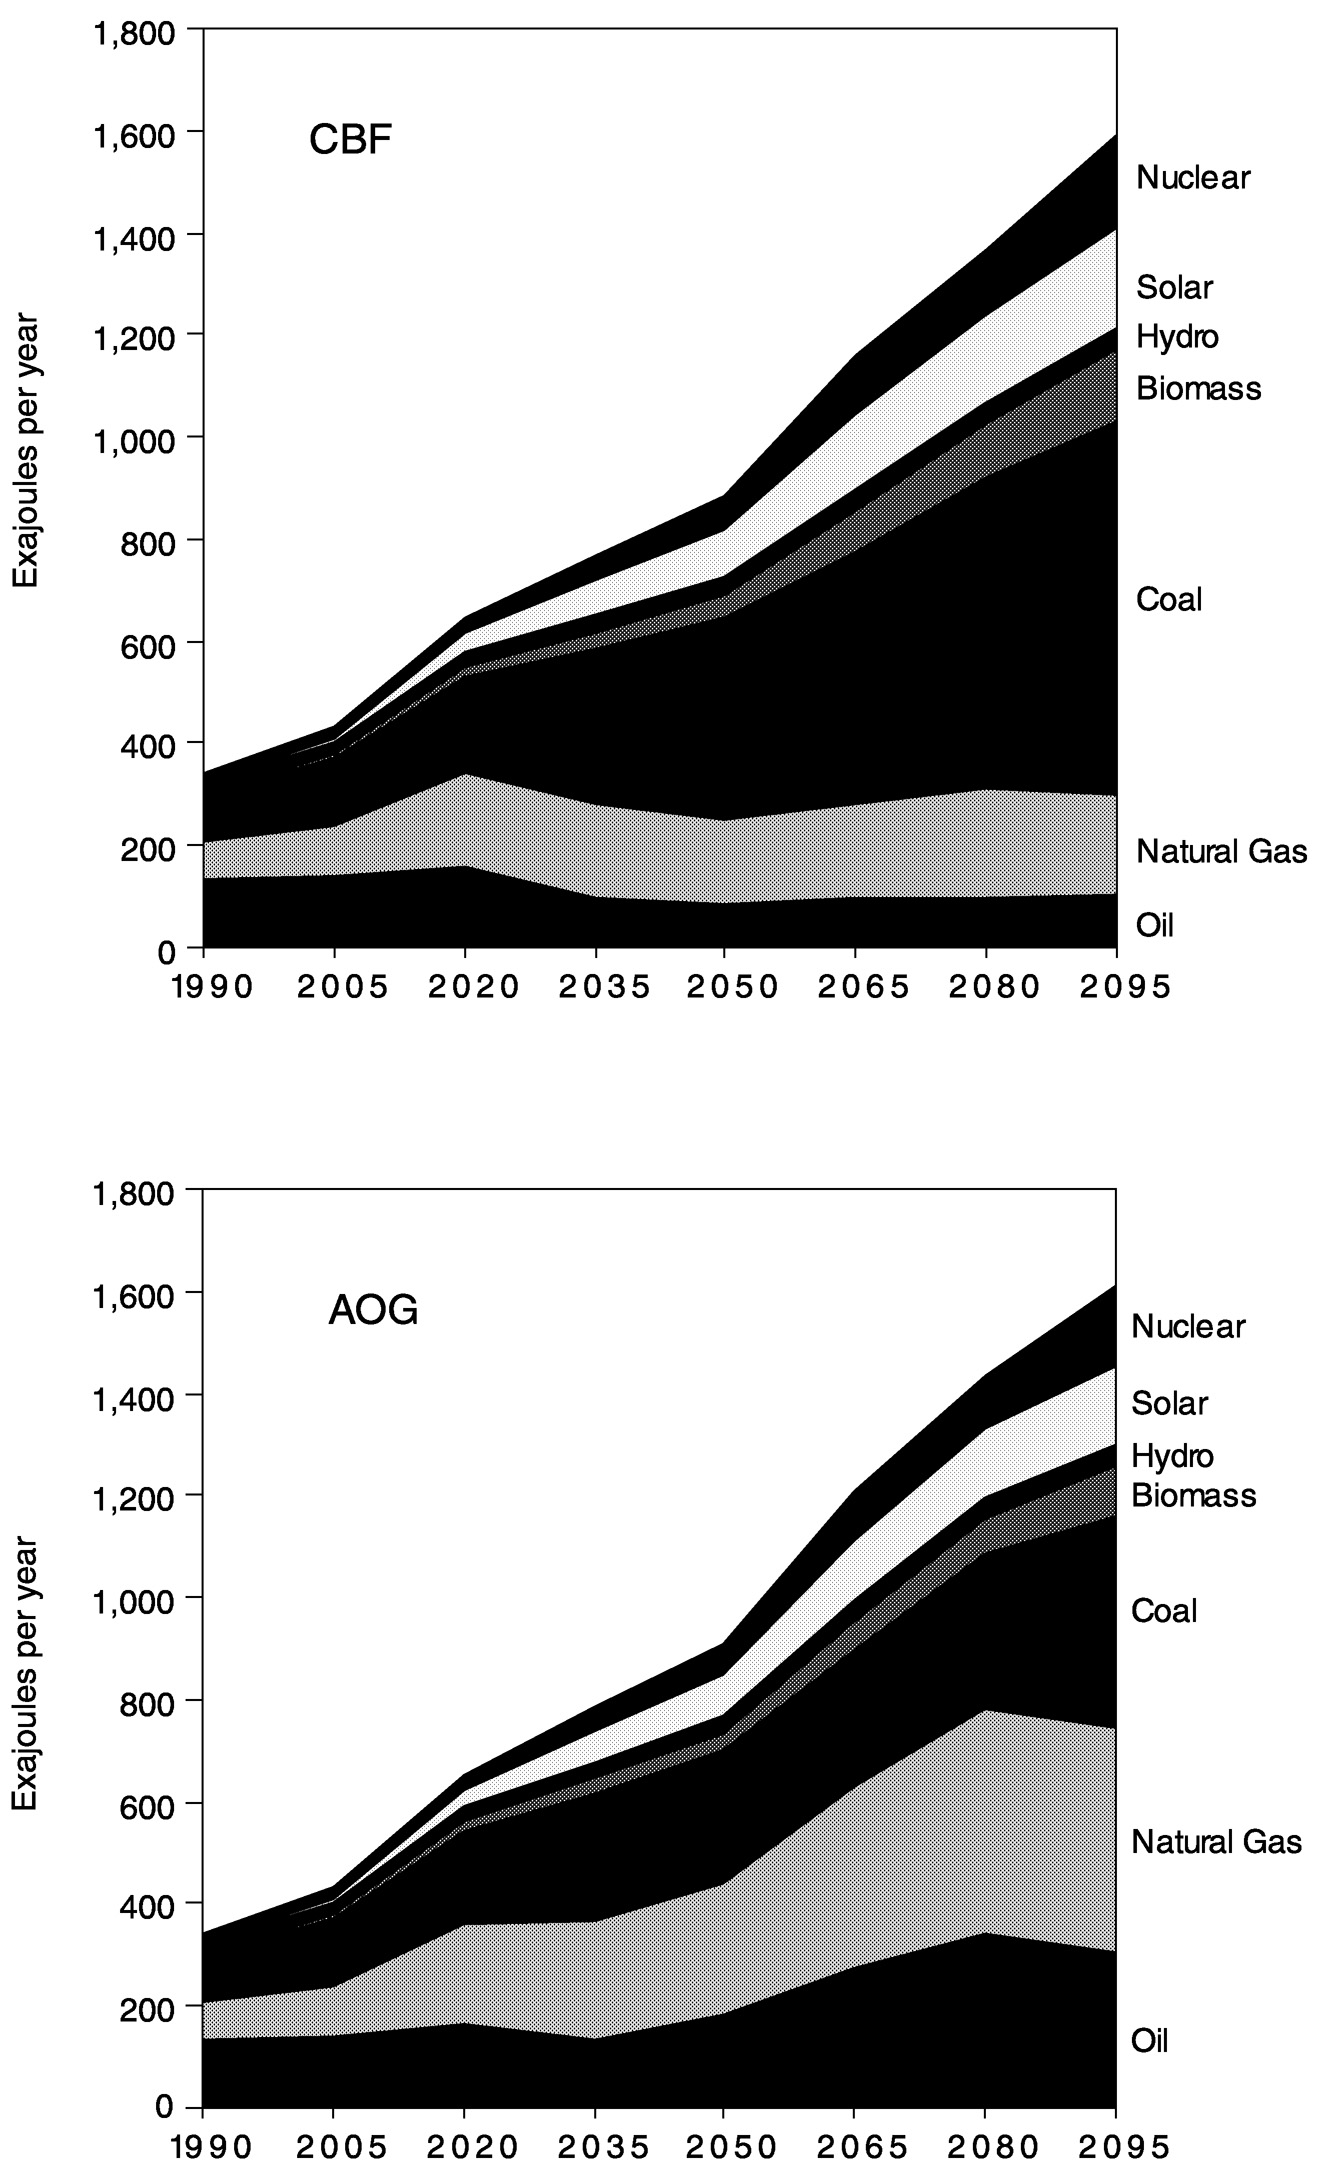
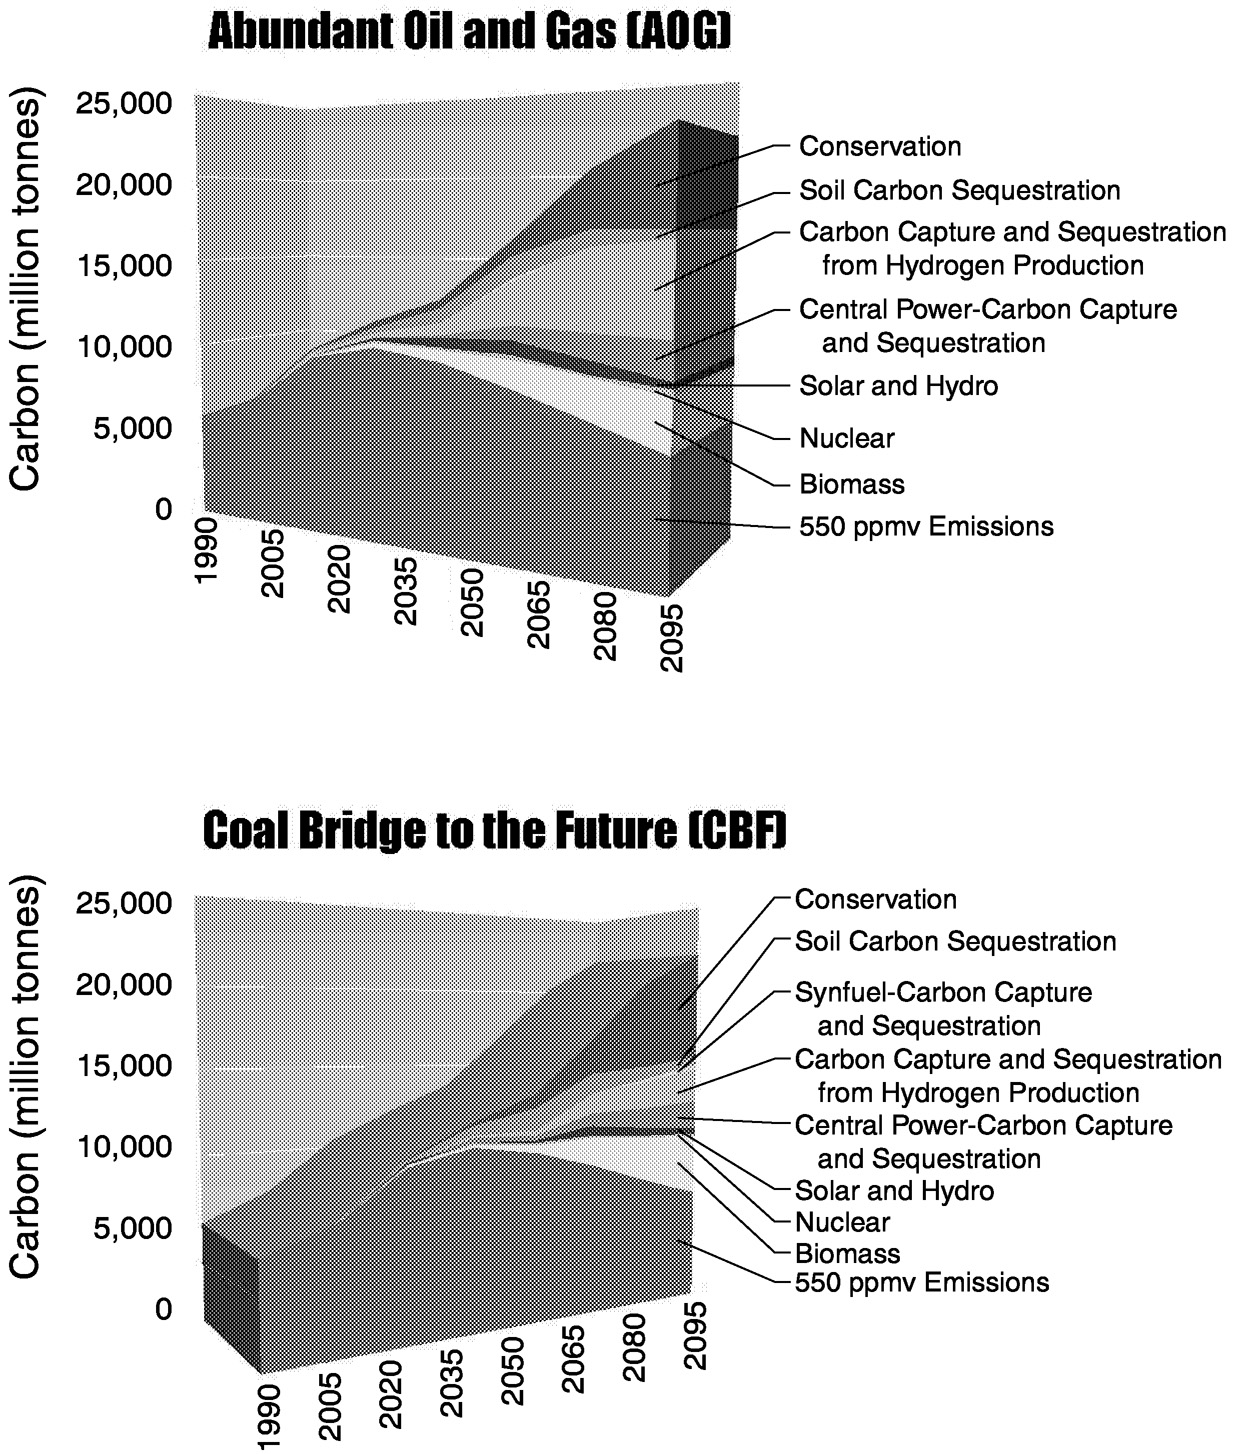
developed two alternative reference scenarios for global population, economy, energy, and agriculture. The first assumes a transition from the present conventional oil and gas-based world to a future world dominated by coal. This is a standard vision of the future (IPCC, 1995). We call this “coal bridge to the future” (CBF). The second reference case assumes that oil and gas, which are economically unattractive today, become available in the future, thus implying a world that continues to be dominated by oil and gas. We call this “abundant oil and gas” (AOG). This case is also known as “oil and gas future” (OGF).
Both of these energy worlds evolve against a background of continued productivity improvement in energy production, transformation, and end use. These two paths represent the two generic global energy system developments that are interesting from the perspective of climate policy. Either the world can continue to develop using oil and gas as the “backbone” of the global energy system, or it can transition to coal. In both of these cases, other energy forms play important and, in cases such as solar energy, growing roles as the future unfolds. However, the backbone of the world's energy system remains fossil fuels.
The two reference scenarios, CBF and AOG, depicted in Figure 1.8, paint alternative pictures of the overall energy system, although total primary energy and carbon emissions are similar. In CBF, the transition from conventional oil and gas to coal is accompanied by an increase in the price of liquids and gases (due to the higher cost associated with manufacturing coal-based synfuels and syngas) during the first half of the twenty-first century. This leads to lower future energy consumption in end-use applications, but the employment of a greater amount and more carbon-intensive primary energy implies relatively high primary energy demands and carbon emissions.
In the AOG scenario, oil and gas prices remain low because usable resources are never exhausted. The lower energy prices imply a higher level of final energy consumption, but the lower carbon content of the primary energy inputs to the system leaves carbon emissions similar to those of the CBF scenario. We also note that the lower energy prices imply a smaller contribution by renewable energy forms.
Our two reference cases, CBF and AOG, exhibit continued growth in fossil fuel emissions. This growth, in turn, is inconsistent with eventual stabilization of CO2 concentrations. Because we do not know whether or at what level concentrations will eventually be stabilized, we explore constraints that include 450, 550, 650, and 750 ppmv, as well as reference, (i.e., unconstrained) carbon accumulation.
A third, generic global energy system development path entails an evolution away from fossil fuels toward conservation, renewable, and nuclear energy forms (Shell Oil, 1995). This reference case is uninteresting from the perspective of this chapter because its accomplishment implies the stabilization of greenhouse gas concentrations in the reference case. There are no policy implications. The market takes care of everything. 9
We compute the cost of achieving each of these alternative objectives under a specific policy regime. This policy regime assumes a coalition of all of the world's nations to mitigate emissions, though there may be compensating transfers of income among nations. At any point in time, we show all economic agents in the model, in all regions. A common value of carbon is to be included in all economic decision making. 10 This strategy minimizes the cost of emissions mitigation at each and every point in time.
9Although it is possible, we consider a self-stabilizing reference case unlikely. Fossil fuel resources are abundant, and although costs have been highly variable in the short term, they have proved relatively stabile over the long term.
10The value of carbon is the premium associated with net carbon emissions that should be employed in all internal planning by energy producers and users to satisfy the associated carbon constraint.
Page 15
~ enlarge ~
FIGURE 1.8 Reference case energy emissions for the coal bridge to the future (CBF) and abundant oil and gas (AOG) scenarios. AOG is also known as oil and gas future (OGF).
Page 16
Costs of achieving stable carbon concentrations could be significantly greater if policy interventions undertake expensive emissions mitigation too early in the twenty-first century or if significant portions of the world remain outside the coalition. 11
Interactions between population, economy, energy, agriculture, land use, greenhouse gas emissions, and atmospheric dispositions are modeled using MiniCAM 98.3. This is an updated version of the MiniCAM model described in Edmonds et al. (1996, 1997). The energy component of the MiniCAM 98.3 has its origins in Edmonds and Reilly (1985). The energy module has been extended and upgraded on numerous occasions. The most recent enhancements are documented in Edmonds et al. (1986) and Kinzey et al. (1998).
TECHNOLOGIES AND THE EMISSIONS GAP
For the gap to be filled with technologies that are not in the reference case, two things must come to pass. First, there must be a credible expectation that the emission of carbon to the atmosphere will be limited. This can be accomplished in a number of ways. Most of the alternatives are economically inefficient. That is, they require more resources to be expended than necessary and thereby foreclose more options than necessary. In the analysis presented here, we assume an economically efficient solution, not because we believe it to be the most likely outcome, but rather because it is unique. There are many ways to be inefficient.
Beyond a commitment to limit carbon concentrations, there must also be a parallel commitment to control cost. Without cost control, the commitment to limit emissions will either flag or be abandoned. The principal beneficiaries of CO2 concentration limits are not those presently alive, but rather those who will be alive in the future, especially in the second half of the twenty-first century. Also, while altruism is alive and well in the world, like other goods it is in limited supply. If the cost of limiting CO2 concentrations remains low, both lower concentrations and more current consumption can be had compared with a more costly regime. New and improved technologies that allow emissions of carbon to be controlled are an important source of cost control.
In addition to the advances that are assumed in the reference cases, we introduce several other technologies that are potentially important in a world of CO2 concentration limitation. These include technologies that allow carbon to be captured and sequestered, capturing the carbon either directly at the source or at sites far removed from the emission and using either terrestrial or geological sinks.
CO2 Capture from Electric Power Generation
It has long been known that CO2 can be captured from the exhaust stream of a combustion cycle. However, the capture of CO2 from the waste stream of a plant requires energy and capital investments. We assume that the efficiency of carbon capture will increase with time (i.e., new and improved technologies and processes will come on-line that reduce the energy penalty associated with powering the capture systems). Herzog et al. (1997) state that the eventual integration of these systems into the overall design of new fossil-fueled power plants—such as integrated gasification combined cycle (IGCC) power plants—holds forth the promise of reducing the cost of CO2 capture significantly. Further, recent research indicates that targeted basic science programs could lead to advancements that over time would
11Manne and Richels (1997) have shown that deviation from a cost-effective path can multiply the cost of complying with an atmospheric concentration ceiling such as 550 ppmv. Richels et al. (1996) showed that, if significant regions remain outside an emissions control regime, costs escalate.
Page 17
improve the performance and reduce the costs of these systems (Dooley and Edmonds, 1997). We assume that the phasing in of these more efficient capture technologies occurs gradually and is completed 50 years after the initiation of carbon capture.
In addition to the energy cost of capture, there are additional capital investment requirements for a CO2 capture system. Our cost estimates are based largely on the work of Gottlicher and Pruschek (1997) and their comprehensive survey of more than 300 studies of CO2 removal systems from fossil-fueled power plants. Gottlicher and Pruschek's estimates of the performance of these CO2 removal systems are based on the “present status of the technology,” and therefore we once again adopt the same assumption about costs decreasing over time. Given the wide range of cost reported by Gottlicher and Pruschek (1997), we adopt a midrange cost from their survey (see Table 1.3).
CO2 Transport Costs
For the foreseeable future, the vast majority of research for disposal applications is likely to be focused on understanding and mitigating environmental concerns that arise from disposal and is unlikely to be directed at reducing the cost of disposal (Freund and Ormerod, 1997). Freund and Ormerod (1997) cite estimates for transport and disposal cost that range from $4.7 to $21 per ton of CO2 depending upon whether the sequestration is to take place in a nearby depleted oil and gas well or a deep-sea trench that is located some distance from an onshore fossil-fueled power plant. In the absence of research that pairs current and future power plant sites with disposal sites on a global basis, we will assume an intermediate value of $55 per tonne of carbon ($15 per tonne of CO2) for all transport and disposal costs and hold this cost constant throughout the time period under study.
CO2 Capture and DisposalCosts for Fuel Transformation Technologies
CO2 will also have to be captured from fuel conversion facilities such as plants for the conversion of coal to synthetic liquids and gases. Herzog et al. (1997) state that the cost of CO2 capture from refineries will be comparable to or greater than the cost of capture from fossil-fueled power plants. Therefore, we assume that all conversion facilities and refineries will have performance characteristics similar to those for coal-fired plants. We summarize our assumptions for capture and disposal in Table 1.3. 12 The values
|
Coal |
Oil and Gas |
|
|
Energy penalty for carbon capture a |
37% declining to 9% |
24% declining to 10% |
|
Additional investment costs for capture system b |
54% declining to 33% |
54% declining to 33% |
|
Transport and disposal cost c |
$55/tonne of C |
$55/tonne of C |
|
Efficiency of capture b |
90% |
90% |
aHerzog et al. 1997.
12Note that the figures listed in Table 1.3 for “energy penalty for carbon capture” and “additional investment costs for capture system” are largely consistent with midrange estimates of these parameters published by the International Energy Agency Greenhouse Gas Programme (1996).
Page 18
in Table 1.3 are not representative of any given capture and sequestration system configuration but rather are meant to be averages for the entire suite of carbon capture and disposal technologies and systems that could be deployed in any number of possible combinations.
Fuel Cell Technology
Fuel cells are a complementary technology to carbon capture and sequestration. They allow hydrogen to be employed as a fuel for transportation, as well as disperse production of heat and power. In the absence of fuel cell technology, the transportation sector depends on batteries and fuels from biomass for emissions mitigation. Fuel cells are assumed to be capable of delivering electricity to both stationary and mobile applications. Our assumptions regarding fuel cell technology are given in Table 1.4.
Soil Carbon
Cole et al. (IPCC, 1996b) estimate that between 40 and 80 Pg of fossil fuel carbon emissions might be offset in existing croplands by applying soil carbon sequestration techniques over the course of the next 50 to 100 years. The estimates for cropland assume the restitution of up to two-thirds of the soil carbon released since the mid-nineteenth century by the conversion of grasslands, wetlands, and forests to agriculture. The experimental record confirms that carbon can actually be returned to soils in such quantities: carbon has been accumulating at rates exceeding 1 tonne per hectare per year in former croplands planted to perennial grasses under the Conservation Reserve Program (CRP) (Gebhart et al. 1994). Soil carbon increases ranging from 1.3 to 2.5 tonne per hectare per year have been estimated in experiments on formerly cultivated land planted to switchgrass, a biomass crop (Brown et al., 1998).
Managed forests, wetlands, and rangelands provide further opportunity for significant carbon storage. For example, when agriculture is converted (or allowed to revert) to forest vegetation in systems with very little management to improve growth, soil carbon may accumulate at rates ranging from near zero to 7 tonnes per hectare per year. In temperate regions, gains range from 0.2 to 0.6 tonne and average about 0.3 tonne per hectare per year (Jenkinson, 1971). Gains in tropical and subtropical forests are greater, ranging from 1.0 to 7.4, with an average of 2.0, tonnes of carbon per hectare per year (Ramakrishnan and Toky, 1981).
Many soil carbon-conserving practices are currently being implemented for reasons other than CO2
|
Energy Input-Output Ratio |
Levelized Cost for O&M and Capital ($/GJ H2 produced) |
|
|
Coal a |
1.292 |
4.66 |
|
Natural gas a |
1.115 |
1.72 |
|
Oil b |
1.2 |
3.0 |
|
Biomass a |
1.3 |
4.44 |
|
Electrolysis a |
1.1 |
2.36 |
aWilliams (1995).
bKaarstad and Audus, (1997).
NOTE: O&M=operation and maintenance.
Page 19
mitigation, such as to control erosion or to reduce production costs or labor. However, impediments to more widespread adoption include costs of initial investment in equipment, fear or reluctance to adopt new technologies, and increased risks during the adoption transition phase. Financial incentives could substantially increase the rate of adoption of carbon-sequestering practices and potentially provide a significant addition to farm income. We have not developed a cost of emissions mitigation schedule for these technologies. In many circumstances, these technologies can be expected to penetrate the market even in a reference scenario since their adoption yields a net benefit. Clearly, further work is required. In addition, we ignore the problem of institutional mechanisms to ensure that the required change in agricultural practices is actually carried out. The purpose of this exercise is to examine the potential contribution of soil carbon capture to an overall strategy of global carbon management.
For the purposes of this analysis, we assume that 40 to 80 PgC are offset over the course of the next century. Given that the rate of carbon uptake by soils is highly nonlinear, 13 we assume that the rate of uptake is four times greater in the initial year of activity than 100 years later.
Aforestation and Reforestation
The forestry sector is modeled explicitly in MiniCAM. As the extent of forested lands expands and contracts, the associated stocks of carbon change endogenously with implied fluxes. When carbon is valued, land use changes endogenously. Carbon stocks in forests tend to accumulate, other things being equal; however, the model does not accumulate carbon in forests indefinitely. Rather, these stocks are harvested and employed as commercial biomass to offset fossil fuel use. 14
Geologic Sequestration of CO2
Several types of reservoirs could be employed for long-term storage of CO2. The most obvious are oil and gas wells—both active and depleted—from which much of the CO2 originated in the form of fossil fuel, but this reservoir is limited in capacity. Larger reservoirs are also potentially available, including saline geological formations, caverns, salt domes, and deep oceans. Herzog et al. (1997) have estimated the capacity of various reservoirs ( Table 1.5).
Of these, oil and gas reservoirs are the most attractive. Active oil wells can utilize the carbon dioxide in tertiary recovery, and CO2 can be used as a sweep gas to promote the production of methane from certain types of coal deposits. Furthermore, because these geological formations have already demonstrated their ability to hold oil and gas, there are no obvious environmental consequences to long-term storage in such locations. The same cannot be said for deep oceans and deep saline geological formations. Those sites, although promising, hold potential uncertainties in retention and environmental impacts.
Ocean disposal presents special problems. In addition to the problem of verification, oceans are only a partial reservoir. In recalling the earlier discussion of the carbon cycle, introducing CO2 into the ocean through dispersion implies that a fraction of this quantity is committed to the atmosphere as well. The
13This nonlinear behavior is the consequence of the uptake rate of soils. While initially high, it declines with time as soil carbon content approaches the equilibrium, preindustrial level. We ignore potential interactions with atmospheric CO2 concentrations.
14Forest products can also be used in a variety of applications that prevent or delay their oxidization, such as building materials, railroad ties, and telephone poles. However, the scale of forest products potentially available under a program that removed significant quantities of carbon from the atmosphere would quickly lower the price of these products to zero.
Page 20
|
Range (PgC) |
||
|
Carbon Storage Reservoir |
Low |
High |
|
Deep ocean |
1,391 |
27,000 |
|
Deep saline geological formations |
87 |
2,727 |
|
Depleted gas reservoirs |
136 |
300 |
|
Depleted oil reservoirs |
41 |
191 |
ocean can be a permanent reservoir only if mechanisms can be found to isolate the carbon from the larger patterns of ocean circulation. The quantities of carbon captured over the course of the next century in the carbon-constrained scenarios examined here thus do not strain the potential capacity of total reservoirs.
However, while we recognize the potential of carbon capture and sequestration technologies to add an important new element to the set of climate mitigation technologies, it is also important to point out that these are part of a larger suite of technologies whose composition varies over time and space. The deployment of geological carbon capture and sequestration technologies may be limited by physical or technical considerations. It may also be limited by public acceptance, either locally or in general. Research can begin to address technical concerns, but experience will ultimately be needed to determine the acceptability of these technologies.
Sequestration of Carbon in Solid Form
None of the problems associated with sequestration are encountered if carbon is removed in the form of a solid. Lackner et al. (1995, 1997, 1999), for example, have investigated technologies that render the carbon as rock. As such it is highly stable, unlikely to return to enter the atmosphere, and for all practical purposes permanent.
Steinberg (1983, 1991, 1996,) and Steinberg and Grohse (1989) have examined processes that remove carbon in elemental form. Unlike the Lackner processes that react the carbon to rock, the Steinberg process leaves the carbon in a form that could potentially react if it is not properly disposed. However, if returned to depleted coal mines or other remote sites, the carbon could be monitored easily and verification of its location would be simple.
We have not explored these technologies in this analysis. Both are more expensive than the alternatives described earlier. However, they offer attractive monitoring and verification characteristics that may ultimately prove crucial.
FILLING THE EMISSIONS GAP
As noted earlier, stabilizing the concentration of carbon in the atmosphere requires global net carbon emissions to the atmosphere to peak then decline. In the model, this is accomplished by imposing a tax on the emission of carbon, which in turn induces technology substitutions relative to the reference case. A variety of policy instruments are available to society to signal the value of carbon. A tax is chosen because it leads to an economically efficient (least-cost) solution. However, without some signal
Page 21
from society that cumulative emissions will be limited, some variant of the reference case will emerge. In contrast to the suite of technologies that deploy in either the AOG or the CBF reference case, a wide range of low- and non-carbon-emitting energy technologies deploy more aggressively when CO2 concentrations are limited.
One way to depict the role of technologies that become more important in an efficient emissions limitation regime is to associate the carbon emissions reductions with the appropriate technology. This is done for a 550-ppmv CO2 concentration limit against a background of AOG and CBF in Figure 1.9. In this figure, emissions reductions are measured as the avoided carbon release associated with increased deployment of each technology. For example, as the carbon tax rises, more and more commercial biomass comes onto the market relative to the reference case and displaces carbon-emitting fuels (relative to the reference case). Thus, as time passes an ever-widening biomass wedge fills part of the gap. If a non- or low-carbon-emitting technology does not increase its absolute deployment as the value of carbon increases, no contribution is recorded by this method. As we show this approach can be extremely illuminating in some instances but can underrepresent the contribution of a technology in other instances.
~ enlarge ~
FIGURE 1.9 Comparison of technologies that fill the gap under alternative reference scenarios and a 550-ppmv CO2 limit. Abscissa in millions of tonnes of emitted carbon displaced by conservation, sequestration, and alternate energy-producing technologies.
Page 22
Several observations are worth making about these cases. We begin with the AOG case. First, technologies such as carbon capture and sequestration, commercial biomass, and hydrogen fuel cells that fill the gap are, with the exception of energy conservation, not presently significant contributors to the global energy system. Carbon capture and sequestration technologies, which expand dramatically, deploy only when carbon is valued. They do not deploy in a reference case. The presence of these technologies as a package reduces the minimum cost of achieving a 550-ppmv concentration limit by more than a factor of two.
Second, the technology portfolio changes over time. For example, soil carbon capture and sequestration are relatively important early on due to their low cost. Over time, their role declines due to both the exhaustion of the activity's potential and the rapid expansion in magnitude of the carbon emission mitigation requirement.
Third, some technologies are more important when others are also available. Hydrogen fuel cells are used extensively in conjunction with the capture and sequestration of carbon from the natural gas feedstock being used to obtain hydrogen. Natural gas, CH4, is inexpensive in the AOG scenario. Since natural gas is mostly hydrogen, it is relatively easy and inexpensive to remove the carbon and sell the hydrogen. Without the ability to sequester the carbon and keep it out of the atmosphere, fuel cells would be far less effective in filling the gap.
Fourth, some technologies expand their relative importance without expanding their absolute deployment. Solar and nuclear power are examples of technologies whose relative importance increases, but whose absolute deployments are roughly comparable in both the reference case and the carbon concentration limit case. Both dramatically expand their share of power generation capacity between the reference and the 550-ppmv-ceiling case. (In 2095, non-carbon-emitting power generation is 50% of output in the reference case, but it grows to 80% in the 550-ppmv-ceiling case.) This increase in relative importance without expanded absolute deployment is the consequence of the interaction of conservation and power generation technologies. The expanded deployment of energy conservation leads to a reduction in the rate of growth of electricity demand. With a lower rate of expansion, the shift in technology from fossil fuel power generation toward non-fossil fuel power leaves the rate of growth of non-fossil fuel power technologies approximately the same as in both the reference and the CO2 limit cases. As a consequence, the gap figure does not appropriately credit the contribution of solar and nuclear technologies to stabilizing the concentration of CO2. That understanding requires a deeper analysis.
Regional Diversity
The world is not a homogeneous place, and technology deployment varies strongly across regions and over time. Regional analysis indicates China, for example, has a relatively smaller expansion than India in the deployment of commercial biomass technology. Differences in technology expansion rates and emphasis can be traced to the multitude of resource, cultural, institutional, and policy environments that exist around the world.
Effect of Alternative Reference Technology Backgrounds
The paths of economic and technological development are difficult to predict. Contrast the CBF and AOG cases, for example. They differ by only one assumption—that lower grades of more abundant oil and gas become available at approximately current prices. This one assumption drives important differences in the technologies that are deployed to limit CO2 emissions.
If we focus on the change between the reference case and the carbon-limited case, we see both
Page 23
similarities and differences between CBF and AOG in Figure 1.9. In both CBF and AOG, soil carbon plays an important role early in the twenty-first century, but the role of carbon capture and sequestration from hydrogen production is greatly decreased in the CBF case compared to AOG. In contrast, the direct effects of energy conservation induced by the carbon tax are smaller in the CBF case than in AOG. After all, because cheap oil and gas are not available in the CBF reference case, end-use energy is already more expensive, and many conservation measures have already been implemented.
However, the indirect effects of energy conservation are significantly greater. Since much of the end-use energy in the CBF case is either electricity or synthetic liquids and gases derived from coal, there is an energy conversion penalty. Every joule of energy conserved at the point of use conserves 1 to 2 joules of the original fossil fuel resources—primary energy. Thus, significant reductions in emissions are associated with a smaller synfuels industry, which in turn is the direct consequence of increased energy conservation.
Commercial biomass production plays a more important role in both the AOG and the CBF cases. The higher energy prices imply greater profitability for commercial biomass, but the expansion is greater in the CBF case.
RISK MANAGEMENT
Stabilizing the concentration of greenhouse gases requires that the global energy system undergo radical change over the course of the twenty-first century. Reference energy systems by the end of the twenty-first century are dramatically different energy systems that stabilize the concentration of atmospheric CO2. The nature and composition of future energy systems are subject to many uncertainties.
Critical uncertainties include reference technology evolution (how good will the reference technologies turn out to be?), policy uncertainty (what concentration will ultimately be chosen, either explicitly or implicitly, as the concentration limit?), institutional uncertainty (what institutional mechanisms will be utilized to limit cumulative emissions—cap and trade, taxes, regulations?), regional diversity (what technologies will be needed in different regions around the world?), and investment uncertainties (which investments in R&D will be made, which will succeed, and which will fail?).
If the future technology evolution were known, and a technology portfolio were to be deployed rationally over space and time, the problem of framing a set of technology R&D investments would be difficult enough. Yet even under these relatively simple circumstances, our results show that no single technology dominates society's response to climate change. A regionally and temporally variable mix of technologies will emerge to form the global response to climate change. The existence of a multitude of additional uncertainties, only some of which are subject to human influence, greatly complicates the selection of an R&D portfolio that lays the foundation for a effective technological response to carbon management.
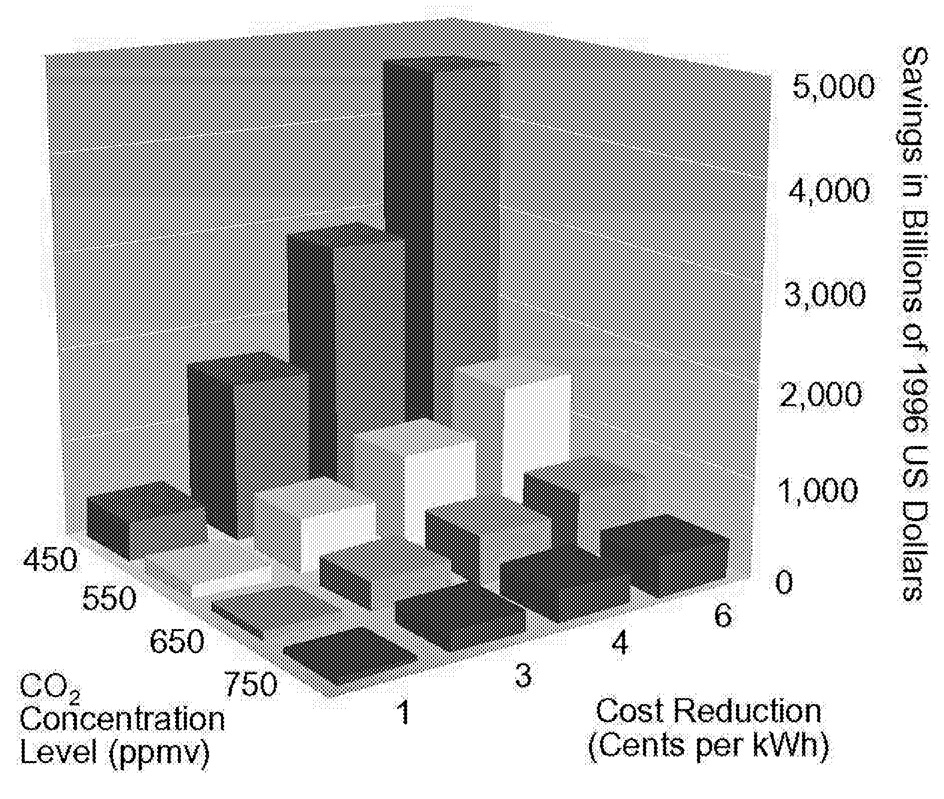
Only investments in energy R&D can create a technology portfolio to address a cumulative emissions limit, and although the results of R&D investments are uncertain—it is impossible to predict the benefit of each dollar invested—successful investments yield large social benefits. Figure 1.10 shows the reduction in minimum, present discounted cost of satisfying alternative concentration limits as solar photovoltaic technology improves. Depending on the reduction in cost and the concentration limit, the present discounted minimum cost reduction ranges from tens of billions of dollars to trillions of dollars.
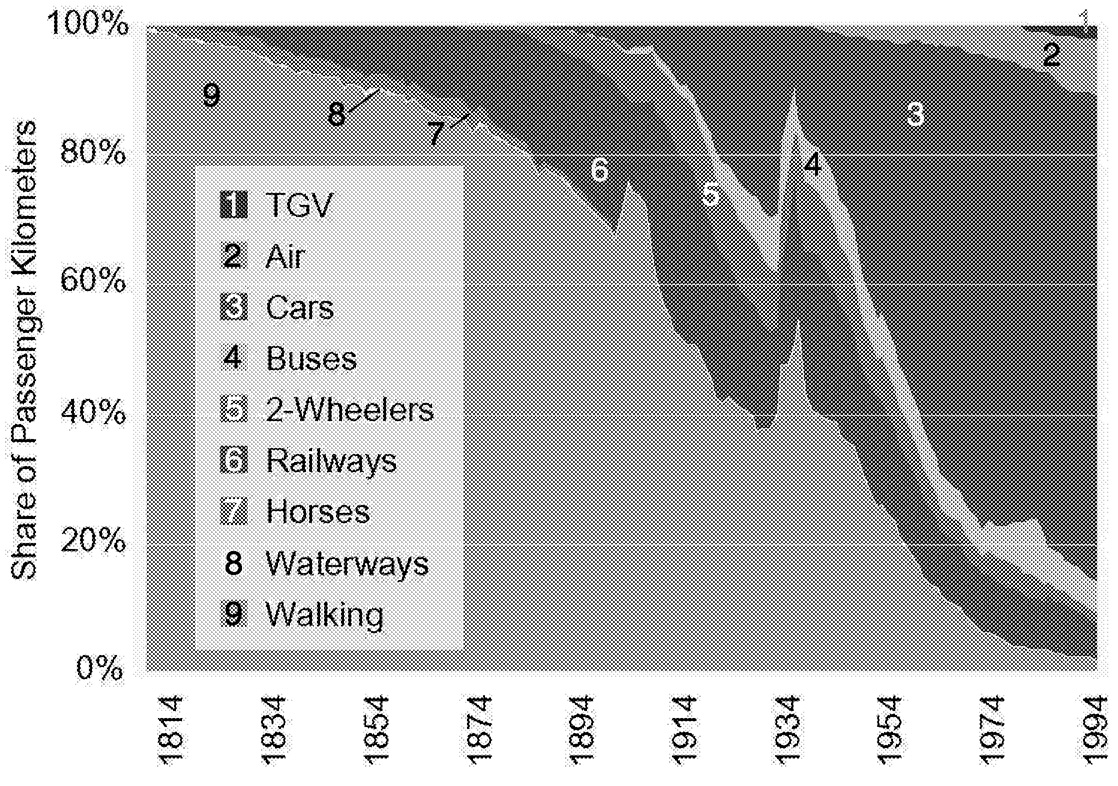
The cumulative nature of the relationship between emissions and concentrations of CO2, coupled with the nature of technology transitions, dictates that investments in energy R&D are required in the near term. Energy systems take from 50 to 100 years for a modal change (see, for example, Marchetti, 1979; Häfele, 1981; Nakicenovic et al. 1998). For example, Figure 1.11 shows the penetration of the
Page 24
~ enlarge ~
FIGURE 1.10 The value of improving solar electric power technologies relative to a reference case cost of 8 cents per kilowatt-hour in 2020.
automobile into the French transportation system. It took half a century for the now-dominant technology to capture half of the market. Market penetration on a global scale takes longer.
Table 1.1 indicates that depending on the limit placed on the atmospheric concentration of CO2, the date at which global emissions peak ranges from 2005 to 2062. This in turn implies that beyond those “peak” dates, new investments in capital stocks to provide energy services must be predominantly non-carbon emitting. That is, additions to the energy-related capital stock must improve end-use energy efficiency, provide energy with non-fossil energy forms, or provide a mechanism by which to capture and sequester carbon.
~ enlarge ~
FIGURE 1.11 The changing composition of French transport since 1800. NOTE: (TGV = modern high-speed trains).
Page 25
A constraint on the concentration of CO2 therefore carries implications for energy R&D. First, it must be broad based. Multiple energy technologies play important roles in limiting cumulative emissions of carbon. No single technology ever captures more than a fraction of the global energy system market. Furthermore, it is impossible to know a priori even the relative importance of different technologies. The multitude of uncertainties that characterize a century-scale analysis provides an infinite set of potential combinations of technology deployments.
Fortunately, decisions need not be taken today that would remain in effect over the next century. Rather, decisions taken today shape the options available at the next decision point. As time proceeds, knowledge grows. This growth in knowledge will ultimately lead to “technology maturation” in some areas but will also suggest new potentially useful R&D investments in others. This is the principle of “act-then-learn-then-act.”
GLOBAL ENERGY R&D
We have found that the long-term value of energy technology improvement is high. However, current energy R&D is declining, is not coordinated internationally, and has yet to significantly incorporate a climate change motivation.
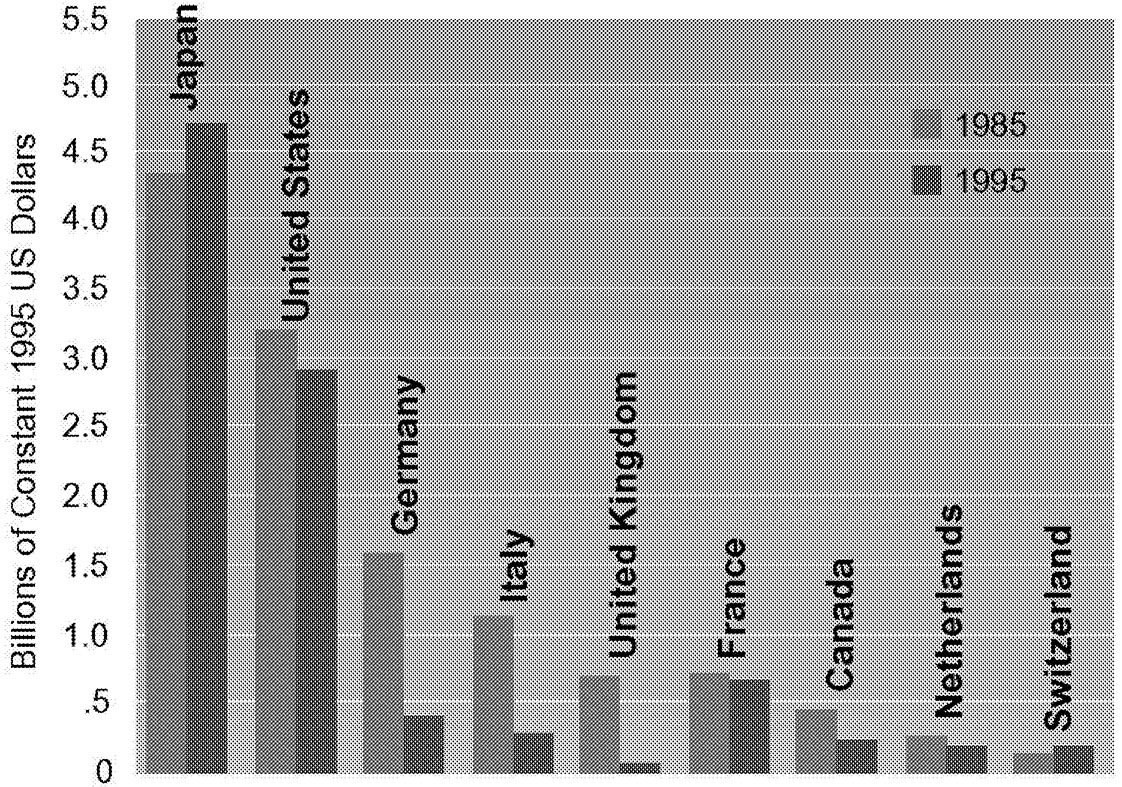
Nine nations account for more than 96% of the industrialized world's public-sector energy R&D investments. Examining trends within the energy R&D programs of these nations ( Figure 1.12) can provide some insight into the world's commitment to energy R&D.
The United States and Japan carry out about 80% of current energy R&D. This is a dramatic shift since 1985, when Europe accounted for more than a third of the total. Energy R&D programs carried out under the European Union's Framework Program have also declined 10% in real terms over this time period.
Comparing these data is complicated by the problem of exchange rate valuation. Using purchasing power parity exchange rates shows that although the composition of Figure 1.12 changes, the qualitative
~ enlarge ~
FIGURE 1.12 Public-sector energy R&D expenditures, 1985 and 1995 (millions of constant 1995 U.S. dollars).
Page 26
|
Year |
United States |
Japan |
European Union |
Germany |
United Kingdom |
Canada |
Total |
|
1985 |
3,269 |
2,366 |
749 |
1,470 |
424 |
8,279 |
|
|
1986 |
3,052 |
2,433 |
515 |
1,168 |
424 |
7,592 |
|
|
1987 |
2,568 |
2,106 |
281 |
866 |
424 |
6,336 |
|
|
1988 |
2,657 |
2,217 |
518 |
801 |
371 |
6,565 |
|
|
1989 |
2,902 |
2,285 |
425 |
736 |
357 |
6,705 |
|
|
1990 |
3,427 |
2,185 |
317 |
737 |
299 |
195 |
7,161 |
|
1991 |
3,255 |
2,216 |
378 |
679 |
257 |
210 |
6,995 |
|
1992 |
3,335 |
2,234 |
364 |
602 |
219 |
205 |
6,960 |
|
1993 |
2,807 |
2,288 |
275 |
523 |
195 |
205 |
6,293 |
|
1994 |
2,944 |
2,449 |
355 |
441 |
151 |
199 |
6,539 |
|
1995 |
2,856 |
2,532 |
412 |
425 |
87 |
201 |
6,514 |
|
1996 |
2,465 |
2,621 |
497 |
431 |
76 |
195 |
6,285 |
|
1997 |
2,160 |
2,511 |
485 |
394 |
58 |
254 |
5,862 |
|
1998 |
2,084 |
2,394 |
474 |
396 |
51 |
183 |
5,582 |
|
% Decline, 1985-1998 |
36 |
−1 |
37 |
73 |
88 |
6 (1990-1998) |
33 |
character does not. In fact, the trend toward lower investment in energy R&D has, if anything, accelerated in some nations ( Table 1.6). Only in Japan do energy R&D budgets rise over the period since 1998.
The general decline in global energy R&D is not restricted to the public sector. Where data are available for the private sector, a similar pattern is observed. For example, the United States experienced an even steeper decline in private sector energy R&D than in public-sector funding. From 1985 to 1996, public-sector funding in the United States declined by 25%. Private-sector energy R&D declined by more than 40%.
The decline in energy R&D is not particularly surprising. Since 1981, the real price of oil has decreased in the United States. In 1986, the oil price fell precipitously. In an environment in which the scarcity value of energy has declined, the expected return on investments in energy R&D declines as well. More recently, the electric power sector has experienced dramatic institutional changes. Deregulation has proceeded on many fronts, with Europe leading the way. The deregulation of power generation changed the incentive structure for the power sector by shifting emphasis away from long-term considerations toward short-term profitability. Energy R&D investments, the preparation for the long term, have declined accordingly.
The decline in investments might be considered an appropriate reflection of the energy situation were it not for the fact that it does not incorporate a serious consideration of the value of energy R&D in meeting long-term climate goals. If limits were expected for the concentration of CO2, then the value of energy R&D would have to rise accordingly.
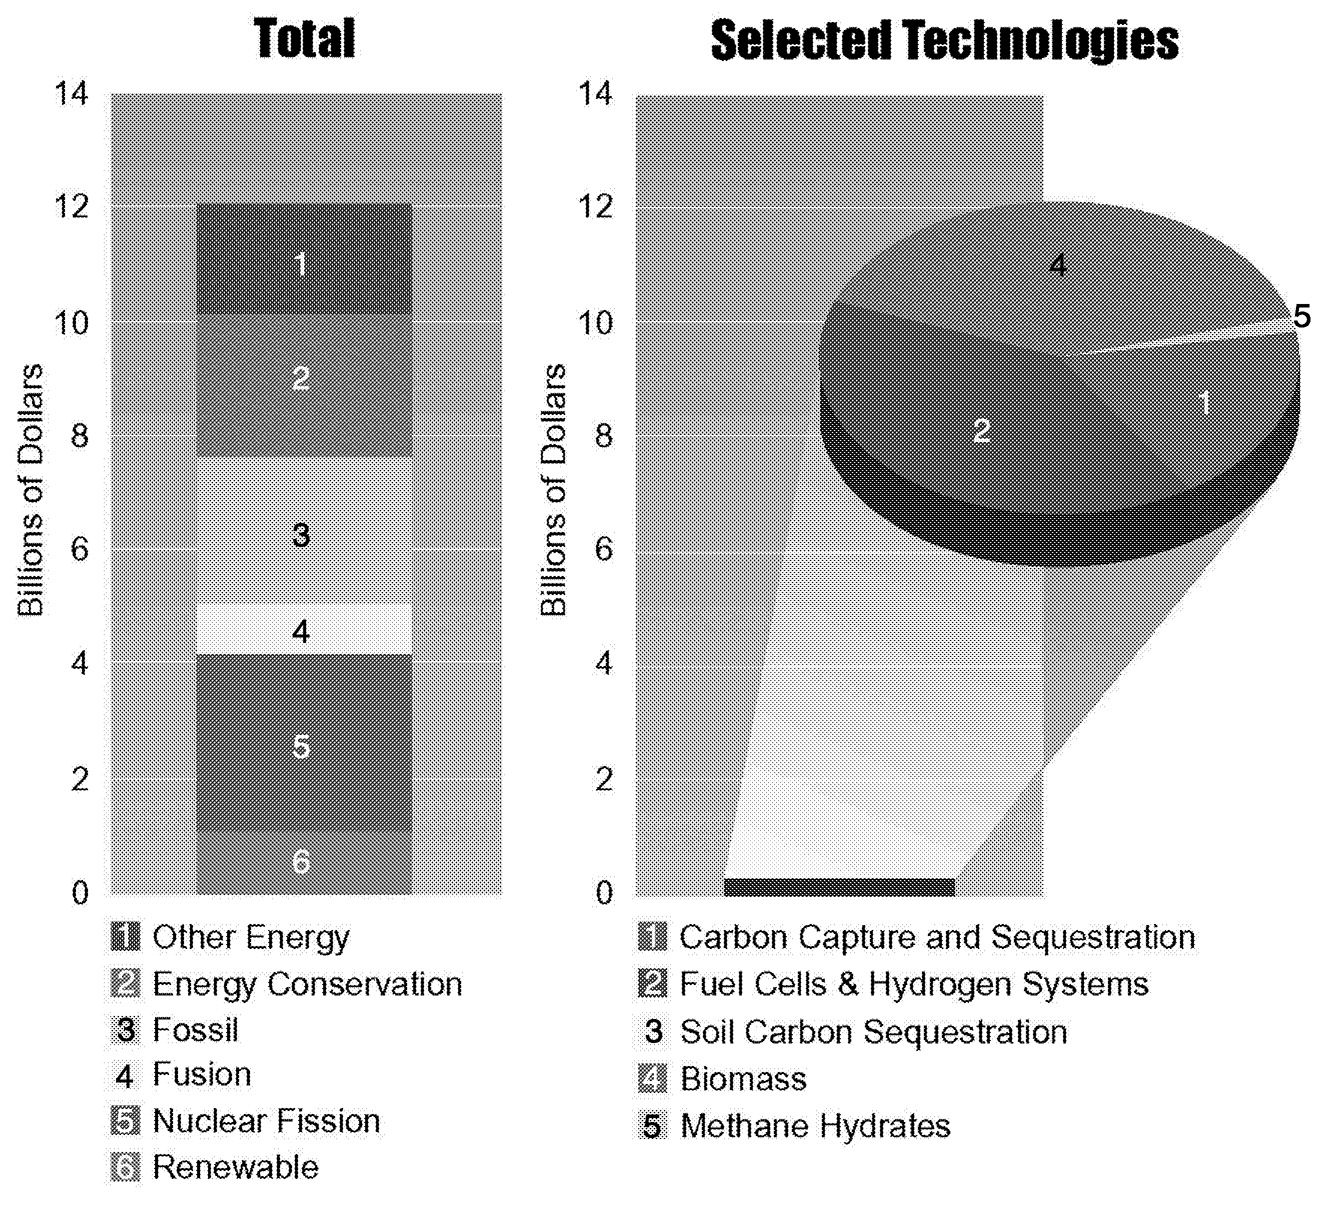
Technologies whose deployment expands dramatically when the concentration of CO2 is limited are of particular interest. Figure 1.13 shows energy R&D in two groups—technologies that are of broad general importance regardless of whether or not climate change is an issue and technologies for which climate change can be extremely important in shaping their deployment.
Page 27
~ enlarge ~
FIGURE 1.13 Global energy R&D expenditures in 1995 (billions of constant 1995 U.S. dollars).
Energy R&D is no more homogeneous than the energy system it serves. It is composed of investments undertaken by both public- and private-sector agents. It includes investments that range from basic energy-related sciences to technology deployment. Building an R&D portfolio requires the inclusion of investments across this full spectrum. The most difficult components of the portfolio are those that occur at the interface of the public and private sectors. Here there are more numerous lessons in how not to proceed than in how to proceed. The potential for “technology pork” is an ever-present danger (Cohen and Noll, 1991). More important than wasted resources represented by political R&D are the wasted opportunities to prepare useful options for the future. This is particularly true in light of the long-term, sustained nature of the carbon management problem.
THE CHALLENGE
Climate change constitutes one of the principal challenges of the twenty-first century, and one of the major dimensions of this challenge is technological. Net human carbon dioxide emissions to the ocean-atmosphere must eventually decline to zero for its concentration to be stabilized. This follows from the fact that long-term, steady-state concentrations are determined by cumulative emissions, not by the emissions rate. As such, CO2 is fundamentally different from other greenhouse gases. This feature of the climate problem has several important, near-term implications for the character of efficient policy development.
Atmospheric stabilization requires fundamental change in the global energy system. The present global energy system relies primarily on fossil fuels. Reliance on fossil fuels grew steadily during the
Page 28
preceding century, and there are sufficient economic fossil fuel resources to enable this trend to continue throughout the twenty-first century. The continued spread of economic development will ensure a continued expansion in the demand for energy services. To stabilize the concentration of CO2 requires the development of cost-effective, low- and non-carbon-emitting energy technologies. In short, an energy technology revolution is needed unlike any in history. The specter of climate change can be avoided by limiting the atmospheric concentration of carbon dioxide, but this will be possible only by developing technology that will change the way in which the world uses low-cost fossil fuel resources, with an associated increase in the cost of energy. This is not the usual motivation of private-sector technology development.
This revolution will not happen by magic. It will occur only because investments were made to develop the technologies. Public policy will play an important role both in signaling the need for new technologies and in facilitating their development and deployment.
Investments will be needed that span the full spectrum from basic energy-related sciences to technology demonstration, and it will be important to reverse the present decline in global energy R&D. Yet, given that a new global energy system is needed to address a global problem, it will also be necessary to coordinate the R&D efforts of many nations and of both the public and the private sectors. Contributions will be needed from both the public and the private sectors. Perhaps the most daunting challenge will be to adequately incorporate public-sector motivation for carbon management into private-sector R&D decision making.
Finally, while a strategy to develop and deploy technology will be essential to a program to minimize the cost of addressing climate change, it is just part of a larger portfolio. That larger portfolio includes scientific research, emissions limitation, and adaptation to climate change. As progress is made in these areas, the R&D portfolio must also be able to evolve. Given the complexity and time frame of the climate problem, flexibility is of the essence.
ACKNOWLEDGMENTS
The work reported here is an outgrowth of research conducted under the Battelle Global Energy Technology Strategy Project to Address Climate Change (GTSP). That work is sponsored by both public- and private-sector organizations, including Battelle Memorial Institute, BP, the Electric Power Research Institute (EPRI), ExxonMobil, Kansai Electric Power, National Institute for Environmental Studies (Japan), New Energy and Industrial Technology Development Organization (Japan), North American Free Trade Agreement Commission for Environmental Cooperation, PEMEX (Mexico), Tokyo Electric Power, Toyota Motor Company, and the U.S. Department of Energy.
The project is guided by a Steering Group, whose members have roots in the public and private sectors as well as academics and the nongovernmental organization communities. Members include Richard Balzhiser, president emeritus, EPRI, Richard Benedick, former U.S. ambassador to the Montreal Protocol; Ralph Cavanagh, co-director, Energy Program, Natural Resources Defense Council; Charles Curtis, executive vice president, United Nations Foundation; Zhou Dadi, director, China Energy Research Institute; E. Linn Draper, chairman, president and chief executive officer, American Electric Power; Daniel Dudek, senior economist, Environmental Defense Fund; John H. Gibbons, former director, Office of Science and Technology Policy, Executive Office of the President; José Goldemberg, former environment minister, Brazil; Jim Katzer, strategic planning and programs manager, ExxonMobil; Yoichi Kaya, director, Research Institute of Innovative Technology for the Earth, Government of Japan; Robert McNamara, former president, World Bank; Hazel O'Leary, former secretary, U.S. Department of Energy; Rajendra K. Pachauri, director, Tata Energy Research Institute; Thomas
Page 29
Schelling, distinguished university professor of economics, University of Maryland; Hans-Joachim Schellnhuber, director, Potsdam Institute for Climate Impact Research; Pryadarshi R. Shukla, professor, Indian Institute of Management; Kathryn Shanks, vice president, Health, Safety and Environment, BP; Gerald Stokes, assistant laboratory director, Pacific Northwest National Laboratory; John Weyant, director, Stanford Energy Modeling Forum; and Robert White, former president, National Academy of Engineering.
Although the research was lead by the scientists at Battelle, the project benefited from the work of the following collaborating institutions: Autonomous National University of Mexico, Centre International de Recherche sur l'Environnement et le Developpement (France), China Energy Research Institute, Council on Agricultural Science and Technology, Council on Energy and Environment (Korea), Council on Foreign Relations, Indian Institute of Management, International Institute for Applied Systems Analysis (Austria), Japan Science and Technology Corporation, National Renewable Energy Laboratory, Potsdam Institute for Climate Impact Research (Germany), Stanford China Project, Stanford Energy Modeling Forum, and the Tata Energy Research Institute (India).
Without the help and support of the above individuals and organizations, the work reported here would have been impossible. The authors are most grateful for all of their many contributions.
REFERENCES
, , and . 1996 . Technical response to climate change. International Energy Agency Greenhouse Gas Program.
, , , , , , , , , , , and . 1998 . Carbon Management: Assessment of Fundamental Research Needs. Office of Energy Research, U.S. Department of Energy . DOE/ER-0724. Washington, D.C . August 1997.
, , , and . 1998 . Potential Production of Switchgrass and Traditional Crops Under Current and Greenhouse-Altered Climate in the MINK Region of the Central United States. Report No. PNWD-2432. Pacific Northwest National Laboratory , Washington, D.C.
, and . 1991 . The Technology Pork Barrel. Brookings Institution , Washington, D.C.
, , , , , and . 1996 . Agricultural options for mitigation of greenhouse gas emissions. Pp. 744-771. In: R.T. Watson, M.C. Zinyowera, and R.H. Moss (eds.) Climate Change 1995: Impacts, Adaptations, and Mitigation of Climate Change: Scientific-Technical Analyses. Contribution of Working Group II to the Second Assessment Report of the Intergovernmental Panel on Climate Change. Cambridge University Press , Cambridge, U.K.
1998 . Unintended consequences: energy R&D in a deregulated energy market. Energy Policy 26(7): 547-555.
. and . 1997 . Workshop for the Preliminary Identification of Basic Science Needs and Opportunities for the Safe and Economical Capture and Sequestration of CO2 . Published in Bensen, S., W. Chandler, J. Edmonds, M. Levine, L. Bates, H. Chum, J Dooley, D. Grether, J. Houghton, J. Logan, G. Wiltsee, and L. Wright. 1999. B. Eliasson, P. Riemer, and A. Wokaun (eds.) Greenhouse gas control technologies. Pergamon Press , New York . Pp 457-462.
and . 2000 . Developing nations, energy R&D, and the provision of a planetary public good: a long-term strategy for addressing climate change. Journal of Environment and Development. V. 9(3): 216-240.
and . 1985 . Global Energy: Assessing the Future. Oxford University Press , New York .
, , , and . 1986 . Uncertainty in Future Global Energy Use and Fossil Fuel CO2 Emissions 1975 to 2075. TR036, DO3/NBB-0081 Dist. Category UC-11. National Technical Information Service, U.S. Department of Commerce , Springfield, Va.
, , , , and . 1996 . Agriculture, Land-Use, and Commercial Biomass Energy: A Preliminary Integrated Analysis of the Potential Role of Biomass Energy for Reducing Future Greenhouse Related Emissions. PNNL-11155. Pacific Northwest National Laboratories , Washington, D.C.
, , , , , and . 1997 . An integrated assessment of climate change and the accelerated introduction of advanced energy technologies: an application of MiniCAM 1.0. Mitigation and Adaptation Strategies for Global Change 1: 311-339.
, and . 1997 . Progress toward storage of carbon dioxide. Energy Conversion and Management 38: S199-S204.
Page 30
, , , and . 1994 . The CRP increases soil organic carbon. Soil and Water Conservation 49: 488-492.
, and . 1997 . Comparison of CO2 removal systems for fossil-fuelled power plant processes. Energy Conversion and Management. 38: S173-S178.
, , , , and . Carbon Management: Assessment of Fundamental Research Needs. U.S. Department of Energy, Office of Energy Research , Washington, D.C.
1981 . Energy in a Finite World. Ballinger Publishing Company , Cambridge Mass.
, , and , 1997 . CO2 capture, reuse, and storage technologies for mitigating global climate change. DOE order number DE-AF22-96PC01257.
. 1996a . Climate Change 1995: The Science of Climate Change. The Contribution of Working Group I to the Second Assessment Report of the Intergovernmental Panel on Climate Change. Cambridge University Press , Cambridge, U.K.
. 1996b . Climate Change 1995: Impacts, Adaptation, and Mitigation of Climate Change: Scientific-Technical Analysis. In the Contribution of Working Group II to the Second Assessment Report of the Intergovernmental Panel on Climate Change. Cambridge University Press , Cambridge, U.K.
, 1995 . Climate Change 1994: Radiative Forcing of Climate Change and An Evaluation of the IPCC IS92 Emissions Scenarios. J.T. Houghton, L.G.M. Filho,
J. Bruce, H. Lee, B.A. Callander, E. Haites, N. Harris, and K. Maskell (eds.), Cambridge University Press , Cambridge, United Kingdom .
1971 . The accumulation of organic matter in soil left uncultivated. Rep. Rothamsted Exp. Stn. for 1970 (Part 2): 113-117.
,and . 1997 . Hydrogen and electricity from decarbonized fossil fuels. Energy Conversion and Management 38: S431-S436.
. 1997 . Visions: How Science Will Revolutionize the 21st Century. Anchor Books, N.Y.
, , and . 1998 . Fuel cells: a competitive market tool for carbon reductions. Proceedings of the 21st Annual Conference of the International Association of Energy Economics. Quebec, Canada .
, , , , and . 1995 . Carbon dioxide disposal in carbonate minerals. Energy 20: 1153-1170.
, , and . 1997 . Magnesite disposal of carbon dioxide. Pp. 419-430 in Proceedings of the 22nd International Technical Conference on Coal Utilization and Fuel Systems, Clearwater, Fl.
, , and . 1999 . Carbon dioxide extraction from air: is it an option? Pp. 885-896 in Proceedings of the 24th International Technical Conference on Coal Utilization and Fuel Systems, Clearwater, FL.
, and . 1997 . Toward the Stabilization of CO2 Concentrations—Cost-Effective Reduction Strategies. Stanford University, Stanford, Calif.
1979 . Energy systems: the broader context. Technological Forecasting and Social Change 15: 79-86.
Nakicenovic, N., A Grübler, and A. McDonald (eds.). 1998 . Global Energy Perspectives. Cambridge University Press , Cambridge, U.K.
, 2000 . Special Report on Emissions Scenarios. Cambridge University Press , Cambridge, U.K.
, 1992 . Emission Scenarios for the IPCC, An Update. Assumptions, Methodology, and Results. IPCC Special Report on Emission Scenarios.
, and . 1981 . Soil nutrient status of hill-agroecosystems and recovery after slash and burn agriculture (Jhum) in north-eastern India. Plant and Soil 60: 41-64.
, , , and . 1996 . The Berlin Mandate: the design of cost-effective mitigation strategies. Climate Change: Integrating Science, Economics and Policy, CP-96-1: 29-48. N. Nakicenovic, W.D. Nordhaus, R. Richels, and F.L. Toth (eds.). International Institute for Applied Systems Analysis, Laxenburg, Austria .
1996 . An Assessment of World Hydrocarbon Resources. WP-96-56. International Institute for Applied Systems Analysis , Laxenburg, Austria .
. 1995 . The Evolution of the World's Energy System 1860-1960.
1983 . An Analysis of Concepts for Controlling Atmospheric Carbon Dioxide. TR007, DOE/CH/00016-1. Washington, D.C.
1991 . Biomass and Hydrocarb Technology for Removal of Atmospheric CO2. BNL-4441OR (Rev. 2/91). Brookhaven National Laboratory , Upton, N.Y.
1996 . Coprocessing Coal and Natural Gas for Liquid Fuel with Reduced Greenhouse Gas CO2 Emission. Brookhaven National Laboratory , Upton, N.Y.
Page 31
, and . 1989 . The Hydrocarb Process for Environmentally Acceptable and Economically Competitive Coal-Derived Fuel for the Utility and Heat Engine Market. BNL-43554. Brookhaven National Laboratory , Upton, N.Y.
. 1992 . Framework Convention on Climate Change. New York .
, , and . 1996 . Economic and environmental choices in the stabilization of atmospheric CO2 concentrations, Nature 379(6562): 240-243.
. Variants of a Low CO2-Emitting Energy Supply System (LESS) for the World. PNL-10851. Pacific Northwest Laboratory , Richland, Wash.
DISCUSSION
George Helz, University of Maryland: I just wanted you to clarify something related to Figure 1.1. I thought you said that to stabilize CO2 in the atmosphere, emissions had to go to zero, which I would interpret to mean that all carbon oxidation has to stop, and I don't think that's what you really meant.
James Edmonds: No.
George Helz: Could you clarify what you meant by emissions?
James Edmonds: Let me suggest a really simple model to work with. Suppose you've got two buckets and you put all the carbon on the planet in two buckets. One is a terrestrial fossil fuel bucket, and the other is an ocean-atmosphere bucket. The net transfer from the terrestrial fossil fuel bucket into the ocean-atmosphere bucket has to go to zero, but that doesn't mean oxidation is going to zero. You've got a carbon cycle that has a lot of offsetting entries in it, but the net flow has to go to zero for the concentration to be stable.
Geraldine Cox, EUROTECH: I'm going to be politically incorrect and ask about one of your assumptions, and that is on population growth because it really wasn't explicit. To me, population growth or the challenge it presents is going to be the overriding fact in all of this.
James Edmonds: Thank you for bringing that up. You are absolutely right, demographics is going to be one of the absolutely critical things over the course of the century. We don't know how it will play out, but it is really interesting. We have been holding a series of workshops on demographics because we are convinced that you are absolutely right—that this is a central issue. It may be that what we have is a problem that, over the course of the century, looks very similar to the problem that we have today—relatively high fertility rates outside of Organization for Economic Cooperation and Development (OECD) countries and a growing population. Underlying that scenario is a world population of 11 billion.
Recently, most population numbers have been revised downwards. The best estimates are below 10 billion, reflecting the rapid decline in fertility rates around the world, in both developed and developing countries. So it reflects some success in a variety of different dimensions. The numbers have been declining. Tom Schelling at the University of Maryland suggested that the biggest problem facing us is keeping the rate of population growth from overwhelming the resource base. We may end the twenty-first century with the fertility rate dropping through the floor, while we try to maintain a population on the planet.
Furthermore, this is 100 years, and there is a revolution in the biological sciences. What does that revolution mean? Well, it may mean that if you are born in the middle of the century and you don't meet
Page 32
an end by stepping out in front of truck, or getting into an altercation with your neighbor, you may, for all practical purposes, live forever.
So you may have a really different demographic out there at the end of this century than anybody is thinking about. It is a really important question.
Alan Wolsky, Argonne National Laboratory: This is a very simple question. You spoke in terms of CO2 concentrations, but I know that if you paint the window with three coats of black paint, the second and third coats aren't nearly as efficacious as the first coat. In a simple theory, the effect might be an exponential relationship. What is the “first coat” of CO2? What's the concentration of CO2 beyond which it doesn't really matter whether you add more CO2 to the atmosphere?
James Edmonds: Are you asking when the temperature would increase to a point that it wouldn't matter anymore, or is the question one of when does it no longer pay to control and you ought to just let it ride?
Alan Wolsky: It's the simple first question.
James Edmonds: The artistry of the FCCC goal was that it said just don't do anything dangerous, and you're asking, I think, “What is dangerous?” That question has not been answered.
Alan Wolsky: Let me illustrate my question by asking another and giving a speculative answer. We know water is a greenhouse gas. We know water is given off when you burn methane. So why aren't people upset by increasing the amount of water in the atmosphere? I speculate that the correct answer is that there is already so much water in the atmosphere, that the likely anthropogenic increment doesn't matter.
James Edmonds: It's a simple question. It doesn't have a simple answer.
Alan Wolsky: Does it have an order-of-magnitude answer?
James Edmonds: Yes, if you say I think that if we ran most of the crop models at concentrations of 1,200 parts per million, you would have a hard time keeping agriculture operating. Nobody has actually done that, as far as I know, and it sounds like dinner conversation.
Klaus Lackner, Los Alamos National Laboratory: I'm really very much in agreement with you on the issue that we have to go down to zero in emissions. I do want to point out, on the other hand, the scales of the other carbon reservoirs and how long it would take to flood them. This is something you didn't point out, even though you have the numbers there. Vegetation contains roughly 600 gigatons of carbon, which corresponds to only about 100 years of fossil energy output at the current rate of emission.
Similarly, the ocean contains about 1,000-1,500 gigatons of carbon in the form of CO2, and doubling this would change the pH from top to bottom by roughly 0.3. So overall, these other reservoirs, (ocean, biomass, and soil), which naturally are sinks, cannot really take up all of the carbon emitted. The scale at which we are generating CO2 is very large compared to the size of the natural reservoirs.
James Edmonds: That's exactly right, except for the ocean, of course.


