
3
Evaluation of the Energy Efficiency Programs
INTRODUCTION
Energy efficient technologies can reduce the life-cycle costs of energy-consuming goods and services paid by consumers and industry, pollutant emissions, and the risk of oil interruptions. For the purposes of this study, energy efficiency has been defined by the committee as the achievement of at least the same output of goods and services (at the same or lower cost) while using less energy. It can be in the form of more efficient products or equipment or processes. Depending on the process or technology, it is measured in different ways, but the goal remains the provision of the same or better level of utility to the consumer while reducing the amount of energy used. For example, in the automotive industry, vehicles that obtain more miles per gallon (mpg); in the aluminum industry, production of more pounds of aluminum per British thermal unit (Btu) of energy; in lighting, more lumens per watt. The pattern of energy use in the U.S. economy has gradually changed over the last two decades, from one dominated by an energy-intensive heavy industry base to one much more dependent on information and services. Nonetheless, the role of energy, and especially electricity, remains vital to the economy’s functioning. In the wake of growing information, service, and other light industrial sectors as well as the electrification of some sectors such as steel, the economy is becoming more electricity-intensive at a faster rate than in the past and often with a higher premium being placed on the quality and reliability of electricity supply. Because of the importance and scale of energy use in the economy—in particular, oil for transportation and electricity for buildings and industry sectors—the efficient use of energy has become crucial to virtually all economic activity and, in the committee’s view, has contributed substantially to the sustained economic growth in the U.S. economy over the last decade.
Energy efficiency can enhance the reliability of the electricity supply, facilitate growth while improving environmental quality, and raise economic productivity in many sectors of the economy. Indeed, research, development, demonstration, and deployment (RDD&D) in energy efficiency have proved effective ways to simultaneously reduce the use of electricity, reduce oil imports, meet environmental requirements, and improve economic productivity. Even with the U.S. economy gradually moving away from energy-intensive industry, as much as two-thirds of the drop in energy intensity of the economy in the last three decades can be attributed to improvements in energy efficiency (OTA, 1990).
This chapter evaluates the contribution that DOE’s energy efficiency RD&D programs have made to improving the technologies used in the buildings, industry, and transportation sectors. These energy-efficiency programs, along with the Federal Energy Management Program (FEMP) and state and local grant programs (these involve weatherization), are in the current Office of Energy Efficiency and Renewable Energy (EERE) and come under the Interior Appropriations Committee of the U.S. Congress. The renewable energy part of EERE is funded by the Energy and Water Appropriations Committee of the Congress. The committee was charged with addressing only the portion of the EERE programs that comes under the Interior Appropriations Committee, not FEMP, the state grants, or renewable components.
The authorities and goals of the DOE programs have changed and evolved over the past 22 years. The RD&D energy efficiency program was initiated in the early 1970s, following the first oil embargo (1973), at DOE’s predecessor agencies—the Federal Energy Administration (FEA) and the Energy Research and Development Administration (ERDA) —in a climate of great urgency and concern over U.S. energy consumption and dependence on foreign sources of petroleum. During the 1970s, the programs at FEA, ERDA, and then DOE were mostly applied product and process research, working with industry to develop more effi-
cient heating, lighting, refrigeration, industrial processes, and new multifuel propulsion engines or battery-driven automobiles. In the mid-1970s, several R&D laws1 were passed specifically directed at electric vehicles and multifuel automotive propulsion engines. The oil embargo also led to the passage of regulatory, information, and financial incentive laws in that decade, including laws on automotive corporate average fuel economy (CAFE) standards, appliance labeling, tax credits for energy-efficient retrofit improvements in residential buildings, low-income weatherization grants, retrofit grants for schools and hospitals, programs for retrofit activities, and building energy performance standards for new buildings.2 In 1987, Congress enacted the National Appliance Energy Conservation Act (P.L. 100–12), which provided for minimum efficiency standards for selected buildings equipment and appliances. The Energy Policy Act of 1992 (EPAct) (P.L. 102–486) provided additional authority and guidance for R&D programs on energy efficiency. For example, it provided a mandate for DOE to work with the largest users in the industrial sector to develop new energy-efficient technology. A review of the national energy plans of the 1970s and 1980s and the DOE strategic plans of the 1990s indicates that RD&D to improve energy efficiency was an integral part of energy strategy, although the emphasis and the focus changed as administrations changed.3
Table 3–1 shows DOE energy efficiency R&D budget data by year for FY 1978 to FY 2000 in constant 1999 dollars by sector. Figure 3–1 shows the allocation of funds by sector for FY 1978, FY 2000, and FY 1978 to 2000. As can be seen from the figure, the transportation sector always received the largest share of the budget (43 percent in 2000, cumulative 42 percent 1978 to 2000). In the early years (FY 1978) of the program, buildings received 40 percent of the funds and industry, 18 percent. In FY 2000, there was less of a difference, with buildings receiving 28 percent of the funds and industry, 29 percent. Over the total period for the programs, industry and buildings received about 26 and 32 percent of the funds, respectively. The focus of energy efficiency R&D shifted during the early 1980s to emphasize basic sciences and early technology development, resulting in less funding for technology and product development and (as seen in Table 3–1) a reduction in R&D dollars for energy-efficiency programs. In the 1990s, energy-efficiency R&D was broadened to include applied research, development, and demonstrations, which are in general limited to proof of concept.
TABLE 3–1 Summary of the Budget for DOE’s Energy Efficiency R&D Programs, FY 1978 to FY 2000 (thousands of constant 1999 dollars)
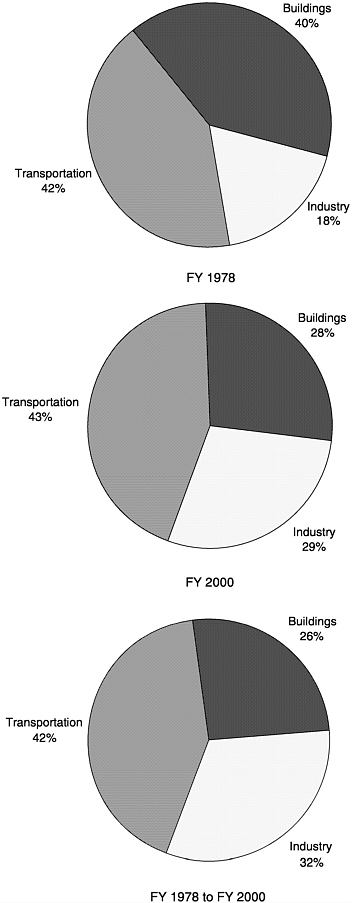
FIGURE 3–1 Distribution of DOE’s budget by sector for its energy efficiency R&D programs (in thousands of dollars). Totals are $329,278,000 in 1978; $547,376,000 in 2000; and $7,282,952,000 for 1978 to 2000. SOURCE: OEE, 2000.
The amount of basic science performed by the energy efficiency program has been small; thus in FY 2000, Congress appropriated $10.9 million for basic science research with potential application in energy-efficient technologies. Thirteen teams led by universities were selected to perform scientific research on energy-efficient power generation for industrial and buildings systems or transportation. An additional $10.9 million was appropriated in FY 2001 by the Interior Appropriations Committee to continue this initiative (DOE, 2001).
Since the start of the energy efficiency RD&D technology programs in the 1970s, industry has been an active participant, performing research and, to a more limited extent, establishing the research agenda. Since the beginning of the ERDA programs, industry has usually cost-shared at least 20 percent to allow it to retain patent rights (P.L. 93–438, 1974). During the past 8 years, in major programs such as the Partnership for a New Generation of Vehicles (PNGV) and Industries of the Future (IOF),4 industry has taken an active role in establishing the technical goals, in jointly developing the research agenda, and in consistently cost sharing.
SELECTION OF THE CASE STUDIES
The energy efficiency (EE) R&D program is aimed at three sectors: buildings (both residential and commercial), industry (manufacturing and cross-cutting technologies), and transportation (primarily automotive and light- and heavy-duty trucks). Although the issues, problems, and solutions for energy efficiency may be different for each of the three end-use sectors, lessons learned from one sector are often applicable to all the sectors. In order to provide a comprehensive study of the energy efficiency program, 17 case studies were selected to illustrate the main components of the program, important examples of RD&D activities, and the range of benefits and costs that the energy efficiency program has yielded. The case studies cover only about 20 percent of the total EE R&D expenditures (see Table 3–2) over the 22-year period. As a result of the characteristics of the building and industry sectors and the type of programs DOE has sponsored, the case studies for the buildings sector account for about 5 percent of the total building budget and those for the industry sector, 13 percent of the total industry budget. The transportation case studies represent 38 percent of the transportation budget.
The buildings and industry programs tend to have many smaller projects (in the millions of dollars rather than tens of millions), so it was not possible to select a few larger projectsTABLE 3–2 Expenditures for Energy Efficiency Programs Analyzed by the Committee, 1978 to 2000 (millions of dollars)
|
Program |
DOE Costs |
|
Buildings (budget 1978 to 2000, $2015 million) |
|
|
Advanced refrigerator/freezer compressors |
1.6 |
|
Compact fluorescent lamps |
1.8 |
|
DOE-2 program |
23.2 |
|
Electronic ballasts for fluorescent lamps |
6 |
|
Free-piston Stirling engine-drive heat pump |
30.2 |
|
Low-emission glass |
4 |
|
Indoor air quality |
34 |
|
Subtotal |
100.8 |
|
Industry (budget 1978 to 2000, $2072 million) |
|
|
Advanced lost foam technology |
3.6 |
|
Advanced turbine system |
184 |
|
Forest products IOF programa |
53.6 |
|
Black liquor gasification |
14.9 |
|
Oxygen-fueled glass furnace |
1.3 |
|
Subtotal |
257.4 |
|
Transportation (budget 1978 to 2000, $3196 million) |
|
|
Advanced batteries |
376 |
|
Catalytic conversion |
19.3 |
|
Stirling automotive engine |
231 |
|
Transportation fuel cell power systems |
210 |
|
PNGVb |
371c |
|
Subtotal |
1207.3 |
|
NOTE: Budget estimates are for 1978 to 2000 in millions of constant 1999 dollars. aExcluding black liquor gasification. bIncludes the P-4 (programmed powder preform process) for Manufacturing of Automotive Composite Structures program, but excludes the Catalytic Conversion for Cleaner Vehicles program and the Transportation Fuel Cell Power Systems program. cExcludes the budgets for the Catalytic Conversion for Cleaner Vehicles program and the Transportation Fuel Cell Power Systems program. SOURCE: Office of Energy Efficiency. 2000. Response to questions from the Committee on Benefits of DOE R&D in Energy Efficiency and Fossil Energy (February 5). |
|
Capital stock turnover is different for each of the sectors: 14 years for cars and 40 years or more for the buildings sector. Within the buildings sector, appliances and equipment have lifetimes ranging from 1000 hours (lightbulbs) to 20 years for space conditioning equipment. Consequently, to realize energy savings in the economy, substantial time may be required for new energy-efficient technologies to penetrate the market.
In addition to economic benefits, there are also environmental and security benefits that the committee wished to introduce through the case studies. Energy production and use has a wide variety of environmental, health, security, and other impacts whose costs are generally not included in its price. Economically, however, for markets to allocate re-
sources efficiently, these costs (or “externalities”) must be included in the price of the particular energy service. A number of efforts, particularly in the electricity sector, have been launched in recent years to value these costs and use them to guide investment in and use of energy services; a number of states (and some countries) now consider environmental externalities in their electric sector planning processes (European Commission, 1996–2001; Hohmeyer, 1988; ORNL, 1994; Ottinger et al., 1990; Stirling, 1997). These externalities generally encourage the use of energy efficiency measures that lower the need for energy supply (and its emissions) and the use of improved energy supply technologies with resultant lower emissions. The energy efficiency program that most directly addresses oil security is in the transportation sector. Electricity reliability and power quantity and quality have become more important in the past few years, as illustrated by the situation in 2000 and 2001 in California. Reliability and power quality have had an impact on industry productivity and the costs of doing business.
Rationale for the Case Studies
The case studies were selected to illustrate hypotheses (see Table 3–3), but they also stimulated additional hypoth-
TABLE 3–3 Categories and Case Studies
|
Dimension Illustrated |
Project/Program |
Target Sector |
|
Benefits matrix |
|
|
|
High economic benefit |
Electronic ballasts Lost foam |
Buildings Industry |
|
High environmental benefit |
Indoor air quality |
Buildings |
|
High security benefit |
PNGV, fuel cells |
Transportation |
|
High public benefit |
PNGV |
Transportation |
|
Predominantly knowledge benefit |
Batteries, catalytic conversion |
Transportation |
|
Predominantly options benefit |
Forest products |
Industry |
|
Different federal roles |
|
|
|
Interaction of technology and regulation |
Residential refrigerators |
Buildings |
|
DOE as catalyst |
Low-emissivity windows, DOE-2 |
Buildings |
|
DOE demonstration |
Oxy-fuel, advanced turbine, black liquor |
Industry |
|
Different program types |
|
|
|
Consortium |
Forest products, PNGV |
Industry, transportation |
|
Individual company |
Advanced gas turbine |
Industry |
|
Other |
|
|
|
Program initiated by Congress/the administration |
Stirling engine, PNGV |
Transportation |
|
Failure |
Stirling engine |
Buildings, transportation |
eses, which led to other findings. An individual case study may be in more than one category. Included are both successes and failed or terminated projects. They did not come from a statistical sampling of the projects but were, instead, a representative sample of projects. For both purposes, programs were chosen for treatment as case studies based on their suitability for illustrating the following (see Table 3–3 and Appendix E):
-
The benefits matrix. Of particular interest were programs or projects that provide benefits along dimensions other than just row 1-column 1, the northwest corner of the matrix (net realized economic benefit), so that the importance of public goods benefits for a public sector program can be illustrated. The benefits matrix is described in Appendix D.
-
The federal role in applied research/technology development. This may be of particular relevance in explaining the relationship, or lack of one, between DOE’s financial participation in a project and the amount of credit it deserves for the outcome. There is a mix of R&D supporting tools, demonstrations, and standards, depending on the sector.
-
Program organization and industry type. In energy efficiency, this covers the major sectoral targets (building, transportation, industry), as well as programmatic choices (industry-dominated consortia; multiple individual-company projects within a larger programmatic framework, with project choices made by DOE; DOE demonstrations with industry).
Buildings, Industry, and Transportation Sectors
Buildings
Buildings account for 36 percent of the total U.S. energy consumption and two-thirds of the electricity used. Residential buildings have used approximately 55 percent of the building sector’s total, and commercial buildings have used approximately 45 percent annually since 1979 (EIA, 1998). Figure 3–2 shows the percentage of consumption by function, for residential buildings and for commercial buildings. Combined heating and cooling consume the most energy in buildings. In residential buildings, water heating and refrigeration are the next biggest energy consumers, accounting for 24 percent of the energy consumed. In commercial buildings, lighting consumes 25 percent. Computers consume a growing share of energy in commercial buildings.
Currently, there are approximately 4.6 million commercial (that is, nonresidential, nonindustrial) buildings and 100 million residential buildings (EIA, 1996) in the United States. The annual rates of growth and replacement of this building stock have been approximately 2 percent for residential buildings and 4 percent for commercial buildings over the last 20 years (EIA, 1997). Thus, approximately 2
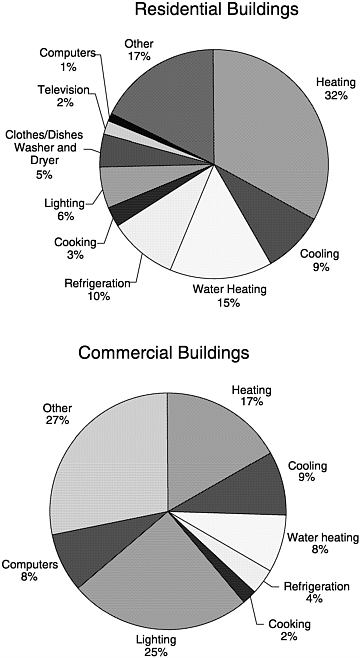
FIGURE 3–2 Consumption of energy in residential and commercial buildings in 1999 by application. In residential applications, “other” refers to miscellaneous devices and appliances used in residential applications, from furnace fans to swimming pool heaters; in commercial applications, it refers to miscellaneous uses such as service station equipment, automatic teller machines (ATMs), telecommunications, and medical equipment. In both applications, transmission and distribution losses are included. SOURCE: EIA, 2001.
million new residential buildings and 200,000 commercial buildings have been constructed each year.
However, the building construction industry has been fragmented, as no builder has had more than 5 percent of the market (Builder, 2000). Moreover, there has been little incentive for designing, constructing, or operating buildings to improve their energy efficiency.
The architects and consulting engineers who design commercial buildings are generally paid as a percentage of the job cost and have little incentive to take extra time to design more energy-efficient buildings given the constraints of minimizing first costs. Moreover, architects and consulting engineers must comply with a plethora of building codes and standards on health and safety in addition to energy efficiency. Many buildings are constructed “on spec,” that is, based on what the architect/engineer specifies, and first costs of labor and materials are typically the primary concern of the builder. Although many energy-efficient materials and products do not have higher first costs, builders resist implementing them because additional time is needed to train workers to install them. Also, until the builder gains experience with these energy-efficient materials and products, they are perceived as risky.
Many residential and commercial buildings are leased. Commercial tenants have little incentive to invest in improving energy efficiency in places that are perceived to adversely affect occupant performance, as the cost of energy is only about 1 percent of the cost of salaries, and such capital improvements would be largely left with the owner when the tenant leaves. Likewise, owners have little incentive to spend more on capital improvements for energy efficiency, as the savings typically accrue to the tenants, who pay the energy bills. Thus, there are numerous “split incentives” or even disincentives for the designers, builders, owners, and tenants.
Within this framework, the energy efficiency program has sponsored relatively small RD&D projects for discrete technologies that have the potential for significant energy savings in new and existing buildings without compromising the health or safety of the occupants, such as more efficient windows for residential and commercial buildings, lighting for commercial buildings, and refrigerators for residential buildings.
Industry
The manufacturing sector consumes about 36 percent of the nation’s energy and is complex and heterogeneous. Figure 3–3 shows the percentage of primary energy used in the manufacturing sector by process industry. Since the 1970s, industry varied its petroleum use between about 7.5 to 10.5 quads (1 quad = 1015 Btu), with consumption increasing slowly over the past decade to the current 9.5 quads. Natural gas use varied similarly, from about 6.8 to 10.3 quads, with consumption increasing over the past decade to the current 10.2 quads (Q) and electricity use increased fairly steadily from about 6.6 Q in 1970 (including generation losses) to the current 11.1 Q (EIA, 1999). Industry also became more adept at fuel switching depending on price and availability. The increasing importance of computerized control and the in-
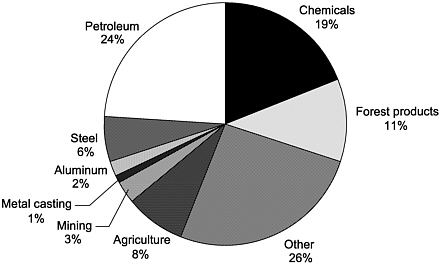
FIGURE 3–3 Percentage of primary energy used in the manufacturing sector by major industrial category, 1999. SOURCE: D.W.Reicher. Deputy Assistant Secretary, Energy Efficiency and Renewable Energy Network, Department of Energy, in a briefing to the committee on June 22, 2000.
creased sensitivity of many high-technology industries to power disruption are making new demands on electricity providers for high quality and reliability. The DOE IOF program focuses on nine process industries (steel, aluminum, chemical, petroleum-refining, forest products, glass, agriculture, mining, and metal-casting) that consume about 80 percent of industrial energy and about a quarter of all the nation’s energy at a cost of about $100 billion in energy per year. Hundreds of different processes are used to produce thousands of different products. Even within a process industry, individual firms vary greatly in the output they produce and their methods of production. Except for primary metals and petroleum refining, energy normally accounts for less than 5 percent of the cost of manufacturing a product, with labor and capital accounting for larger shares.
Although environmental drivers are motivating some industries to improve their energy efficiency, unless there are significant price signals, industry will not generally make substantial improvements. However, if energy-efficient manufacturing technologies are available when industry is making capital investments, they will be incorporated if they are cost-effective.
Transportation
The transportation sector consumes 27 percent of the nation’s energy, with 97 percent of the fuel used by this sector being petroleum. Figure 3–4 shows the consumption of fuel by transportation service. This sector accounts for more than two-thirds of the nation’s oil demand and uses more oil than is produced domestically. The large dependency on oil to move people and goods makes the sector vulnerable to oil price changes and supply interruptions. Transportation (automobiles, trucks and buses) is one of the largest sources of local and regional air pollution. Although automobiles have become twice as fuel efficient as in the 1970s, the increase in numbers of vehicles and vehicle miles traveled and the increase in the use of less efficient light trucks (e.g., sport utility vehicles and minivans) for personal transport mean that energy used by the transportation sector has grown rapidly and the sector has not changed its dependence on oil, which still remains at 97 percent. However, since the price of fuel, even with recent gasoline price increases, is a relatively minor part of the cost of driving, there is little incentive for consumers to demand more efficient vehicles.
In the 1970s, the automobile industry was dominated by three major U.S. manufacturers, with less than 10 percent of the market supplied by non-U.S. companies.
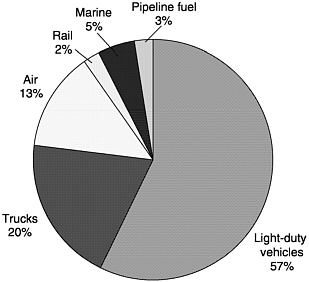
FIGURE 3–4 Percentage of fuel consumption for transportation by service, 1999. SOURCE: EIA, 1999.
Over the past two decades, the automobile industry became global, and mergers created multinational ownership. In the mid-1970s, CAFE standards were implemented under the Energy Policy and Conservation Act of 1975 (P.L. 94–163), which contributed to the doubling of the fuel economy for new passenger cars in the next decade. These standards were met largely by developing and implementing existing technology. Vehicle weight reduction was one of the major contributors to meeting the standard. Although continued development of conventional automotive technologies will undoubtedly provide additional gains in fuel efficiency, to make significant advances in the future requires the development of entirely new technologies.
BUILDINGS: LESSONS LEARNED FROM THE CASE STUDIES
The committee reviewed seven R&D programs in the buildings sector and found very positive returns on a relatively modest federal investment for all but one of the projects reviewed. It is important to emphasize, however, that these returns are not exclusively a function of the size of the federal technology investment; they require effective integration of incentives to deploy the new technologies and energy-efficiency standards that accelerate adoption.
Formidable market barriers, summarized in the preceding section, tend to block the development and introduction of energy-efficient technologies in the buildings sector even if paybacks in the form of reduced energy bills are very rapid. Over the 20-year horizon of this study, a potent response has emerged that marries federal R&D-based technology innovation initially with financial incentives for technology adoption (typically funded by utility programs and tax incentives) and ultimately with amendments to building and equipment efficiency standards. This progression is illustrated most fully by the refrigerator, electronic ballast, and low-emission (low-e) window programs. Such efforts require sensitivity to considerations of federalism and effective cooperation with the private sector; for example, building-efficiency standards and utility regulation have traditionally been dominated by state-level authorities, whereas responsibility for many equipment-efficiency standards lies at DOE itself under the National Appliance Energy Conservation Act of 1987. The committee concludes that DOE appears to have made a substantial contribution to significant changes in the U.S. lighting, glazing, and refrigeration markets, with benefits to consumers and the environment that exceed the entire federal R&D investment in the buildings sector over the period under review. No precise accounting of DOE’s share of that benefit is possible, but the conclusion is robust across a wide range of reasonable assumptions.
Two other case studies (DOE-2 and indoor air quality) illustrate additional, albeit less dramatic positive outcomes of DOE investment in the buildings sector. Through its development of the DOE-2 computer program starting in 1978, the Department helped accelerate progress on energy-efficiency standards at the state level. The DOE-2 program allowed designers to simulate the interaction of complex building systems and to project the energy consumption of a vast range of design alternatives. The development of this computer program also stimulated the promulgation of performance-based standards that provided designers with multiple ways to meet particular efficiency targets. The committee concludes that DOE-2 was influential in the development of both California’s Title 24 and the American Society of Heating, Refrigerating and Air-Conditioning Engineers (ASHRAE) standards that have guided the development of building standards throughout the United States (and indeed the world). Compliance with these standards has resulted in significant energy, environmental, and security benefits.
That conclusion draws further support from the committee’s review of DOE research on indoor air quality, infiltration, and ventilation (IAQI&V), initiated more than 20 years ago to address the concerns about potential linkages between improved energy efficiency and poorer indoor air quality. DOE contributed significantly to the development of standards and technologies that have allowed for the integration of energy-efficiency and public-health objectives, resulting in net improvements in indoor air quality along with reduced energy needs for heating and cooling. The committee finds that the resulting economic benefits are likely to have substantially exceeded DOE’s costs for the indoor air quality program. Important (if indeterminate) environmental and security benefits also attend DOE’s contribution to showing that energy efficiency, health, safety, and productivity are not mutually exclusive.
Another case study tracks recent (post-1997) DOE efforts to induce a paradigm shift in the technology of compact fluorescent bulbs, whose residential-sector penetration remains hampered by a combination of the ballast’s cost and bulk. DOE and industry partners like General Electric are working aggressively to achieve cost reductions and miniaturize ballast electronics. The principal benefits currently are in the area of options and knowledge for future development, with a very large future opportunity represented by the 20 percent of lighting energy consumption associated with some 500 million portable lighting fixtures in U.S. residences and hotels.
In addition to the case studies that have had positive returns, a case study was prepared for one representative terminated project: the gas-fired, free-piston Stirling-engine heat pump ($30.2 million). The program was terminated twice (1982 and 1992) owing to technical and economic problems, including materials for the refractive heater head and the extremely high tolerance needed for successful gas bearings (see Stirling engine gas-fired heat pump case study for details).
Another lesson learned from the low-e, DOE-2, and IAQI&V case studies is that credible cost and benefit analyses are required to demonstrate the effectiveness of DOE’s
energy efficiency RD&D programs. None of the case studies was accompanied by statistically valid data that could be used to analyze the benefits to a given level of uncertainty. The committee recommends that DOE develop standardized procedures for quantifying the benefits of its RD&D programs within specified levels of uncertainty along the lines of the benefits framework (see Appendix D).
Case Study Summary: The Refrigerator
One of the largest sources of electricity consumption in many American households is the refrigerator. Figure 3–5 illustrates one of the last half-century’s more remarkable technological achievements in the energy efficiency field: a reduction of more than two-thirds in the average electricity consumption of refrigerators since 1974, even as average unit sizes increased, performance improved, and ozone-depleting chlorofluorocarbons and hydrochlorofluorocarbons (HCFCs) were removed.
At the time the DOE R&D effort began, in the late 1970s, such an outcome would have seemed highly implausible. From 1947 to 1974, average consumption per unit had quadrupled, and there was little reason to expect the process to reverse. The subsequent need to remove chlorofluorocarbons added to the challenge, since many experts believed initially that any affordable substitutes would further increase electricity needs. The refrigerator story is one of industry and government cooperation, based on the integration of federal and private sector R&D, utility-financed incentives for customers to purchase efficient models, and government efficiency standards at both state and federal levels. While many institutions were involved, DOE played a critical role, starting with its 1977 launch of a program of appliance product development. DOE’s initial investment of some $775,000 helped demonstrate the feasibility of a full-featured refrigerator using 60 percent less electricity than comparable conventional units and produced new computer tools for analyzing the energy-use implications of refrigerator design options. DOE R&D funds and partnerships also played a key role in allowing industry to phase out HCFCs without an energy penalty (Geller and Thorne, 1999, p. 4). DOE also funded R&D by a leading compressor manufacturer to improve compressor efficiency, something that was accomplished with only modest increases in compressor cost. These better compressors were estimated to be responsible for about half of the refrigerator efficiency improvement during the 1980s. The net economic benefit of these compressors in reduced consumer electricity costs is estimated to be about $7 billion over the period from 1981 to 1990 (see Table 3–4 and the advanced refrigeration case study in Appendix E).
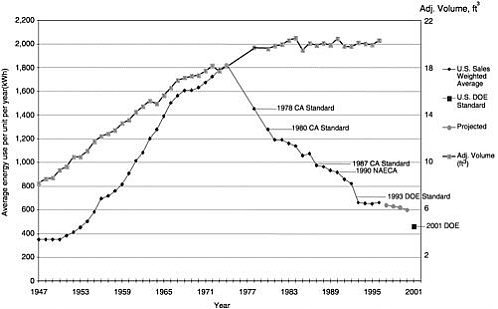
FIGURE 3–5 Electricity consumed by refrigerators, 1947 to 2001. SOURCE: Goldstein and Geller, 1999.
TABLE 3–4 Net Realized Benefits Estimated for Selected Technologies Related to Energy Efficiency RD&D Case Studies
|
|
Economic Benefits (Cumulative Net Energy Savings and Consumer Cost Savings) |
Environmental Benefits (Cumulative Pollution Reduction) |
Security Benefits (Oil Use or Outage Reduction) |
||||||||
|
Technology |
Cost of DOE and Private RD&D (billion $)a |
Fuel (Q)b |
Electricity (Q of primary energy)c |
Net Cost Savings (billion $)d |
SO2 (millions of metric tonnes) |
NOx (millions of metric tonnes) |
Carbon (millions of metric tonnes) |
Damage Reduction (billion $)e |
Oil and LPG (Q)f |
Electricity Reliability |
Value (billion $)g |
|
Advanced refrigerator/freezer compressors |
~0.002h |
|
1 |
7i |
0.4 |
0.2 |
20 |
1–5 |
0.04 |
|
0.02–0.1 |
|
Electronic ballast for fluorescent lamps |
>0.006j |
|
2.5 |
15 |
0.7 |
0.4 |
40 |
1–10 |
0.1 |
|
0.05–0.3 |
|
Low-e glass |
>0.004k |
0.7 |
0.5 |
8l |
0.3 |
0.2 |
20 |
0.5 |
0.2 |
|
0.1–0.7 |
|
Advanced lost foam casting |
0.008 |
|
0.03 |
0.1m |
0.01 |
0.006 |
0.5 |
0.02–0.1 |
|
||
|
Oxygen-fueled glass furnace |
0.002 |
0.06 |
|
0.3 |
|
0.02 |
1 |
0.05–0.2 |
|
||
|
Advanced turbine systems |
~0.356 |
0.09 |
|
~0 by 2005n |
|
0.02 |
1 |
0.05–0.2 |
|
Yes |
|
|
Total |
~0.4 |
|
~30 |
|
~3–20 |
|
0.2–1 |
||||
|
NOTE: The EE benefits are total (EE plus other sponsors, including industry). aDOE R&D investment plus all private sector R&D cost share in billions of 1999 dollars. bCumulative fuel savings in quadrillion Btu (quads, or Q). cCumulative electricity savings in quadrillion Btu of primary energy. dCumulative energy cost savings net of R&D costs, extra capital, and labor costs compared to the next-best alternative all in 1999 dollars. The DOE investment is assumed to have led to the innovation coming on the market 5 years earlier than it otherwise would have. eAvoided emissions of SO2 and NOx are assumed to be valued in the ranges of $100 to $7,500 and $2,300 to $11,000 per metric tonne, respectively, in avoided damages, and avoided carbon emissions are assumed to be worth $6 to $11 per metric tonne. These ranges are for the lower end of damage values estimated in the literature. The open market value of mitigating a tonne of SO2 is $100–300, and $100 was used to peg the lower end of the range for SO2. SOURCES: Stirling, 1997; Ottinger et al., 1990; ORNL, 1994; EC, 1996–2001; OTA, 1994; Pearce et al., 1996; Tol, 1999. fFuel oil saving from saving electricity is equal to the primary energy used to make electricity times 1/30. gReducing oil use by one barrel is judged to be worth $3 to $20 in reducing the cost of an oil price shock. The value of $3 assumes cartel pricing and oil price shocks have cost the U.S. economy $25 billion per year. This derives from Paul N.Leiby, Donald W.Jones, T.Randall Curlee, and Russell Lee, “Oil Imports: An Assessment of Benefits and Costs,” ORNL-6851, Nov. 1, 1997. That report also examined (Table 5.9) the range of oil import premiums and found them to be from $0.21 to $9.91/bbl. The value of $20/bbl comes from taking the total cost of cartel pricing and oil price shocks over the past 28 years and dividing by the total cumulative use of oil by the United States during that time. The cost is estimated to be $3.7 trillion divided by 153 billion barrels, or $22/barrel. The total cost is from Greene and Tishchishyna, 2000. hPrivate sector cost share was $0.28 million. iAs a result of DOE R&D investment with a compressor manufacturer, a series of much more efficient compressors for refrigerator/freezers came on the market beginning in 1981. These were assumed to have resulted in half the energy savings of the sales weighted average refrigerator/freezers sold between 1981 and 1990 compared to 1979 as a base from which to calculate the savings. The net life-cycle cost savings of units sold through 1990 were reduced by assuming an improved compressor would have appeared on the market by 1986 without the DOE investment, and that it would have followed the same penetration path displaced by 5 years. No energy or cost savings beyond the 1990 year were assumed, but the full life-cycle savings over the assumed 20-year life of the units was counted. Beyond 1990, improvements in efficiency were due to DOE standards and R&D on HCFC substitutes without performance degradation, and these are estimated to save 2.6 Q of primary energy for electricity generation and $15 billion in net consumer life-cycle savings through 2005. jPrivate sector cost share unknown. kPrivate sector cost share unknown. lThe net energy cost savings was $37 billion (due to use in residential buildings and heating load reductions only). The committee applied the 5-year rule, and the savings dropped from 6 to 1.2 Q and the energy cost savings dropped to $8 billion. These benefits ignore those deriving from cooling load reductions and commercial buildings applications. mEE estimates the benefit from substituting the lost foam casting technology for sand casting at 46 percent in labor productivity and 7 percent reduction in material cost. These cost savings are much larger than the net energy cost savings, but they are not reflected in the realized economic benefits number. nFor this case, the net life-cycle energy cost savings over the 10 years of turbine lifetime for turbines estimated to be installed by 2005 pays for the R&D invested by DOE and private sector partners. |
|||||||||||
These successes strongly influenced the enactment of increasingly demanding efficiency standards, first in California and ultimately by DOE itself under authority of the National Appliance Energy Conservation Act of 1987. A reinforcing cycle began that continues to this day, under which targeted federal R&D helps make possible the introduction of increasingly efficient and life-cycle cost-effective new refrigerator models, which themselves become the ba-
sis for tightening the minimum efficiency standards (based on marketplace demonstrations of the feasibility of meeting a tighter standard). The refrigerator standards that DOE promulgated in 1990, 1993, and 2001 have been credited with net life-cycle savings to consumers of about $15 billion, and cumulative primary energy savings through 2005 will be about 2.6 quads.5
INDUSTRY: LESSONS LEARNED FROM THE CASE STUDIES
The committee prepared five case studies from OIT—advanced lost foam technology for metal casting (see Box 3–1), advanced turbine systems, oxygen-fueled gas furnaces for glass making, black liquor technology (see Box 3–2) for the forest products industry, and the forest products IOF program (the last-mentioned is clearly not an individual technology but a program). The advanced turbine systems program in the Office of Energy Efficiency is only the portion of the overall DOE turbine program that was part of OIT—the Office of Fossil Energy has a separate program addressing the larger turbines. Recently, the OIT program was transferred to the Office of Power Technologies within EERE, but the committee examined it nonetheless as part of its retrospective review of OIT.
|
BOX 3–1 Lost Foam Metal Casting: A Revolutionary Technology The casting of metals is an energy-intensive process. In 1989, OIT began research on the technical issues inhibiting the use of the lost foam process as an alternative to traditional sand casting of metals. Several specific technologies and process improvements, such as an air gauging system and a distortion gauge, were developed as part of this research. Energy savings of 25 to 30 percent are typically achieved by the lost foam process compared to conventional sand casting. But more important to many in industry who have adopted the lost foam process are the other benefits—it is a much simpler process, with less machinery, waste, and pollution and greater output. It even enables parts to be cast that could not be cast using older techniques. Production cost reductions of 20 to 25 percent are likely on reasonably simple cored items, and 40 to 45 percent on complex castings. The lost foam casting method is penetrating the market now and is projected to account for about 19 percent of the casting market by 2010. |
|
BOX 3–2 Black Liquor Gasification Demonstration This initiative was one outcome of the IOF process for the forest products industry. The technologies are being evaluated as replacements for existing Tomlinson recovery boilers. Black liquor technologies have up to 10 percent higher thermal efficiency, two to three times more electrical output per ton of biomass and black liquor input, and the same or lower installation and operating costs. The timing of the research and these demonstrations is critical because over 80 percent of the 200 Tomlinson boilers currently in use will require major modifications or replacements before 2020. OIT is continuing research to resolve technical issues prior to demonstration. |
The five case studies represent only a very small portion of the overall OIT expenditures, but the committee believes that some valuable lessons can be learned from an examination of them. These lessons include the following:
-
The great value of OIT as a catalyst for convening industry and bringing together other experts and affected constituencies to address common needs,
-
The advantages of early agreement on goals and metrics for success to guide the development path of a technology,
-
The importance of nonenergy benefits to industry as a driver for the adoption of technology, and
-
The significance of demonstration as a means of promoting technology adoption in these industries.
The OIT approach to the industrial sector has changed dramatically over the past two decades. Originally, it focused on individual technologies (e.g., the lost foam process), but now it is organized around the energy-intensive industries (e.g., metal casting). Once a technology-push program, it is now more a market-pull program.
OIT is now focused on the nation’s energy-intensive industries in the IOF program (see Box 3–3). This initiative brings industry together with its suppliers and other interested parties to roadmap the industry’s future and envision the technology paths and research needs to achieve the goals. OIT examines the portfolio of projects identified by the industry as part of its vision and selects the projects it will support, forging a partnership with industry in this unique manner.
As a complement to IOF, OIT also has a cross-cutting program that focuses on three technology areas: sensors and controls, materials, and combustion.
Demonstration of a technology is critical for its acceptance by industry. The demonstration should be geared to the particular problem that industry is concerned with at the
|
BOX 3–3 Forest Products IOF—Leveraging Resources In 1994, OIT signed a compact with the forest products industry. The industry vision and roadmap documents were created by industry leaders, technical staff, national laboratory personnel, and university researchers. Agenda 2020, developed as part of this IOF process, outlines six areas for precompetitive research. In 2002, 46 projects are scheduled to be funded jointly by DOE ($10.8 million) and the private sector. The Forest Products IOF leverages many outside organizations, such as the American Forest and Paper Association, the Institute of Paper Science Technology, and the Department of Agriculture. Benefits to date have included the commercialization of one technology, the demonstration of some others, collaborative input into the EPA cluster rules, and continuing cooperation in research to leverage resources. |
time. This is another important reason to have operational management and not just technical staff involved in agenda setting and working out strategies for the research program and technology adoption. The committee believes that DOE is doing a good job of bringing the right people together to develop the strategies. DOE recognizes that these strategies need to examine a variety of factors, not just technical ones. These factors will range from environmental regulations to the timing of major capital investments.
While its financial support for a demonstration is important, having OIT involved in the demonstration is also important. Such involvement carries with it the assurance that the technology is effective and that expertise from sources other than just the vendor of the technology will be available to address any unexpected problems. And, from the perspective of the end-user, the driving force for a demonstration may not be the energy savings potential. The oxy-fuel glass furnace illustrates the importance of demonstrations in the OIT program (Box 3–4).
According to OIT, the nine IOF energy-intensive industries—aluminum, agriculture, chemicals, forest products, glass, metal casting, mining, steel, and petroleum—account for about 80 percent of the nation’s use of energy for manufacturing. They also have many environmental issues they must address and are generally waste-intensive. Their high energy use makes them a logical focus for OIT, although there are some potential contradictions and caveats.
Precisely because these industries are the most energy-intensive, they should have the most incentive to conduct R&D on efficient technologies that would improve their utilization of energy. However, for a variety of reasons—foreign competition, low profit margins in commodity industries, or low energy prices in the past decade—these industries have not aggressively pursued such research.
OIT’s role—it stimulates roadmapping and visioning by bringing representatives of industry together to address precompetitive issues and technology needs—is a critical one, applauded by industry. The committee believes it should be continued.
Like OIT, the committee believes it is valuable to have both the technical experts and operational management present from the industry when the roadmaps are prepared. It also finds that OIT has been successfully proactive in reaching out and broadening participation in the IOF.
At the same time, the committee believes that OIT must ensure that its own research agenda does not become too applied and focused on the short term owing to the natural tendency of industry to focus on applied, shorter-term research. OIT should always carefully weigh and integrate the public benefits to be achieved, and it should have energy efficiency as a primary evaluation criteria even as it considers the other benefits, such as improved productivity, that may result from developing a specific technology. It needs, as well, to recognize at the inception of a program, during the road mapping, that its role and funding levels will change over the technology development path.
|
BOX 3–4 Oxygen-fueled Glass Furnace Demonstration: Promoting Technology Adoption Using a mixture of gases that is 90 to 99 percent oxygen instead of ordinary air in furnaces reduces energy consumption between 15 and 45 percent, depending on the size of the furnace. Significant reductions in NOx and particulate emissions are also achieved, as well as an increase in throughput Oxygen had been used in very small furnaces, but OIT took the initiative in 1988 to sponsor research on new means to extract oxygen from air and then funded a demonstration of an oxygen-fueled midsize glass furnace using this new technique. The potential reduction in NOx emissions convinced the end user to participate in the demonstration. The demonstration achieved about a 25 percent reduction in energy use, an 85 percent reduction in NOx emissions, and a 25 percent reduction in particulate emissions. While only very small specialty furnaces and no midsize glass furnaces were using oxygen at the time of the demonstration in the early 1990s, by 1995,11 percent of U.S. commercial-grade furnaces were using oxygen. This increased to 28 percent by 2000. Both the demonstration and continued DOE outreach to the industry through the glass IOF have been critical to achieving this sharp increase in market penetration. Through 2005, the realized economic benefits from this technology, as reflected in the case study, are projected to be $300 million (1999 dollars). |
The importance of developing good metrics at the outset of the development program is illustrated by the advanced turbine program (Box 3–5). Goals were set to achieve particular public benefits from the technology, and the research followed from those goals.
The combination of energy savings, productivity improvements, and environmental benefits can make a compelling case for industry to adopt a technology, although the most important driver can vary from case to case. Often, energy savings may be much less important than other reasons for industry’s interest in the technology. However, sometimes energy-efficient technologies lead to benefits in all three areas.
A program investigating the use of oxygen instead of air in the combustion process began before the glass IOF came into existence. It has been successfully incorporated into that program and is now finding application in other industries. The technology is successfully saving energy and penetrating the market. As noted previously, the committee believes that once a technology has been commercialized, the OIT role needs to be examined and perhaps changed.
The committee believes that any changes in the nature or amount of OIT support due to the movement of a technology through the development process are best agreed upon at the beginning. At that time, the participants from industry and other affected constituencies should concur on OIT’s role—and indeed their own roles—as the agreed-on performance metrics are met. Clear metrics for the technology development will also facilitate oversight and management of the programs. The committee, on the basis of its conversations with both industry representatives and OIT staff, considers that OIT is moving in this direction and encourages the movement.
|
BOX 3–5 Advanced Turbine Systems: Improved Performance Goals In 1992, DOE began a program to produce turbines that were 15 percent better then the 1991 baseline, had 10 percent lower NOx emissions, and had a 10 percent lower cost of electricity than conventional systems meeting the same environmental requirements. The EERE program concentrated on turbines of less than 15 MW, and the Office of Fossil Energy covered larger-scale applications. The federal R&D funding for smaller turbines challenged the industry to work on performance targets that their own development plans had not originally incorporated. These targets have been significantly exceeded in field testing of the technologies. Working closely with the affected constituencies, including state agencies, suppliers, and end users, enabled a dynamic research program that evolved in light of changing market conditions and other factors but remained true to the original performance metrics. |
In conclusion, on the basis of the case studies, interviews with experts in industry, and a review of the report IMPACTS Office of Industrial Technologies: Summary of Program Results, prepared by DOE,6 the committee believes that the OIT industrial programs are cost-effective and have produced significant energy, environmental, and productivity benefits for both the industrial sector and the country (DOE, 2000b). The knowledge base, as is made clear by the benefits matrices in the case studies, has also been expanded by many of these research initiatives. The matrices in the case studies present the range of benefits the committee found from the technologies. Since the industrial sector accounts for approximately 36 percent of the nation’s energy use, the impact is large.
Many of the technologies the committee examined are already producing benefits for industry and the nation; some are still in the initial stages of research. The importance of the nonenergy economic benefits—such as improved productivity—that are achieved by some of these technologies often far exceeds the energy savings, and they are frequently the primary reason for the technologies’ adoption by industry. Many of the technologies are achieving very significant benefits of all types—energy savings up to 25 percent are common; productivity improvements of over 40 percent have been achieved—and they are rapidly penetrating into the industrial sector.
TRANSPORTATION: LESSONS LEARNED FROM THE CASE STUDIES
Transportation uses about 27 percent of all energy consumed in the United States. Petroleum represents about 38 percent of all energy, and 71 percent of that petroleum is used for transportation (EIA, 1998). Within the transportation sector, highway transportation accounts for approximately 75 percent of all transport energy use, which makes it 53 percent of all U.S. petroleum demand (EIA, 1998). Highway transportation also accounts for the equivalent of about 10 million barrels of oil per day, compared to our net oil imports of about 9.9 million barrels per day (EIA, 1998; Davis, 2000). Disruptions or price hikes in the U.S. petroleum supply could cause massive damage to the U.S. economy and to national security (Greene and Tishchishyna, 2000). The above numbers make clear the critical importance of highway fuel consumption to the U.S. energy picture and the reason for DOE’s considerable R&D activity in highway transportation. The transportation technologies budget accounted for about 40 percent of the energy efficiency R&D budget in 2000.
The greatest changes in highway transportation energy consumption since 1978 have come about because of the CAFE regulations set by Congress in 1975, counterbalanced by the increase in vehicle population and miles traveled. After 1978, the average number of gallons of fuel consumed per vehicle (all motor vehicles) decreased by 12 percent (EIA, 1999), but motor vehicle registrations increased by 35 percent and total vehicle miles traveled increased by 71 percent. As a result, all motor fuel consumption increased by 33 percent (FHA, 1999). According to an EPA report (EPA, 2000), new passenger car fuel economy in 2000 was 28.1 mpg, while light trucks got 20.5 mpg (the 1978 figures were 14 and 12 mpg, respectively) (EIA, 1999). However, as a result of a surge in sales of light trucks, vans, and sport utility vehicles, the new vehicle fleet fuel economy dropped from 25.9 mpg in 1987 to 24 mpg in 2000 (EPA, 2000). The DOE had little to do with these changes. The improvements in new vehicle mpg were largely the result of industry’s elimination of excess weight in vehicles and improvements in power train efficiency.
How difficult it is for DOE to make any significant improvement in overall motor vehicle fuel consumption must be recognized. It takes many years, perhaps 20 to 30, to penetrate the motor vehicle market with any dramatically new technology. Years are needed to develop the production capability, build the maintenance infrastructure, convince consumers of product reliability and quality, and then to fully turn over the remaining manufacturing plant and the existing conventional vehicle stock. Public policies, technology-forcing regulations like CAFE, subsidies, or other incentives can speed this process somewhat, but these effects are limited and generally beyond DOE’s control.
Another difficulty is that the automobile industry has spent a century improving and optimizing its products and in the process has already examined in some depth the alternatives to the internal combustion engine. Moreover, for the past 25 years the pressure of CAFE has intensified industry’s R&D on fuel economy. These factors limited the potential for DOE to make significant contributions. DOE chose initially to focus on alternative power plants, Stirling engines, gas turbines, and battery-powered electric motors. Alternative power plants had been researched for many years by industry, but they were still being championed by promoters. The hybrid electric power train entered the picture later—again, not as a new concept, for it, too, had been looked at previously. However, the development by 1993 of systems engineering and power electronics to control the interactions between two separate power sources for propulsion offered a new opportunity for hybrid electric vehicles to compete with conventional vehicles. Researchers recognized the opportunity, and DOE initiated work in this area. The possibilities of fuel cell power plants for motor vehicles also emerged rather suddenly, originally from the National Aeronautics and Space Administration (NASA), and DOE and industry worked together to develop this approach.
Before 1993, much of DOE’s passenger car R&D was conducted under various contracts and cooperative research and development agreements (CRADAs) with industry partners. DOE also supported several industry partnerships and consortia, including a hybrid electric vehicle program, the USABC (United States Advanced Battery Consortium) (see the case study “PEM Fuel Cell Power Systems for Transportation”), and the United States Automotive Materials Partnership (USAMP). In September 1993, most of the passenger car R&D then under way was rolled over into the PNGV (see Box 3–6 and the case study “Partnership for a New Generation of Vehicles”). Congress did not augment the FY 1994 budget for PNGV, so there was not a large increase in activity or redirection of the work.
In 1996, DOE created the Office of Heavy Vehicle Technologies to specifically address the issues of heavy-duty vehicle energy efficiency, the ability to use alternative fuels, and reduced emissions. The DOE budget for this program from 1996 through 2000 was $219 million. Actually, 22 percent of this amount was devoted to small diesel engines for light-duty trucks and sport utility vehicles. In 1999, the heavy-truck industry’s cost share was 72 percent for the total program. The program was essentially rolled over into a new program in 2000, the 21st Century Truck Initiative, which, much like PNGV, would conduct a program to improve fuel economy and reduce pollutant emissions, but with participants from the heavy-truck industry. The program includes diesel hybrid power trains and engines powered by natural gas.
Between 1978 and 1997, a number of R&D programs were terminated. Some were terminated in the course of the down-selection process during PNGV because of the poor likelihood of their success given the goals and time frame of PNGV. Although the committee did not prepare case studies on all of the following programs, committee members knew them well and were able to summarize them:
-
Automotive Stirling engine (1978–1987 and 1993–1997; $231 million). The program was twice terminated for a variety of technical and economic problems: lower than expected thermal efficiency, high heat rejection requirements, poor specific power, excessive hydrogen leakage, and high costs (see Appendix E).
-
Automotive gas turbine development (1978 through 1997; $300 million). All of the gas turbine work was terminated as part of the downselection of technologies in 1997 under the PNGV. Despite large R&D investments over many years and several different engine concepts, difficult technical hurdles remained for gas turbines to overcome before they could be competitive with conventional engines. It was felt that the diesel engine had a higher probability of meeting the challenges of efficiency, emissions, reliability, and durability in the time frame of PNGV. Two developers (Allison Engine Company—now Rolls Royce—and Allied Signal—now Honeywell) continued development of the engines and
|
BOX 3–6 Partnership for a New Generation of Vehicles The Partnership for a New Generation of Vehicles (PNGV) was formed in 1993 with three goals: (1) develop by 2004 production-prototype, midsize sedans with up to 80 mpg while meeting all regulated emission requirements, (2) improve U.S. competitiveness in manufacturing technology, and (3) implement as soon as possible improvements in conventional vehicle efficiency and emissions. The participants in the partnership are DOE, the United States Council for Automotive Research (USCAR) (Ford, GM, and DaimlerChrysler), the national laboratories, automotive suppliers, and universities. DOE was expected to concentrate on long-range, high-risk, more basic research while industry participants carried out the applied development of actual products. The DOE to date has spent about $600 million, with a nominal 50 percent in matching funds from industry. There has been large in-house additional private funding by the car manufacturers. In 2000, a significant milestone was reached when the three car manufacturers demonstrated concept cars with fuel economies of 70 to 80 mpg and most of the performance, comfort, and convenience of current vehicles. However, they did not reach the affordability and emissions goals of the program. A principal feature of these concept cars was a hybrid power train comprising a small diesel engine and an electric propulsion motor working in parallel. Hybrid diesel or gasoline engine power trains are now ready for production except for problems with cost and, in the case of diesel engines, emissions. However, the manufacturers are proceeding with plans to market vehicles using hybrid power trains in some market segments (mostly sport utility vehicles and pickup trucks) in the next 3 or 4 years. These vehicles are not expected to have 80 mpg but rather will have 10 to 40 percent improvements in fuel economy over comparable conventional vehicles. Their market penetration remains to be seen. Fuel cell vehicles have been the subject of intense R&D. They would significantly reduce emissions but have serious problems remaining, both technical and economic. The fuel supply and preparation are also still uncertain, affecting overall efficiency and the required infrastructure. PNGV has had very few realized benefits of any kind to date. However, it could save a huge amount of petroleum consumption if overall success is achieved, a significant benefit even if the other goals are only partially attained. The price of these petroleum consumption benefits is liable to be of negative economic benefit to the nation, since PNGV vehicles will probably cost more than conventional vehicles. From the experience of PNGV, it is clear that partnerships of DOE with industry can be very beneficial, with joint selection and guidance of a portfolio of projects, including early consideration of marketing issues and the appropriate termination of projects showing inadequate progress toward goals. |
-
are using them in other applications (as Army tank auxiliary power units and turbogenerators, respectively).
-
Structural ceramics for automotive turbines (1978 through 1997; $100 million). This program supported the automotive gas turbine development efforts and was terminated at the same time. Some of the ceramic materials research was transferred to OIT and continues today. The industry has benefited from the research on designing with ceramics, processing techniques, and joining technologies.
-
Ultracapacitor energy storage (1990 through 1997; $7 million). This research was terminated because the cost of the materials (ruthenium oxide) needed to make high-power capacitors was not potentially competitive with alternatives in the high-volume auto market. Also, competing high-power energy storage technologies based on batteries offered more promise. The developers continued ultracapacitor development for application in power electronics and stationary energy storage, among other uses.
-
Flywheel electromechanical energy storage (1993 through 1996; $26 million). Flywheel work was terminated because of concerns about the safety of the high-speed rotors and because the stage of flywheel development was incompatible with the PNGV time frame for producing concept vehicles and prototypes. The flywheel developers have continued to attempt to commercialize them for stationary power storage such as for uninterruptible power systems and critical computer systems.
-
Diesel bottoming cycle (1970s through 1985). The research was discontinued because of the cost and complexity of the engine and auxiliary systems. In addition, competing enhancements to conventional diesel engines showed more promise for increasing power density, efficiency, and durability. The developers did not continue the research after DOE support was discontinued.
-
Electric vehicle program (1977 through 1990; $85 million). The research was discontinued because of the shift toward hybrid electric vehicle development. Electric vehicle battery research continued with the USABC, but DOE efforts to develop electric vehicle drive trains were halted. Ford, GM, and the other automotive companies continued electric vehicle development without further government funding and eventually offered them for sale in California and to fleet operators nationwide. Derivatives of some of the drive train components that were developed in the DOE program are used in those vehicles. General Motors discontinued production of its EV-1 electric vehicle in 2000 due to poor acceptance by the public (see case study “Advanced Batteries for Electric Vehicles” in Appendix E).
At the present time, PNGV is DOE’s largest effort in the transportation sector and is scheduled to continue until 2004. Hybrid electric power trains with either diesel or gasoline engines are being actively pursued as the near-term choice for highly efficient vehicles, and fuel cells (see Box 3–7) are
being intensely researched for the longer term. Considerable progress has been made in both areas, and there are indications that hybrid electric vehicles will be marketed by the Big Three auto companies by 2004. The fuel cell R&D also shows considerable promise, although serious problems remain.
Some of the manufacturing and materials R&D from PNGV has already produced realized benefits. The 21st Century Truck Partnership, just getting under way, is attacking another important segment of motor fuel consumption and promises additional gains.
Summary of DOE’s Transportation Technology R&D
To date, DOE’s transportation technology R&D has had very little effect on the energy consumption or environmental impact of the U.S. transportation sector. Many programs prior to 1993 were generally unsuccessful in meeting their goals, as indicated above. The PNGV program, while so far falling well short of its principal goal of developing a marketable 80-mpg car, has had some successes in developing useful manufacturing technologies that are just being introduced in production. Also, there is promise that, as a result of PNGV, motor vehicles with significantly improved fuel economy will be introduced into the market in the near future. Whether they will make up a significant fraction of the U.S. fleet and thus mitigate the relentless increase in transportation fuel consumption remains uncertain.
DOE transportation R&D is split among several offices and is conducted by a variety of entities. PNGV, the USABC, and the 21st Century Truck Initiative are major activities, all directed at similar goals and with overlapping technologies. They need to be well coordinated and in good communication with each other. It would appear to be up to DOE to ensure this coordination and communication on preproprietary R&D, because industry participants are usually somewhat reluctant sharers.
The light truck and sport utility vehicle segments of the transportation system were largely ignored until recently, when they came to represent about 46 percent of the light-duty market (EPA, 2000). Heavy-duty trucks and buses, which consume about 25 percent of the motor fuel in the United States (EIA, 1998), also received inadequate attention until recently. Fortunately, much of the PNGV technol-
|
BOX 3–7 Proton Exchange Membrane Fuel Cell: Insurance from a High-Risk Technology It may be that the world must further constrain its emissions of regulated pollutants and of greenhouse gases, like CO2, as well. But how can that be done while still retaining the personal automobile as a principal form of transportation? The proton exchange membrane (PEM) fuel cell vehicle, picked by PNGV as the long-term alternative to the internal combustion engine (ICE) hybrid vehicle for achieving the 3X fuel economy goal, may provide one practical answer. There are other possibilities, of course, such as electric vehicles with electricity from renewable or nuclear sources and biomass-fueled ICE hybrids. But the fuel cell vehicle is high on the list because of the potential for ultralow emissions, high efficiency, fuel flexibility, and high performance. Enormous progress has been made as a result of DOE and private investment since 1990. This investment has stimulated interest, so that now the private sector invests more than DOE. It is a risky business, however, because of the remaining technical and economic problems, including the especially formidable one of getting the cost of PEM fuel cells down to a competitive level. But Ford, DaimlerChrysler, and General Motors are spending significant amounts of money in the expectation that if circumstances demand it, they can do it. But it’s not just the fuel cell that must work. A whole new fuel infrastructure is required if the personal vehicle is to be decarbonized. If the energy efficiency of fuel supply and preparation is low, then the high efficiency of the fuel cell itself will be attenuated, and if the ultimate source of the fuel is a hydrocarbon, then CO2 from the fuel preparation must be dealt with somehow. Williams (1998) explains one possible approach. Hydrogen is manufactured centrally from fossil fuels (natural gas and coal) with capture of the resulting CO2. The CO2 by-product would be sequestered in coal seams, in depleted oil and gas reservoirs, in deep saline aquifers, or perhaps in the deep ocean. The hydrogen product would be pressurized and piped to filling stations, where fuel cell vehicles are refueled. The vehicle itself emits nothing in use except water vapor. These fuel infrastructure changes would be daunting and expensive. Ogden (1999) points out that the transition might be accomplished gradually, with hydrogen produced first from natural gas at distributed filling stations. Central plants would replace these as the need for sequestration became compelling. Alternatively, hydrogen might be supplied without carbon emissions from the hydrolysis of water using off-peak nuclear power or renewable electricity. The fuel cell vehicle may be considered as technological insurance to reduce the cost of avoiding adverse climate change. In the bargain, cleaner cities could result. This is the sort of R&D the government should support. The potential public good benefits are worth the high investment risk. The private sector is unlikely to take this risk alone. |
ogy for midsize sedans will be applicable to sport utility vehicles and light trucks, and the manufacturers are carrying forward on that. The heavy-duty truck sector is now being accentuated by DOE’s recently established 21st Century Truck Initiative, and again some of the PNGV technology is applicable.
While none of these programs has yet made a dent in the nation’s energy consumption, none has attained the required degree of emissions control, and none has reached the affordability goal, progress has been made, and the committee believes that at least partial success is almost certain.
Lessons Learned
From the case studies in the transportation sector, especially from the PNGV case study, the committee believes that the following lessons are evident:
-
The most significant lesson learned from DOE’s transportation technology R&D is that DOE can be highly effective in stimulating and aiding R&D in the private sector by partnering on programs aimed at the public good. An important feature of such partnerships is the teaming of government and industry representatives in the selection and planning of the research projects to be pursued. By this means, appropriate roles for DOE and industry contributions can be determined, overall integration of the program is advanced, and buy-in by all the partners in the final result is more probable.
-
A second lesson is that good lines of communication need to be established over the full range of directed exploratory research, development, demonstration, and deployment to market. Inputs from industry on marketing must be carefully considered in the implementation of any new technology, and they should clearly be included early in any R&D program, as they were in PNGV. Typically, DOE has not considered the market or made efforts to assess consumer needs before embarking on new technology development. To deal with these issues and to avoid wasted effort and money, DOE needs inputs from the companies involved in marketing the technologies. DOE’s role here is to consider inputs from industry about marketing when designing and directing programs in order to avoid waste and focus on barriers to introduction of the technologies.
-
Another lesson learned is that care must be taken to assure that goals and objectives are not set so far out as to be utterly unattainable. This does not mean that “stretch” goals are to be avoided. But it does mean that unrealistic goals should not be promoted to such an extent that interim or compromised successes are ignored and the overall program is incorrectly labeled a failure. PNGV suffers from this threat. The public and news media are not likely to comprehend strategic research goals. Also, deadlines that are set too soon as a result of regulations or improper assessment of difficulties lead to rushed R&D programs too narrowly focused on near-term development.
It is appropriate in a large R&D program directed at a single goal to structure a portfolio of parallel projects with varying potentials for success. However, a clear plan should be in place to terminate (downselect) at the earliest possible time those projects that do not show progress toward realization, with appropriate consideration of the technical barriers and potentials and with reasonable flexibility. Roadmaps with scheduled milestones and go/no-go decision points should be carefully established and frequently reviewed for changes.
DOE should identify in each program the most critical barriers to success and focus its R&D on overcoming them. Given limited resources, a smaller number of carefully chosen projects will usually be more productive. In general, long-term, high-risk, directed exploratory research aimed at these critical areas is more appropriate for DOE than near-term product development.
Peer review of large R&D programs on a regular basis is useful for program management, to force researchers from different organizations to communicate, to avoid technical narrowness, and to help terminate programs, which is sometimes necessary.
To decide whether a given public good (benefit) is worth an economic cost to the nation (or the R&D cost to DOE), some measure of the value of that public good is needed. In the case of environmental and energy security, the values are matters of public policy and are ill-defined. DOE may make inputs to these policy decisions, but in the final analysis it can only seek the most cost-effective means to achieve those benefits with the funds available to it, limited only by the point at which R&D becomes ineffective or wasteful. PNGV industry representatives at one point stated that they did not need more funds but rather could use more ideas.
FINDINGS AND JUDGMENTS
The committee agreed on the following set of findings and judgments about the benefits derived from the energy efficiency R&D case studies examined by the committee. These cases were developed from EE7 inputs and with additional inputs from a variety of other sources, including interviews with industry representatives and nongovernmental organizations (NGOs). The cases included by the committee account for only about 20 percent of the total EE R&D budget expenditures from 1978 to 2000. They constitute about 5 percent of the total buildings sector budget, 13 percent of the industry sector budget, and 38 percent of the transportation sector budget.
Finding 1. DOE made significant contributions over the last 22 years to the well-being of the United States through its energy efficiency programs. These programs led to impor-
tant realized economic benefits, options for the future, and a bank of scientific knowledge. The benefits substantially exceeded their costs and led to improvements to the economy, the environment, and the energy security of the nation, as indicated below.
Finding 1a. Economic benefits. The realized cumulative net economic benefit to the nation of a few advanced technologies to which EE was a major contributor in the form of R&D or demonstration were found by the committee to be in the range of $30 billion in 1999 dollars (the calculation considers investments made by DOE and other sponsors, including industry). The benefit dwarfs the approximately $7 billion 1999 dollars of investment in energy efficiency R&D over the history of DOE (22 years).
The results of just 6 of the 17 case studies examined by the committee showed sufficient savings to justify the entire government R&D spending in energy efficiency, as shown in Table 3–4. The numbers in Table 3–4 reflect the committee’s judgments on the effect of the programs based on materials submitted by DOE, the application of the committee’s methodology, and its independent assessment. The preponderance of the benefit is economic, in the form of lower-cost energy services to consumers and businesses—that is, life-cycle energy cost reduction (net of increased capital, R&D costs, and other costs that are unique to the technology) and a resulting increase in productivity. The 6 case studies represent only 6 percent of the R&D cost of the entire program.
Since the 17 case studies reviewed by the committee account for only about 20 percent of the energy efficiency budget, the benefits listed in Table 3–4 must be considered an underestimate for the entire energy efficiency program. (It would behoove DOE to extend this analysis to the remainder of the energy efficiency R&D portfolio and to consider, where appropriate, ranges of uncertainties.)
The committee must draw attention to two important points about the realized economic benefits. First, the benefits are only estimated for technology projected to be adopted by 2005. Recent technology will not have achieved significant market penetration by then, so the estimate should not be viewed as reflecting the potential of a technology in the future.
Second, the committee adopted a 5-year rule to be very conservative about the effect of DOE R&D.8 This rule assumes that the same technology would in any case enter the market 5 years later as a result of private sector R&D and commercialization efforts. The committee’s calculations assumed that the DOE R&D or demonstration accelerated the introduction of new technology into the market by 5 years. The 5-year rule is an oversimplification, the committee acknowledges, but it imparts a conservative cast to the estimation exercise. For some technologies, the 5 years may be much too conservative, and this is indeed reflected in some of the case studies. For example, the building sector is fragmented and supports only limited R&D activities, so government R&D might speed change by much more than 5 years.
The committee used this methodology because it could find no consistent and satisfying way of determining what fraction of each technology’s benefits should be ascribed to the investment in energy efficiency R&D or demonstration compared to input from various partners or other players that may have contributed. The committee judged that the contribution of the DOE energy efficiency program was very substantial in all of the technologies listed in Table 3–4 and that the technology would not have happened easily without DOE involvement.
Even though the technology case studies in buildings and industry represent only a small percentage of the total R&D budgets in these sectors, the committee considers them to be reasonably representative in the sense that failures as well as successes, and completed as well as ongoing projects, were purposely chosen from the energy efficiency portfolio. The committee’s case studies covered a larger percentage of the transportation program budget, since that program is characterized by larger projects. Also, seven case studies were developed for buildings, five for industry, and five for transportation, so each sector was about equally represented.
Given what is in the energy efficiency R&D pipeline, the committee does not consider the remarkable abundance of achievements in the buildings sector (Table 3–4) to be a fluke. Rather, it believes that in any effective portfolio there are likely to be some big winners. Furthermore, the committee judges that the potential future benefits from other parts of the energy efficiency portfolio—for example, from PNGV (including fuel cells), advanced industrial turbine systems, and the Industries of the Future programs—could also be large, particularly in the areas of environment and security. This is indicated in Table 3–5, where each of the 17 case studies the committee examined is slotted into a benefits matrix. When more than one type of benefit is relevant for a case study, the primary benefit is shown in boldface type.
The industrial sector technologies listed in Table 3–4 have also produced significant realized economic benefits, which are not, however, as individually dramatic as those of the buildings technologies. These differences in impact probably arise because an innovation in the buildings sector is often applicable to large numbers of buildings, whereas an innovation in the industrial sector often applies to only one small part of the sector. Energy R&D was reported to have enhanced productivity (e.g., in lost foam casting) as well as
TABLE 3–5 Energy Efficiency Technology Case Studies Slotted in the Matrix Cells That Are Most Relevant Today
energy efficiency. These other benefits are frequently a primary force for a technology’s adoption and may be of as much economic value as the energy savings. The committee has discussed these qualitatively but did not quantify them for purposes of inclusion in Table 3–4.
Nevertheless, the energy efficiency program has contributed to a progression of improvements and innovations in the industrial sector that it estimates has saved 1.6 quads over the years, with an estimated net cumulative energy cost savings of $3.2 billion (DOE, 2000b). The cumulative DOE R&D investment was $2.1 billion. The committee has not validated these numbers and cannot endorse them per se, but it has reviewed the report and discussed it with industry representatives and others. Also, for the three industrial technologies listed in Table 3–4, the oxygen-fueled glass furnace, lost foam casting, and advanced industrial turbines, the estimated net realized economic benefits exceeded the RD&D investment by DOE and its industrial partners. The committee believes, therefore, that the benefits from technologies enhanced by the DOE energy efficiency program are very likely to justify the investment on the basis of energy savings alone, without accounting for any other realized economic benefits.
The transportation technologies examined have not yet produced large realized economic benefits, but they have produced important options and knowledge benefits such as those from the U.S. Advanced Battery Consortium (USABC). Furthermore, PNGV has made substantial progress toward difficult goals, and the promise is great. The same can be said for PEM fuel cells. Some advanced automotive technology, developed in the PNGV program, is ready or nearly ready for deployment if changing economics (oil price) or regulations (CAFE) or environment (climate change) so warrant. It is, in a sense, insurance for the nation. Other advances might be incorporated under current market conditions.
Finding 1b. Environmental benefits. Substantial environmental benefits have resulted from the reduction in the U.S. economy’s use of energy as a result of energy efficiency programs.
The six technologies listed in Table 3–4 have resulted in substantial reduction in emissions of NOx, SO2, and carbon, with cumulative totals of approximately 1 million tons of SO2 and NOx and 100 million metric tonnes of carbon. The committee also tried to estimate a range of monetary values for these emissions reductions based on the costs of damage reported in the literature. These costs depend on many variables such as the population density near emission sites and whether the pollutant is regulated or unregulated. Using a range of estimates bridging the lower end of market trading prices for SOx and various damage estimates—$100 to $7500 for a tonne of SO2, $2,300 to $11,000 for a tonne of NOx, and $6 to $11 for a tonne of carbon (see footnote e in Table 3–4 for the sources used) —the cumulative value of emission reduction is $3 billion to $20 billion. This is between 10 and 75 percent of the realized economic benefits. The committee believes the realized environmental benefits of the technolo-
gies listed in Table 3–4 are at least 10 percent of the realized economic benefits. In addition, other environmental benefits are realized from the R&D associated with technologies in the case studies, including substitutes for hydrochlorofluorocarbons (HCFCs) in refrigerators (and other heating, ventilation, and air conditioning equipment) that do not degrade performance and improvements in indoor air quality resulting from the application of technologies and methodologies developed partially from DOE R&D. However, data were not available to enable the committee to quantify these environmental benefits.
PNGV’s work promises to improve the environment by significantly reducing emissions. While not an option now, in the much longer term the PEM fuel cell, which uses hydrogen, may provide an even cleaner option for transportation.
Finding 1c. Energy security benefits. Energy security has benefited from a number of the energy efficiency programs that have contributed to reducing energy demand.
The committee considered two types of energy security threats. One is the oil price shock that occurs when the world’s oil supply is curtailed for one reason or another. This risk can be reduced by a multipronged approach that includes reducing the quantity of oil used by increasing end use efficiency, developing and deploying technologies that use alternative fuels, diversifying the U.S. oil supply around the globe, and maintaining the Strategic Oil Reserve. Small reductions in oil use are estimated in Table 3–4 from the savings in electricity (about 1/30 of primary energy used in the United States to generate electricity is oil) and in home fuel oil use, due to the more efficient building technologies listed. Cumulatively, this amounts to almost half a quad over the years. The committee assigned a range of monetary values to this savings of $3 to $20 per barrel: $0.2 billion to $1 billion in 1999 dollars (see footnote g in Table 3–4).
The most significant oil savings benefits from the energy efficiency program are embodied in the prospects for PNGV. If the partnership reaches its goals, those savings could be very large indeed. Although the 21st Century Truck Initiative was not evaluated explicitly by the committee, it may hold the same sort of promise.
The second type of energy security threat considered is to the energy system infrastructure—namely, to the reliability of the natural gas and electricity systems. The committee notes that the electricity savings listed in Table 3–4 is a cumulative 4 Q of primary energy, but the committee could make no judgment about the security value of such reductions. Work on technologies such as advanced industrial turbines may make distributed generation and combined heat and power more attractive, and deployment of such systems should improve electric system reliability. The committee did not determine a way to quantify this benefit. However, data are becoming available that DOE could use for such an assessment.
Finding 1d. Knowledge benefits. For all of the case studies the committee found contributions to the nation’s knowledge bank, some of them substantial. Substantial contributions to the nation’s bank of knowledge have been made by such programs as DOE-2; indoor air quality, infiltration, and ventilation (IAQI&V); the U.S. Advanced Battery Consortium; PEM fuel cells; PNGV; catalytic converters for diesels; and advanced industrial turbines (Table 3–5). A large number of specific advances are listed in the matrices for each of the case studies, in Appendix E. These range from the development of improved materials to better manufacturing technology.
Finding 2. The management and institutional structure of the energy efficiency R&D programs often played a significant role in their success. There is no single approach that works for all situations; instead, a rich variety of approaches is needed, and the appropriate one will depend on market conditions, industry structure, and a variety of other factors.
Some important features of success are the following:
-
Regular peer and administrative reviews of large programs can be very productive. An excellent example is the PNGV program, which involved an annual review by the National Research Council (NRC, 2000). Frequent, ongoing communication between program staff and outside panels of reviewers can make the process more collaborative and less confrontational.
-
Consortia can lead to better research agendas (e.g., Industries of the Future and PNGV), better deployment mechanisms (e.g., the lost foam casting technology), and the leveraging of DOE funds (PNGV). On the other hand, they can also lead to overemphasis on short-term results (e.g., USABC). A proper balance between the need to achieve early results and the need to fulfill important longer-term objectives must be maintained. Industry partnerships work if goals, including public good goals, and directions are agreed upon up, if “stretch” but not unobtainable goals are set, if market conditions are continuously considered, if coordination with other agencies is assured, and if peer review is used. The advanced turbine system is a good example.
-
Difficult technical objectives may benefit from a portfolio approach involving parallel projects (e.g., the Stirling engine heat pump and the absorption heat pump). Carefully planned and well-timed reviews of the parallel paths allow sensible, goal-oriented selection of the most promising path.
-
Some important advances in technology have come from small companies or individual inventors who are unwilling or unable to sell their innovation to large, dominant players. In fact, dominant players even obstruct innovation sometimes. In these circumstances DOE has occasionally
-
succeeded by partnering with the innovator and working with it until the value of the innovation is realized. Low-e glass is an example.
-
DOE has often acted as a catalyst to encourage the development of better technologies. A prominent example is the Industries of the Future program, where representative groups for each energy-intensive industry were brought together or asked to establish a common vision of the future and develop roadmaps to identify serious energy and environment problems for mobilization of common resources.
-
The committee found that the DOE energy efficiency program did not analyze its successes or its failures with adequate diligence to provide timely feedback to the R&D management process. At times, it overvalued its successes (see, for example, the case study on DOE-2 in Appendix E), it did not always use a consistent and disciplined methodology for estimating R&D benefits and costs, and it did not always terminate unproductive R&D in a timely fashion (e.g., the Stirling heat pump and the Stirling automotive engine).
Finding 3. DOE’s ability to integrate R&D with other policy and market-conditioning activities is often an effective means and sometimes a necessary condition for substantial market penetration.
These activities include standards, demonstrations, regulations, tradable emission permits, tax credits and other incentives, information and even government-led voluntary actions. The R&D program can maximize its effectiveness when these other policies are considered and utilized as appropriate to promote a technology’s development and adoption.
The periodic application of more and more stringent performance standards for refrigerators (and other appliances), integrated with government R&D for assessing independently the economic life-cycle justification of the prescribed increase in performance, has been very effective in bringing to market a continuous stream of ever more energy-efficient refrigerators. The R&D even proved effective in maintaining high efficiency in refrigerators despite the banning of CFCs and HCFCs as refrigerants. As happened in this case, environmental regulations will sometimes work against efficiency improvements. Meeting the PNGV goal of tripling automobile fuel economy is certainly made more difficult by the Tier 2 Clean Air Act emission standards. This suggests that different regulatory agencies need to balance their requirements in a systematic manner to ensure the best overall good for the nation.
Demonstration is another powerful policy, particularly important for the industrial sector, as exemplified by the oxygen-fueled glass furnace and the lost foam casting process.
Finding 4. DOE has often not had sufficient budgetary or institutional emphasis on what the committee refers to as “directed exploratory R&D” (DERD), which is research organized around specific identified technical problems that are barriers to progress in a particular area.
The required research may be fundamental in nature. For most of the energy efficiency programs, DERD is organized as a part of each major program. In the Advanced Batteries for Electric Vehicles case study, DERD competed (sometimes unsuccessfully) for support against shorter-term priorities even though the technical difficulties suggested greater emphasis on DERD was needed.
PNGV does support DERD, but the work is sometimes poorly integrated into the mainstream of the program because communications are inadequate. The Advanced Turbine Systems Program is an example where DERD was adequately planned and integrated.
DERD could also be accomplished by working closer with DOE’s Office of Basic Energy Sciences and integrating and linking the projects funded under the FY 2000 congressional Energy-Efficient Science initiative.
Finding 5. Lessons learned from the energy efficiency programs indicate that differences between the three end-use sectors are important determinants of strategies that work for each. For example, standards may be appropriate for buildings, and consortia may be appropriate for industry.
Finding 5a. Buildings. The buildings industry has been and is still fragmented and possesses little capacity for R&D. ASHRAE, the Advanced Refrigeration Institute (ARI), the Electric Power Research Institute (EPRI), the Gas Technology Institute (GTI, formerly GRI), the National Institute of Standards and Technology, and manufacturers of materials and equipment, including appliances, sponsor precompetitive R&D. Other organizations associated with building contractors, owners and facility managers tend not to sponsor energy efficiency RD&D. For this sector, standards development integrated with R&D has been shown to encourage innovation that favors energy efficiency in equipment and for whole buildings. To a limited extent, there is some R&D being undertaken by foreign countries and foreign companies.
R&D in support of standards has been very effective. One example is standards for appliances (e.g., refrigerators). Another is for building systems, where DOE-2 results were used to support building standards. But there is still a need for innovation in building components (e.g., low-e glass) that may not fit easily into standards setting. DOE’s encouragement of R&D on individual targets of opportunity outside the setting of standards is still important. Furthermore, as community, infrastructure, productivity, and energy security become more and more important, the focus on energy efficiency blurs. EE must integrate its approach on energy with the other main drivers of the sector.
Finding 5b. Industry. U.S. industry is highly diversified and generally very competitive. Getting companies to work together on problems of energy, environment, and security is difficult and sometimes illegal. The Industries of the Future Program is a good strategy for achieving an industrywide focus on the right problems by mutual agreement. Industries of the Future targets each major energy-using industrial group, builds a consortium in partnership with DOE, and develops a strategic plan for joint R&D focused on mutual goals concerned with the public good.
The importance of this strategy is illustrated by the Forest Products IOF Program and Black Liquor Gasification case studies. It is doubtful that effective demonstration of the gasification combined cycle for black liquor can be worthwhile unless the forest products consortium works with DOE.
Crosscutting areas of innovation deserve continuing attention outside the Industries of the Future arena. And as noted above in the section on the building sector, the industrial program must continue to integrate its focus on energy with the other main drivers in the industrial sector, such as productivity or the environment.
Finding 5c. Transportation. The transportation vehicle industry consists of a few major manufacturers with a myriad of suppliers. The industry has a large R&D capability and capacity. For this sector, PNGV, which is a consortium of the manufacturers, USCAR, and government agencies, has proved effective in mobilizing joint R&D efforts on more efficient automobiles. This model is now being copied for the 21st Century Truck Initiative. In a way, PNGV and IOF are variations on a theme. The U.S. Advanced Battery Consortium is a fourth such example. Government/industry R&D partnerships can be an alternative to standards and regulations, or they can lead to the setting of better standards and regulations. If oil use is to be reduced, more efficient vehicles with very low emissions must be invented, manufactured, and marketed. Partnerships seem to be a good way to mobilize the R&D community, but the market will probably require conditioning with standards or some other policy instrument before efficient vehicles are widely adopted. In this sense, transportation and buildings have something important in common.
RECOMMENDATIONS
This assessment of the costs and benefits of DOE’s energy efficiency R&D programs since their inception nearly two decades ago resulted in many insights into the planning and design of research, technology development, and demonstration, and into efforts to accelerate deployment of technology in the world marketplace (since U.S. companies are globally focused for export factors and consideration of global climate change). Just as important, however, the assessment yielded some general recommendations for establishing mechanisms for tuning DOE’s energy efficiency initiatives to the changing marketplace, for providing a balanced portfolio designed to maximize the likelihood of deploying new energy efficiency technologies under a wide variety of market conditions, and for focusing the R&D portfolio on technologies where federal support is needed or warranted and for developing options and increasing knowledge. These general recommendations fall in three groups: ongoing planning and evaluation, achieving R&D portfolio balance, and promoting the adoption of technology.
Ongoing Planning and Evaluation
Some system of identifying and measuring the benefits of R&D is crucial to making decisions about changes in programs. The methodology offered in this assessment, that is, the benefits matrix construct used throughout the case studies and analysis, while not perfect, goes a long way toward providing an orderly classification, order-of-magnitude measurement, and evaluation of the benefits of R&D initiatives in energy efficiency. The committee recommends that this methodology, or some extension of it, be developed for (1) ongoing planning and program evaluation purposes, (2) retrospective evaluations, and (3) incorporation into the department’s annual process for compliance with the well-known Government Performance and Results Act (GPRA). In the committee’s judgment, the methodology is most likely to succeed if it does the following:
-
Shows consistency across the energy efficiency program and to the maximum extent possible, consistency with fossil energy and other program offices in DOE and is publicly transparent in all its assumptions.
-
Incorporates a rigorous system of peer review across the R&D portfolio. The potential for this feature is illustrated by the role peer review has played in the DOE-sponsored Industries of the Future program and PNGV.
-
Establishes a firm go/no-go decision date for terminating or continuing a project or a program. The efficiency of such a feature is illustrated by its use in the PNGV program, which has allowed successively focusing the program’s resources on areas with the most promise of success.
-
Establishes milestones for all programs and projects that can be used in conjunction with established goals for measuring progress and detecting problems. Use of milestones for monitoring progress is a well-known best practice in managing any R&D portfolio, and the DOE energy efficiency portfolio could benefit from more widespread use in managing program and project decisions, as shown in the advanced turbine systems case study.
-
Establishes measurable evaluation criteria and the procedures necessary to ensure the validity and reliability of the reported results.
To address funding, the committee judges that process
and methodology should be part of DOE’s ongoing and new programs, and adequate funding should be provided for data and analysis. This ongoing planning and evaluation analysis cannot substitute for the portfolio analysis and roadmapping exercises9 instituted over the past 2 years at DOE, but it provides an important supplement to that analysis.
Achieving R&D Portfolio Balance
In reviewing the array of benefits matrices constructed for this assessment, the committee observed that a sense of urgency about deployment and perhaps the availability of near-term, high-payoff opportunities over the past decade have caused directed exploratory research in energy efficiency to be underemphasized. The committee recommends that this kind of research receive more emphasis as the energy efficiency R&D portfolio is shaped in future years. Indeed, balance across all “regions” of the benefits matrix should be a high-priority goal, with elements of the program designed to respond to and yield benefits under a wide variety of future market conditions. Concepts and technologies with longer time horizons, for example, might have enormous payoffs under various possible future economic and environmental scenarios, and efforts to develop such concepts and technologies deserve a more prominent place in the DOE portfolio. To achieve balance in the portfolio, a broad range of considerations should be addressed, including the following:
-
Coordination of technology development with policy mechanisms, such as codes and standards, in scenarios of deployment (as in the very successful refrigerator program, which advances with a careful balance between efficiency standards and technology development);
-
The role of industry and government (at all levels) consortia in technology development (as, for example, in the case of PNGV);
-
The impact of economic globalization on energy and technology markets (as, for example, when such globalization affects the location and relative market strength of high-efficiency lighting technology suppliers around the world);
-
Provision of enabling tools to help facilitate market penetration of new energy efficiency technologies (as, for example, in the case of the development of the DOE-2 family of computer design and analysis tools); and
-
Integration of energy efficiency technology development with other driving forces such as health, safety, and productivity (as, for example, in the cases of IAQI&V, PNGV, and IOF).
Promoting the Adoption of Technology
Market adoption of technology should be an explicitly identified and central goal in DOE’s energy efficiency policies and programs. This assessment revealed many examples of effective programs and projects with a focus on adoption by the market, but many of these program efforts appear to be formulated and executed ad hoc rather than in a coordinated manner across the portfolio. If a policy priority is established for promoting the adoption of new energy efficiency technologies, the committee recommends that additional and well-coordinated emphasis in this area be effected across the energy efficiency portfolio.
For example, in energy efficiency for buildings, coordination with regulatory and policy mechanisms has proved very effective in improving the energy efficiency of commercial buildings and appliances. Similarly, in energy efficiency for industry, sponsorship of key demonstration efforts has been very effective.
Such efforts could yield benefits far greater than the costs of implementing them. Industry and government consortia could play a key role, as they did in the PNGV program, which so far shows great promise. Other interagency government programs, such as that with the Environmental Protection Agency, and government implementation programs, such as that of the Federal Energy Management Program, could be developed much further.
REFERENCES
Builderonline.com (Builder). 2000. Top 100 builders. 1999 Gross Revenue Ranking. Available online at <http://builderonline.com/frmArt/>.
Clinton, J., H.Geller, and E.Hirst. 1986. Review of government and utility energy conservation programs. Annual Review of Energy and the Environment 11:95–142.
Davis, S. 2000. Transportation Energy Data Book. Edition 20, Department of Energy, ORNL-6959. Oak Ridge, Tenn.: Oak Ridge National Laboratory.
Department of Energy (DOE). 1979. National Energy Plan. Washington, D.C.: DOE.
DOE. 1983. National Energy Plan. Washington, D.C.: DOE.
DOE. 1985. National Energy Plan. Washington, D.C.: DOE.
DOE. 1990. National Energy Strategy. Washington, D.C.: DOE.
DOE. 1992. National Energy Strategy. Washington, D.C.: DOE.
DOE. 1994. Strategic Plan. Washington, D.C.: DOE.
DOE. 1997. Strategic Plan. Washington, D.C.: DOE.
DOE. 1998. Strategic Plan. Washington, D.C.: DOE.
DOE. 2000a. Strategic Plan. Washington, D.C.: DOE.
DOE. 2000b. IMPACTS Office of Industrial Technologies: Summary of Program Results. Washington, D.C.: DOE.
DOE. 2001. Press Release: Energy Department Provides $10.9 Million for Energy-Efficient Science Research (January 9). Available online at <http://www.energy.gov/HQPress/releases01/janpr/pr01006.htm>.
Energy Information Administration (EIA). 1997. Annual Energy Outlook 1997 with Projections to 2015. Washington, D.C.: Government Printing Office.
EIA. 1996. Annual Energy Outlook 1996 with Projections to 2015. Washington, D.C.: Government Printing Office.
EIA. 1998. Annual Energy Outlook 1999 with Projections to 2020, Appendix A, Reference Case Forecast (December 9). Available online at <http://www.eia.doe.gov/oiaf/aeo98/aeo98.html>.
EIA. 1999. Annual Energy Review, End Use Consumption. Motor Vehicle Mileage, Fuel Consumption, and Fuel Rates 1949–1998, pp. 3–19, line 18. Available online at <http://www.eia.doe.gov/emeu/aer/enduse.html>.
EIA. 2001. Annual Energy Outlook 2001 with Projections to 2020. DOE/EIA-0383. Washington, D.C.: EIA.
Environmental Protection Agency (EPA). 2000. Light Duty Automotive Technology and Fuel Economy Trends 1975 Through 2000, EPA420-R-00–008 (December). Available online at <http://www.epa.gov/0taq/fetrends.htm>.
European Commission (EC). 1996–2001. ExternE: Externalities of Energy. Available online at <http://externe.jrc.es/>.
Federal Highway Administration (FHA). 1999. Vehicle Registrations, Fuel Consumption, and Vehicle Miles of Travel as Indices. Available online at <http://search.bts.gov/ntl/query.html?qt=Vehicle+Registrations&search.x=11&search.y=3>.
Geller, G., and J.Thorne. 1999. U.S. Department of Energy’s Office of Building Technologies: Successful Initiatives of the 1990s (January). Washington, D.C.: American Council for an Energy-Efficient Economy.
Goldstein, D.B., and H.S.Geller. 1999. Equipment efficiency standards: Mitigating global climate change at a profit. Physics & Society 28(2). Presented at the Conference of the American Physical Society, FPSAPS Awards Session, Columbus, Ohio, April 14, 1998.
Greene, D.L., and N.I.Tishchishyna. 2000. Costs of Oil Dependence: A 2000 Update, ORNL/TM-2000/152 (May). Oak Ridge, Tenn.: Oak Ridge National Laboratory.
Hohmeyer, Olav. 1988. Social Costs of Energy Consumption. Berlin: Springer-Verlag.
McMahon, J.E., P.Chan, and S.Chaitkin. 2000. Impacts of U.S. appliance standards to date. International Conference on Energy Efficiency in Household Appliances and Lighting, Naples, Italy, September 27–29. Naples, Italy: AIEE (Italian Association of Energy Economists).
National Research Council (NRC). 2000. Review of the Research Program of the Partnership for a New Generation of Vehicles (Sixth Report). Washington, D.C.: National Academy Press.
Oak Ridge National Laboratory (ORNL). 1994. Estimating Fuel Cycle Externalities. Resources for the Future.
Office of Energy Efficiency (OEE). 2000. Response to questions from the Committee on Benefits of DOE R&D in Energy Efficiency and Fossil Energy (February 5).
Office of Industrial Technologies (OIT). 2001. Description of the Industries of the Future strategy of the DOE’s Office of Industrial Technologies. Available online at <http://www.oit.doe.gov/industries.shtml>.
Office of Technology Assessment (OTA). 1990. Energy Use in the U.S. Economy, OTA-BP-E-57, NTIS order #PB90–254145 (June).
OTA. 1994. Studies of the Environmental Costs of Electricity. Washington, D.C.: U.S. Government Printing Office.
Ogden, J.M. 1999. Prospects for building a hydrogen energy infrastructure. Annual Review of Energy and the Environment 24:227–279.
Ottinger, R., D.R.Wooley, N.A.Robinson, D.R.Hodas, and S.E.Barb. 1990. Environmental Costs of Electricity. New York: Oceana Publications, Inc.
Pearce, D.W., et al. 1996. The social costs of climate change: Greenhouse damage and the benefits of control. In Climate Change 1995: Economic and Social Dimensions of Climate Change. James P.Bruce, Hoesung Lee, and Erik F.Haites, eds. New York: Cambridge University Press.
Public Law (P.L.) 93–438. The Energy Reorganization Act. 1974.
P.L. 94–163. The Energy Policy and Conservation Act. 1975.
P.L. 94–385. The Energy Conservation and Production Act. 1976.
P.L. 94–413. The Electric and Hybrid Vehicle Research, Development, and Demonstration Act. 1976.
P.L. 95–39. The National Energy Extension Service Act. 1977.
P.L. 95–618. The National Energy Tax Act. 1978.
P.L. 95–619. The National Energy Conservation Policy Act. 1978.
P.L. 100–12. The National Appliance Energy Conservation Act.
P.L. 102–486. 1992. The Energy Policy Act of 1992.
Stirling, Andrew. 1997. Limits to the value of external costs. Energy Policy 25(5):517–540.
Tol, Richard S.J. 1999. The marginal costs of greenhouse emissions. Energy Journal 20 (1):61–81.
Williams, R.H. 1998. Fuel decarbonization for fuel cell applications and sequestration of the separated CO2. In Eco-Restructuring: Implications for Sustainable Development. W.Ayres, ed. Tokyo: United Nations University Press.


