
3
Vulnerability, Risk, and Protection
Robert William Blum, Clea McNeely, and James Nonnemaker
THE ORIGINS OF VULNERABILITY
As the morbidities of youth have shifted from primarily biophysiologic and infectious to social and behavioral, our thinking has changed regarding etiologies. Historically, both medicine and public health have sought to identify the biologic factors and infectious agents that predispose young people to morbidity and death. With mapping of the human genome, our ability to identify genetic factors that create vulnerabilities to a range of life-threatening conditions has reached a heretofore incomprehensible level of sophistication and specification. Likewise, ever since cholera was traced to the Broad Street pump in London, infectious disease epidemiologists have traced disease first to invasive organisms and more recently to behaviors. Thus, over the past generation we have come to understand the link between cigarette smoking and lung cancer, dietary practices and heart disease, and a range of other associations between behavior and health outcomes.
In adolescent health, where more than 75 percent of all mortality is related predominantly to social and behavioral factors, there has been ex-
The authors gratefully acknowledge Ann S. Masten, Cheryl Perry, Linda H. Bearinger, Michael Resnick, and Mary Story for their contributions to the conceptual framework presented in Figure 3-2.
tensive research over the past generation that has strived to identify the behaviors that predispose to negative health status both in the short term (during the teenage years) and long term (in adulthood). This stream of research, as Jessor (1991) notes, integrates behavioral epidemiology and social psychology. Over the past 25 years, it first proposed various theoretical frameworks. More recently it has marshaled the empirical data that support our understanding of how behaviors are interrelated, the factors that influence health risk behavior participation, and the factors associated with avoiding the same behaviors.
One problem that has complicated the research is the lack of a commonly agreed-on language. Specifically, we use the concept of “risk” in two distinctly different ways. One refers to risk-taking behaviors (e.g., smoking, drinking and driving, and unprotected sexual intercourse), which in themselves predispose to negative health outcomes (though in themselves they are not synonymous with the negative health outcomes such as emphysema, vehicular injury, and sexually transmitted diseases). Concurrently, we refer to the “at-risk” adolescent, which in our society too often is code for demographic “disadvantage” (e.g., minority status, poverty, and single-parent families). “At risk” may also refer to other disadvantage. As Rutter (1993), Garmezy (1987), Werner and Smith (1982), and others have shown, disadvantage may be biologic (e.g., diabetes), genetic (e.g., Trisomy 21), familial (e.g., mental illness), social (e.g., violent neighborhoods), or peer related (e.g., antisocial behaviors).
For the current paper, we refer to “vulnerability” as an interactive process between the social contexts in which a young person lives and a set of underlying factors that, when present, place the young person “at risk” for negative outcomes (e.g., school failure, unanticipated pregnancy, injury). Factors predisposing to vulnerability may be biologic (e.g., chronic illness) or cognitive (e.g., how risk is assessed). Vulnerabilities may result from being reared in disadvantaged environments such as in substance-abusing families, abusive/violent environments, or families with mental illness, and it can result from individual characteristics such as aggressive temperament.
Counter balancing such vulnerabilities are the resources (Patterson et al., 1990), assets (Benson, 1997), protective factors (Blum, 1998), and resilience (Masten et al. 1999) that likewise arise from the individual, familial, and social environments in which a young person lives. For example, individual characteristics that repeatedly have been found to be protective include social skills, intelligence, and a belief in a higher power beyond
oneself. Protective family characteristics include a caring parent, an authoritative parenting style, and smaller family size. Likewise, social environments associated with reduced risk include caring nonfamilial adults, collective self-efficacy, and neighborhood engagement. Thus, as a dynamic process one must consider concurrently the factors that predispose to vulnerability and those that protect or buffer a young person from harm.
Vulnerability and Resilience
As a conceptual model, vulnerability and resilience has captured the imagination of researchers and program planners over the past decade. As an interactive process between context and harm-inducing/harm-minimizing factors, this research questions why some who are reared under extremely adverse circumstances appear to live healthy and productive lives while others faced with what appears to be minimal challenges never appear to overcome the adversities experienced in early life. Resilience is not a trait or characteristic that some have and others do not; rather, it represents an interaction between the individual and the environment (Garmezy, 1991). It is “the capacity to recover and maintain adaptive behavior after insult” (Bandura, 1979). Resilience implies resistance to threat, not invincibility (Garmezy, 1991) or invulnerability (Garmezy, 1985). Cumulative risk can defeat the most resilient individual. Rutter (1993) notes that resilience is interactive with vulnerabilities; it is developmental in nature, stemming from biology and experiences earlier in life; and protective factors may operate in different ways at different stages of development.
The developmental research of the 1970s and 1980s initially explored discrete aspects of adolescent development: physiological, cognitive, social, and moral. There was a search to identify universal markers of development; however, it has become increasingly clear through the work of Bronfenbrenner (1977, 1986), Bandura (1979), Harter (1987), and others that development does not occur independent of environment. Rather, it represents the adaptation of the individual to the environments in which he or she lives. Within such an interactive model, not only does the individual adapt to the environment, but the environment positively or adversely impacts development (Sameroff and Chandler, 1975). So, too, organic damage (e.g., brain trauma, severe chronic illness) can impede the physiologic “self-righting” tendency (Sameroff and Chandler, 1975).
Bandura (1979) also reinforced the interactive process of competence, resilience, vulnerability, and development. He observed that behavior is
shaped by rewards and punishments that occur in specific social milieus reflecting social values. In addition, imitation of others (social learning) influences both behavior and self-identity.
Bronfenbrenner (1977, 1986), Sameroff et al. (1987), Bandura (1979), and others viewed the process of development not as the inevitable unfolding of predetermined characteristics, but more as a social construction in which the self develops through an ongoing interaction between the individual and the social contexts and social groups with whom the individual interacts (Berger and Luckmann, 1966). It is this interaction that led Goffman (1959) to observe that culture influences adolescent development through shaping identity, self-perception, and the public presentation of self. Such are the forces that influence, for example, adolescent dress and language, which in turn influence one’s perception of self.
Grotberg (1994) used Erikson’s stages (1950) to show how the acquisition and completion of tasks at each stage in development are closely linked with resilience. She noted that the three major sources of resilience (or protective factors) are an external facilitative environment, intrapsychic strengths, and internal coping skills. These are the same elements necessary for developmentally appropriate stage achievement. For example, an environment of unconditional love is necessary for a child to achieve Erikson’s stage of autonomy. The consequence is a sense of being valued, which results in positive self-esteem (Baumrind, 1989). Positive self-esteem is a characteristic of resilience which, Grotberg (1994) noted, leads in turn to empathy (recognizing emotion, perspective and role taking, and emotional responsiveness), prosocial behaviors (helping, sharing, generosity, and sympathy), and problem behavior avoidance.
The link among vulnerability, resilience, and development rests in their all being interactive processes that endure over time in the context of the environments in which a young person lives. From a developmental perspective, resilience is the capacity to successfully undertake the work of each successive developmental stage in the face of significant factors that predispose to vulnerability (Garmezy, 1991).
Problem Behavior Theory
As conceptualized by Jessor (1992), risk behavior (what others term problem behavior) constitutes various behaviors that jeopardize one or more elements of health or development. Whether the behavior is drinking, early sexual intercourse, or drug use, Jessor argues that these are neither random
nor thrill-seeking but rather “functional, purposive, instrumental, and goal-directed.” Whether or not young people accurately assess the risk inherent in any given behavior, problem behavior theory holds that the actual (or perceived) risk pales next to the developmental goals they advance (e.g., presenting oneself as more mature). Simply stated, beating the odds is not a consideration in adolescent risk taking.
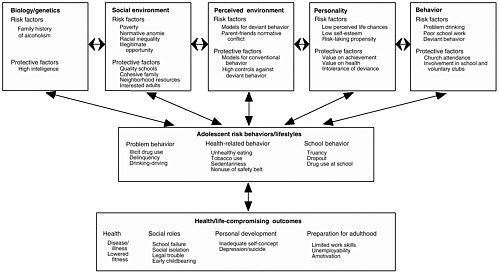
A second tenet of problem behavior theory is that there is substantial individual covariation in risk behaviors among adolescents, and although the pattern may vary regionally, among different ethnic groups, and in different economic strata, there is substantial empirical support for this tenet. Thus, it is reasonable to argue that there are common factors that link these often disparate behaviors (e.g., cigarette smoking and early sexual intercourse). What underlies these behaviors—what Jessor (1992) refers to as the “web of causation”—has five domains: biology/genetics, social environment, perceived environment, personality, and other behavior (see Figure 3-1). Each of these domains has associated risk and protective factors. These factors exert both direct and indirect influences, as depicted in Figure 3-1.
This paper elaborates the ecological model described by Jessor to include six domains: individual, family, peers, school, immediate social environments, and macrolevel environments. Figure 3-2 presents the framework as it is related to childhood through adolescence. This model places peer, school, and family influences on the individual within broader community and macrolevel contexts. Each domain has been the subject of extensive research over the past 20 years; a set of factors associated with risk and protection repeatedly have been identified for each domain. The factors noted within each domain as being either risk or protective are based on a generation of empirical research. As can be seen, most factors with demonstrated protective capacity are not merely the converse of risk factors—yet, some are. Most protective factors constitute a unique set that intersect with each other and with risk factors to create a “risk/assets gradient” for individual young people (Masten et al., 1999). But where risk and protection models are static snapshots in time, the ecological model is dynamic. Behaviors that may or may not result from the predisposing factors in turn enter into the model as factors that influence future development and thus themselves become risk or protective factors.
Although extensive research shows the associations between risk and protective factors and the likelihood of a young person participating in health risk behaviors, much remains poorly understood. Specifically, be-
cause vulnerability is a process, how do protective factors work as buffers to diminish risk? Why are some factors protective or buffering for certain health risk behaviors (e.g., weapon-related violence) but not others (e.g., early onset of intercourse) despite the clustering of health-risk behaviors? These are the questions that are the subject of the subsequent section.
PROTECTIVE MECHANISMS AND VULNERABILITY
The level of vulnerability experienced by an individual or group of individuals (e.g., adolescents as a whole) can be described by the observed risk behaviors and outcomes. However, the consequences of a given level of vulnerability in either the short term or the long term cannot be predicted without also knowing the protective processes that operate to reduce the impact of risk/vulnerability.
Dozens of protective factors have been identified empirically (see Figure 3-2). We have less understanding, however, of how these protective factors work to diminish negative outcomes and/or promote positive ones (Jessor et al., 1998; Rutter, 1993). One reason protective mechanisms are not better delineated is their complexity. Building on the framework in Figure 3-2, this section of the paper presents three general propositions about how protective mechanisms may work to mitigate against negative health outcomes among adolescents.1
-
Protective processes span multiple contexts. Traditionally, research on risk and resiliency has identified protective mechanisms at the individual and the family levels. Additional protective mechanisms also operate at the environmental level (school, neighborhood, and peer group), and these macroprotective processes most likely condition the individual-level protective and risk mechanisms. For example, Sampson and colleagues (1997, 1999) found that individual adolescents were less likely to commit minor crimes in neighborhoods with high collective self-efficacy or in neighborhoods adjacent to those that had high collective self-efficacy. Although they did not test for cross-level interactions, it is possible that the potency of environmental protective factors such as collective self-efficacy depends
-
on the accumulation of vulnerabilities and protective factors at the individual level. An environmental context may be protective for some individuals but increase vulnerabilities for others, depending on their individual-level attributes. For example, Werner and Smith (1992) found that military service promoted long-term work and family stability for young people whose academic plans did not extend beyond high school, but had the opposite effect on those whose plans included post-high school education.
-
Protective processes vary across domains of functioning. For example, a stimulating cognitive environment may promote intellectual development (Guo and Harris, 1999), but it is not necessarily protective for other outcomes such as early sexual intercourse.
-
Protective processes vary across risk processes. The same negative outcome can result from different risk processes. An individual or environmental characteristic may serve as a protective factor for one of those risk processes but not another. Hence a protective process may operate for only a subset of the adolescents “at risk” for a given outcome.
We illustrate the potential ways in which protective processes can function with an example. We select school connectedness to illustrate the pathways of protective influence because it is a protective factor that exerts a sizable effect on adolescent well-being and, in addition, is amenable to intervention. Resnick et al. (1997) found that when adolescents feel cared for by people at their school and feel like they are part of their school, they are less likely to use substances, engage in violence, or initiate sexual activity at an early age. Students who feel connected to school in this way also report higher levels of emotional well-being.
How does school connectedness protect adolescents from harm? Connection to caring adults is one of the key factors that promote healthy adolescent development (see, for example, Werner and Smith, 1992). In addition, students who are connected to school have greater access to school resources (e.g., extracurricular activities, individual investments by teachers, and opportunities with peers) than do their disengaged peers. In this regard, school connectedness operates as a form of social capital that allows students to make use of the human and financial capital schools have to invest in them. But how is school connectedness generated? We illustrate one pathway in this example.
Figure 3-3 illustrates a direct protective process. In this figure, the level of the individual protective factor (school connectedness) is determined, in
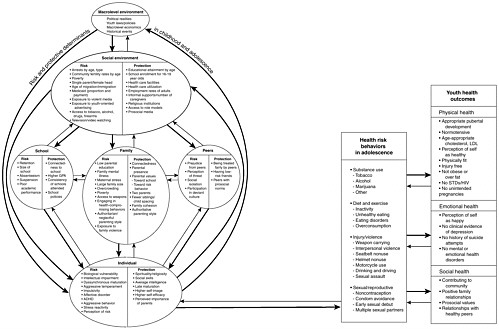
FIGURE 3-2 An ecological model of childhood antecedents of adolescent health risk behaviors and health outcomes.
NOTE: The assignment of determinants as either risk or protective is not fixed as is implied in this model. Some factors may be protective depending on developmental stage or how terms are defined.
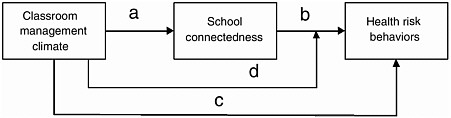
FIGURE 3-3 Direct protective process.
NOTE: See text for explanation of lettered arrows.
part, by the school environment. Specifically, students feel more connected to school when the school fosters a positive classroom management climate (McNeely et al., 2001). This is represented by the arrow marked “a.” School connectedness, in turn, directly affects the probability that adolescents will engage in health risk behaviors (pathway b).
It is also plausible that the classroom management climate has a direct effect on health risk behavior (e.g., violence) irrespective of the individual’s school connectedness (see pathway c). Empirically the existence of pathway c would be supported by demonstrating that the association between the classroom management climate and the outcomes is not mediated entirely by school connectedness.
We also hypothesize that the nature of the direct protective process (pathway b) depends on the level of the school environmental variable. Put another way, the impact of the individual attributes is conditioned by the context within which they occur. For example, poorly managed classrooms (i.e., when students have trouble getting along with teachers, completing homework, and paying attention in class) may diminish the direct protective effect of connectedness because connected students in poorly managed classrooms have fewer resources to draw on than connected students in schools with positive classroom management climates. Conversely, in extremely well-managed classrooms, connectedness also may not be as highly protective because the direct effect of classroom management swamps the effect of connectedness. Alternatively, we might see an interaction such that good classroom management combined with high connectedness is an especially potent protective mechanism. These possibilities are represented by the arrow labeled d.
In the literature on risk and resiliency, protective factors traditionally have been defined as those that buffer or reduce the negative impact of the risk factor. This is illustrated by pathway e in Figure 3-4. In this example,
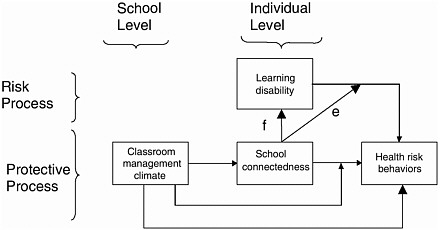
FIGURE 3-4 Protective buffering process.
NOTE: See text for explanation of lettered arrows.
low grade point average and having a learning disability are risk factors for negative health outcomes (Resnick et al., 1997). We select these risk factors for their reported association with multiple health risk behaviors.
Protective factors can buffer risk in two ways. The first possibility is that among students who feel highly connected to school, having a learning disability or a low grade point average confers no additional risk for the outcome because the protective process entirely wipes out the risk for the outcome generated by these vulnerabilities. Luthar et al. (2000) describe this type of effect modification as “protective-stabilizing.” An alternative form of risk buffering is “protective but reactive.” In this scenario, school connectedness buffers the risk generated by a learning disability or a low grade point average, but not completely.
In some cases, protective factors also can reduce or eliminate the risk factor directly, rather than simply mitigate the negative impact of the risk factor on the risky health behavior. This would be the case in our example if feeling highly connected to school directly helped a student improve his or her grade point average. This is illustrated by pathway f. Although not drawn in this figure nor tested empirically in the following text, it is important to note that risk buffering and risk reduction also can be generated directly by protective processes operating at the macro environment (school level).
In Figure 3-5, a causal relationship is hypothesized between the risk factor and school connectedness (connection g) such that having a low
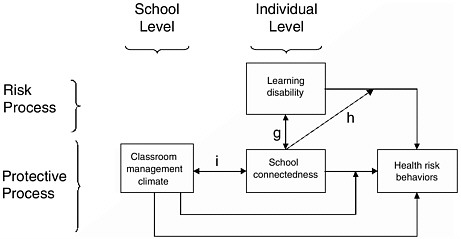
FIGURE 3-5 The risk process may deplete the protective process to the extent that buffering does not occur.
NOTE: See text for explanation of lettered arrows.
grade point average or a learning disability attenuates the individual’s connection to school. This may happen to such an extent that the risk-buffering mechanism played by school connectedness in Figure 3-4 is overwhelmed by the risk. The dotted line of connection h indicates that the buffering mechanism no longer functions. This scenario is consistent with the argument in the vulnerability literature that in the face of overwhelming risk, all individuals will succumb to the risks in their environment. We are not suggesting, of course, that poor academic performance or a learning disability represent overwhelming risk. Determining the direction of the causal relationship between the risk factors and school connectedness requires longitudinal data.
Another bidirectional causal relationship is hypothesized between school connectedness and the classroom climate (connection i). Contextual effects generally are conceptualized as affecting individuals, and individuals are not granted the power in our models to affect their environment. However, in the case of schools, individual students can have a large impact on their environment, particularly a large negative impact. A common grievance of teachers is that one or two “bad apples” in the class disrupt the classroom and divert an inordinate amount of their time away from teaching. This bidirectional causal relationship also would require longitudinal data to test empirically.
We use the example laid out in Figures 3-3 through 3-5 and data from
the National Longitudinal Study of Adolescent Health (Add Health) to empirically illustrate the three propositions at the beginning of this section: (1) protective processes span multiple contexts; (2) protective processes vary across domains of functioning; and (3) protective processes vary across risk processes.
Add Health is a nationally representative sample of in-school youth in grades 7–12 (for a description of the sample, see Resnick et al., 1997, and Bearman et al., 1997). The present empirical illustration uses data from the first wave (1995) in-home sample of 20,775 students and from the parent survey, which was conducted at the time of the in-home survey. The school-level protective factor and the school-level control variables are measured using data from the in-school survey of approximately 90,000 students.
We explore the risk and protective processes for three health risk behaviors: ever had sex, ever used cocaine, and weapon-related violence. Weapon-related violence is defined as having committed at least one of the following acts in the past year: threatened to use a weapon to get something from someone, pulled a knife or gun on someone, shot or stabbed someone, used a weapon in a fight, or hurt someone badly enough to need bandages or medical care. The three health risk behaviors often are considered as part of a problem behavior syndrome (Baumrind, 1989). Although they are correlated, we consider them separately to demonstrate that macro-level protective processes may differ, even across correlated outcomes. As shown in Table 3-1, 40 percent of the sample has had sex. Just 3 percent have ever tried cocaine. A disturbing number of adolescents—nearly a quarter of the sample—engaged in weapon-related violence or beat someone so badly they needed medical care in the past year.
In the present example, the two protective factors are individual-level school connectedness and the average classroom management climate in a school. School connectedness is a scale consisting of students’ reports of how much they agree or disagree with six statements: you feel that your teachers care about you; you feel like you are part of your school; you feel close to people at your school; you are happy to be at your school; the teachers at your school treat students fairly; and you feel safe in your school. The scale has adequate reliability (α = .77) and ranges from 0 to 4. The mean level of school connectedness is 2.66, indicating that most students feel moderately connected to school.
The school-level classroom management climate is the school mean of responses to four questions in the in-school survey. Students were asked how much trouble they have getting along with their teachers, getting along
TABLE 3-1 Description of Health Risk Behaviors, Protective Factors, and Risk Factors
with other students, getting their homework done, and paying attention in class. Responses range from never to every day (0 to 4). The scale was reverse coded so that a higher value indicates a more positive classroom management climate. The classroom management scale has good reliability (α = .83). The schools in this sample have moderate problems with classroom management. The school-level average is 2.4, which equates roughly to each student in the classroom having trouble getting along, paying attention, or doing homework slightly less than once a week. The range across schools is 1.8 to 3.4 (out of a potential range of 0 to 4).
The two risk factors in the model are grade point average (GPA) and having a learning disability. The average self-reported GPA of students is 2.7. Learning disability is a dichotomous variable based on a parent’s report of whether a son or daughter has a learning disability or is in a special education class. A respondent is coded as having a learning disability if his or her parent reports affirmatively to both of these questions.
All analyses include the following control variables: age, 2 years older than average age for grade, 2 years younger than average age for grade,
gender, race/ethnicity, family income, family structure, urbanicity, ever suspended or expelled from school, individual-level classroom behavior (the individual score on the classroom management scale), and the following school characteristics: public (yes versus no), school size, percentage of two-parent families, percentage of African American, and percentage of African American squared.
Our modeling strategy proceeds in three steps. First, the effect of school-level classroom management on individual-level school connectedness is estimated using ordinary least squares regression (OLS) (Model 1 in Table 3-2). Second, the effect of both protective factors, and their interaction, on the health risk behaviors is estimated with a series of logit models (Models 2 through 4 in Table 3-2). Finally, the logit models are reestimated with the addition of the risk factors and their interaction with school connectedness (see Table 3-4 later in this text). All continuous variables in the models are centered, that is, the mean value of the variable is subtracted from each score. These analyses are cross-sectional and do not establish causality. The goal is to illustrate a range of protective mechanisms rather than to determine the actual strength of these protective factors.
Table 3-2 demonstrates that protective processes can span multiple contexts. Model 1 shows that the classroom management climate is positively associated with school connectedness: In positive classroom management climates, students report feeling slightly more connected to school. Hence the individual-level protective factor is a function, in part, of the school environment. Moreover, for one outcome—weapon-related violence—the school-level classroom management climate and individual-level school connectedness have independent effects. For two of the outcomes, the school-level protective factor conditions the direct effect of the individual-level protective factor.
Models 2 through 4 in Table 3-2 demonstrate the second proposition, that the protective process differs across outcomes, or domains of functioning. The classroom management climate directly influences weapon-related violence, but has no effect on students’ decisions to initiate sexual intercourse or experiment with cocaine. The classroom management climate moderates the protective effect of school connectedness on weapon-related violence and sexual activity, such that school connectedness is a more potent protective factor when classroom management is high. In the case of sexual activity, classroom management moderates the protective effect of school connectedness, even though classroom management itself has no direct effect on the sexual activity.
TABLE 3-2 Protective Processes for Weapon-Related Violence, Ever Had Sexual Intercourse, and Ever Used Cocaine
|
|
OLS Coefficients Logistic Regression Coefficients |
|||
|
|
Model 1: School Connectedness |
Model 2: Weapon-Related Violence |
Model 3: Ever Had Intercourse |
Model 4: Ever Used Cocaine |
|
School connectedness |
|
–.33* (.03) |
–.34* (.03) |
–.48* (.06) |
|
Classroom management |
.12* (.04) |
–.42* (.16) |
.20 (.25) |
–.27 (.46) |
|
School connectedness × classroom management |
|
–.28* (.13) |
–.40** (.14) |
|
|
χ2 (d.f.) |
n.a. |
2617.09 (24) |
2329.00 (24) |
659.94 (24) |
|
N |
18,320 |
18,666 |
18,593 |
18,442 |
|
SOURCE: Data from the National Longitudinal Study of Adolescent Health, Wave 1, see Bearman et al., 1997. NOTES: Standard errors in parentheses. All standard errors adjusted for the complex sampling design. All models are unweighted and include the following variables: age, 2 years older than average age for grade, 2 years younger than average age for grade, gender, race/ethnicity, family income, family structure, urbanicity, ever suspended or expelled from school, individual-level classroom behavior (the individual score on the classroom management scale), school sector (public versus else), school size, percentage of two-parent families, percentage African American, and percentage African American squared. *p<.05. **p<.01. |
||||
The nature of the effect modification is illustrated in Table 3-3. The three columns present the effect of school connectedness on the health risk behaviors at the low, medium, and high levels of classroom management. The first row presents the odds ratios for violence. In the average school, the adjusted odds ratio associated with a one-unit increase in school connectedness is .72. (Because the variables are centered, this is simply the exponentiated coefficient for the main effect in Table 3-2, i.e., e–.33.) In
TABLE 3-3 Effect of School Connectedness on Health Risk Behaviors at Different Levels of Classroom Management Climate, Odds Ratios, and 95 Percent Confidence Intervals
|
|
Level of Classroom Management |
||
|
|
1 S.D. Below Mean |
Mean |
1 S.D. Above Mean |
|
Weapon-related violence |
.76 (.68, .84) |
.72 (.68, .78) |
.68 (.60, .76) |
|
Ever had intercourse |
.76 (.79, .81) |
.71 (.67, .75) |
.66 (.61, .71) |
|
Ever used cocaine |
.61 (.55, .68) |
.61 (.55, .68) |
.61 (.55, .68) |
|
SOURCE: Data from the National Longitudinal Study of Adolescent Health, Wave 1, see Bearman et al., 1997. NOTES: Odds ratios and confidence intervals are calculated from models in Table 3-2 and standard deviations (S.D.) presented in Table 3-1. For example, the odds ratios for weapon-related violence were calculated as follows: One S.D. below the mean: e(–.33+ [–.28*–.19]); one S.D. above the mean: e(–.33+[–.28*.19]). *p<.05. |
|||
schools with positive classroom management climates (climates that are one standard deviation above the mean), the odds ratio is .68. In schools with poorly managed classrooms, however, the protective power of school connectedness declines. A similar pattern is evident for sexual activity. Because there is no effect modification for cocaine use, school connectedness is equally protective against cocaine use at all levels of classroom management.
Health risk behaviors cluster together. Adolescents often become involved in several health risk behaviors, rather than just one or two. Consequently, research and prevention strategies should target several health risk behaviors, as does the Burt et al. paper in this volume. However, the results in Table 3-2 also illustrate that whereas some protective processes operate for all or most health risk behaviors (e.g., school connectedness), others are specific to certain outcomes. In this example, the classroom management climate directly reduces weapon-related violence but does not directly influence other outcomes. The specificity of protective processes has implications for research and interventions. Some protective factors may be particularly powerful in that they not only directly influence adolescents’ probability of engaging in risky behaviors, but they also make other protective factors more potent. These factors would be the ideal targets for inter-
TABLE 3-4 Protective Buffering Process for Weapon-Related Violence, Unweighted Logistic Regression Coefficients
|
|
Model 1 |
Model 2 |
|
|
School connectedness |
–.31*** (.04) |
–.31*** (.03) |
|
|
Classroom management climate |
–.35* (.16) |
–.47** (.16) |
|
|
School connectedness × classroom management |
–.26* (.13) |
–.34** (.13) |
|
|
GPA |
–.24*** (.03) |
|
|
|
GPA X school connectedness |
–.09* (.03) |
|
|
|
Learning disability |
|
.17*** (.06) |
|
|
Learning disability × school connectedness |
|
.00 (.07) |
|
|
χ2 (d.f.) |
2450.25 (25) |
1287.15 (25) |
|
|
N 18,225 |
16,325 |
|
|
|
SOURCE: Data from the National Longitudinal Study of Adolescent Health, Wave 1, see Bearman et al., 1997. NOTES: Standard errors in parentheses. All standard errors adjusted for the complex sampling design. Both models include full set of control variables. Odds ratios can be calculated as in Table 3-3. For example, the odds ratio for gpa among students with low school connectedness (one s.d. below the mean) is e.24+(.09*–.71). The odds ratio for gpa among students with high school connectedness (one s.d. above the mean) is e.24+(.09*.71). *p<.05. **p<.01. ***p<.001. |
|||
vention. Other protective factors might be key to enhancing particular developmental outcomes but not others.
Table 3-4 demonstrates the third general proposition, that protective processes vary across risk factors. For simplicity we focus on a single outcome, weapon-related violence. We compare the protective buffering mechanisms across the two risk factors: having a learning disability and receiving low grades in school. Model 1 presents the direct effect of GPA on weapon-related violence, holding the other variables constant at their means. A one-point decrease in GPA is associated with an increased risk of
participating in weapon-related violence of 27 percent (e.24–1). Model 2 shows that having a learning disability is associated with an increased risk of 18 percent (e.17 – 1).
The risk factor-school connectedness interaction terms test for the presence of a protective buffering process. School connectedness does not moderate the risk engendered by having a learning disability (Model 2). In contrast, school connectedness does moderate the risk associated with a low GPA, but not in the manner expected (Model 1). If risk buffering were present, the association between GPA and weapon-related violence would be weakest at high levels of school connectedness and strongest at low levels of school connectedness. Instead, the opposite is true. Among students with low school connectedness (one standard deviation below the mean), a one-point decline in GPA is associated with a 19-percent increase in the risk of participating in weapon-related violence. In contrast, among students with high school connectedness (one standard deviation above the mean), a one-point decline in GPA is associated with a 35-percent increase in the risk of weapon-related violence.
The implication of this finding is that strategies to reduce violence by improving or maintaining GPA will be more effective in schools where students feel connected to school than in schools where students feel disconnected, even if the intervention strategy achieves similar gains in GPA in both types of schools. In practice, of course, successful programs to improve academic achievement also address students’ connections to school. More broadly, the results in Table 3-4 illustrate that the risk environment must be taken into account when working to enhance protective processes. Likewise, the payoff to reducing risk will depend on the protective processes at play.
CONCLUSION
Over the past generation, our understanding of what predisposes young people to harm has shifted from viewing vulnerabilities as discrete, intrapsychic factors to seeing them as an interlocking set of factors that is heavily influenced by the contexts within which young people live. More recently we have come to understand the interrelationships between predisposing factors that create vulnerability and the countervailing forces that buffer, moderate, or alter the trajectory that otherwise leads to what Schorr (1997) refers to as “rotten outcomes.”
This paper presents a model of understanding adolescent vulnerability
processes across six interrelated domains—from the individual- to macrolevel factors—and then tests three possible ways that protective factors alter risky health behaviors such as violence, cocaine use, and sexual intercourse. What is evident is that the relationships are complex and that the ways in which protective factors work differ across contexts and across outcomes. For example, in our illustration we found that the classroom management climate is a key protective factor for weapon-related violence: It has a direct protective effect; it promotes school connectedness, another protective factor; and it enhances the protective effect of school connectedness. In contrast, the classroom management climate does little to protect against cocaine use or sexual intercourse.
Teasing apart these relationships is not merely an academic exercise. It is important for policy and intervention. Traditionally, policy and intervention efforts focused on eliminating the factors that put young people in harm’s way. More recently, with the understanding that it is essential to strengthen the protective factors in the lives of young people (in addition to reducing vulnerabilities), policies and programs have focused on building young people’s assets. The models and illustrative examples in this paper highlight the importance of going beyond a simple accounting of vulnerabilities and protective factors. For a policy or intervention to be optimally effective, it must take into account how vulnerability and protective processes are linked. In the final analysis, our goal must be not only the avoidance of risk, but the achievement of maximal potential for each adolescent.
REFERENCES
Bandura, A. (1979). Self-efficacy: Toward a unifying theory of behavioral change. Psychology Review, 84, 191-215.
Baumrind, R. (1989). Rearing competent children. In W. Damon (Ed.), Child development today and tomorrow: New direction in child development (pp. 349-378). San Francisco: Jossey-Bass.
Bearman, P. S., Jones, J., & Udry, J. R. (1997). The national longitudinal study of adolescent health: Research design. Available: <http://www.cpc.unc.edu/addhealth>. [August 8, 2001].
Benson, P. (1997). All kids are our kids. San Francisco: Jossey-Bass.
Berger, P., & Luckmann, T. (1966). The social construction of reality. New York: Doubleday.
Blum, R. W. (1998). Healthy youth development as a model for youth health promotion: A review. Journal of Adolescent Health, 22(5), 368-375.
Bronfenbrenner, U. (1986). Ecology of the family as a context for human development: Research perspectives. Developmental Psychology, 22(6), 723-742.
Brofenbrenner U. (1977). Toward an Experimental Ecology of Human Development. American Psychologist, 32, 513-531.
Erikson, E. (1950). Childhood and society. New York: W. W. Norton.
Garmezy, N. (1987). Stress, competence, and development: Continuities in the study of schizophrenic adults, children vulnerable to psychopathology, and the search for stress-resistant children. American Journal of Orthopsychiatry, 57, 159-174.
Garmezy, N. (1991). Resiliency and vulnerability to adverse developmental outcomes associated with poverty. American Behavioral Sciences, 34, 416-430.
Goffman, E. (1959). The presentation of self in everyday life. New York: Doubleday.
Grotberg, E. (1994). Promoting resilience in children: A new approach. Birmingham: University of Alabama, The Civitan Center.
Guo, G., & Harris, K. M. (1999). The mechanisms mediating the effects of poverty on children’s intellectual development. Demography, 37, 431-447.
Harter, S. (1987). The perceived competence scale for children. Child Development, 33, 87-97.
Jessor, R. (1991). Behavioral science: An emerging paradigm for social inquiry? In R. Jessor (Ed.), Perspectives on behavioral science: The Colorado lectures (pp. 309-316). Boulder, CO: Westview Press.
Jessor, R. (1992). Risk behavior in adolescence: A psychosocial framework for understanding and action. In D. E. Rogers and E. Ginzburg (Eds.), Adolescents at risk: Medical and social perspectives (pp. 19-34). Boulder, CO: Westview Press.
Jessor, R., Turbin, M. S., & Costa, F. (1998). Protective factors in adolescent health behavior. Journal of Personality & Social Psychology, 75(30), 788-800.
Luthar, S. S., Cicchetti, D., & Becker, B. (2000). The construct of resilience: A critical evaluation and guidelines for future work. Child Development, 71, 543-562.
Masten, A. S., Hubbard, J. J., Gest S. D., Tellegen, A. Garmezy, N., & Ramirez, M. (1999). Competence in the context of adversity: Pathways to resilience and maladaptation from childhood to late adolescence. Development and Psychopathology, 11(1), 143-169.
McNeely, C. S., Nonnemaker, J., & Blum, R. (2001). School connectedness: The untapped power of schools to diminish risk behaviors. Paper presented at the annual meeting of the American Sociological Association, Anaheim, CA, August 18-21.
Patterson, J., McCubbin, H., & Warwick, W. (1990). The impact of family functioning on health changes in children with cystic fibrosis. Social Science and Medicine, 31(2), 159-164.
Resnick, M., Bearman, P., Blum, R., Bauman, K. E., Harris, K. M., Jones, J., Tabor, J., Beuhring, T., Sieving, R. E., Shew, M., Ireland, M., Bearinger, L. H., & Udry, J. R. (1997). Protecting adolescents from harm: Findings from the National Longitudinal Study on Adolescent Health. Journal of the American Medical Association, 278(10), 823-832.
Rutter, M. (1993). Resilience: Some conceptual considerations. Journal of Adolescent Health 14, 626-631.
Sameroff, A., & Chandler, M. (1975). Reproductive risk and the continuum of caretaking causality. In F. Horowitz (Ed)., Review of child development (pp. 187-244). Chicago: University of Chicago Press.
Sameroff, A., Seifer, R., Barocas, R., Zax, M., & Greenspan, S. (1987). Intelligence quotient scores of 4-year-old children: Social-environmental risk factors. Pediatrics, 79, 343-350.
Sampson, R. J., Morenoff, J. D., & Earls, F. (1999). Beyond social capital: Spatial dynamics of collective efficacy for children. American Sociological Review, 64, 633-660.
Sampson, R. J., Raudenbush, S., & Earls, F. (1997). Neighborhoods and violent crime: A multilevel study of collective self-efficacy. Science, 277, 918-924.
Schorr, L. (1997). Common purpose: Strengthening families and neighborhoods to rebuild America. New York: Doubleday.
Werner, E., & Smith, R. (1982). Vulnerable but invincible. New York: McGraw-Hill.
Werner, E., & Smith, R. (1992). Overcoming the odds. New York: Cornell University Press.


