
SOURCES OF ESTUARINE SEDIMENTS AND THEIR COAGULATION
Ronald J.Gibbs
Center for Colloidal Science
College of Marine Studies
University of Delaware
The suspended load delivered by rivers constitutes the majority of sediments entering estuaries and the marine environment. These sediments are responsible for filling the channels, harbors, and waterways of our estuaries and coastal regions. The particles delivered by rivers also transport the majority of the toxic metals and organic compounds that are discharged into estuaries and the oceans. For these reasons, it is critical that we understand the processes related to the source, transport, coagulation, and deposition of these fine-grained particles in estuaries and coastal waterways.
The major complicating factor in our present understanding of these processes is that when fine-grained particles first encounter small amounts of seawater, they are attracted to each other to form aggregates or flocs. The coagulation of river sediments has been demonstrated in the laboratory by Whitehouse et al. (1960), and later by Krone (1962, 1972, 1978), Shiozawa (1970), Hahn and Stumm (1970), Edzwald (1972), Edzwald et al. (1974); by Eppler et al. (1983) for Delaware Bay; by Gibbs et al. (1985) for the Gironde estuary in France; by Gibbs and Konwar (1986) for the Amazon River plume; by Kranck (1975, 1979) in Canadian waters; and by Syvitski et al. (1985) for fjords. McCave (1984) presented a review of fine-grained marine sediments erosion, transport, and deposition.
It is the purpose of this paper to review the variety of sources pertaining to the concentration, composition, and size of particles delivered to estuaries by rivers, and then to elucidate the processes of what happens to these materials as they are transported, deposited, and resuspended in conjunction with the coagulation process as they first encounter seawater in estuaries.
SEDIMENT CONCENTRATION AND DISCHARGE
The concentration of suspended materials transported by rivers to estuaries varies widely in the world. This is well illustrated in Table 1, which shows the 20 largest rivers of the world, arranged by water discharge. It can be seen in the right-hand column that the concentration in milligrams per kilogram (the same as milligrams per
TABLE 1 The 20 Largest Rivers Worldwide Arranged in Order of Their Water Discharge
|
|
Drainage Area (103 km2) |
Discharge (103 m3/sec) |
Suspended Sediment |
||
|
Yield (kg/km2 yr×103) |
Concentration (mg/kg) |
||||
|
1. |
Amazon |
5,930 |
175 |
55.3 |
66 |
|
2. |
Congo |
4,000 |
40 |
14.5 |
51 |
|
3. |
Orinoco |
950 |
23 |
82.5 |
77 |
|
4. |
Yangtze |
1,030 |
22 |
444 |
700 |
|
5. |
Bramaputra |
560 |
20 |
1,179 |
1,070 |
|
6. |
Mississippi |
3,268 |
18.4 |
82.5 |
510 |
|
7. |
Yenisei |
2,480 |
17.5 |
3.8 |
190 |
|
8. |
Mekong |
390 |
15.0 |
395 |
365 |
|
9. |
Parana |
2,300 |
14.9 |
31.7 |
175 |
|
10. |
St. Lawrence |
1,300 |
14.2 |
2.5 |
8 |
|
11. |
Ganges |
1,060 |
14.2 |
1,270 |
3,400 |
|
12. |
Irrawaddy |
370 |
13.6 |
744 |
710 |
|
13. |
Ob |
2,440 |
12.5 |
5.4 |
37. |
|
14. |
Volga |
1,350 |
8.0 |
12.7 |
73 |
|
15. |
Columbia |
669 |
8.0 |
19.0 |
56 |
|
16. |
Pearl-West |
310 |
7.9 |
79.8 |
110 |
|
17. |
Mackenzie |
1,700 |
7.4 |
2.7 |
21 |
|
18. |
Indus |
1,050 |
6.8 |
408 |
2,200 |
|
19. |
Danube |
810 |
6.2 |
21.8 |
200 |
|
20. |
Niger |
1,100 |
6.1 |
3.8 |
25 |
liter) ranges from highs of 3,400 for the Ganges and 2,200 for the Indus, to low values of 8 for the St. Lawrence, 21 for the MacKenzie, and 25 for the Niger. Thus, the variation from the St. Lawrence to the Ganges is greater than a factor of 400 in the concentration of materials delivered. Likewise, the yield of suspended sediments (kilograms of suspended sediments per square kilometer) is shown to vary widely, ranging from over 1,200 for the Ganges to a low of 2.5 kg/km2 per year×103 for the St. Lawrence. Correspondingly, the annual amount of sediment discharge would be the water discharge multiplied by the sediment concentration, and it can be seen that these values would show even wider variations. These wide variations in sediment yield per square kilometer, or in the total amount exiting the river basin into an estuary, are a function of the mean elevation of the area and the amount and distribution of precipitation throughout the year received by that basin. Note that of the high-yielding, high-concentration rivers (the Yangtze, Bramaputra, Ganges, Irrawaddy, and Indus), all are Asian rivers. Table 2, which is a summary of the
TABLE 2 Summary of Measured Annual Sediment Yields of Selected Rivers to Oceans
|
Continent |
Measured Drainage Area (km2) |
Annual Suspended Sediment Discharge |
|
|
(106 kg) |
(103 kg/km2) |
||
|
North America |
6,380,976 |
547,908 |
86 |
|
South America |
9,890,938 |
552,872 |
56 |
|
Africa |
8,146,755 |
196,195 |
24 |
|
Australia |
1,073,425 |
42,956 |
40 |
|
Europe |
3,515,197 |
110,622 |
31 |
|
Asia |
10,907,016 |
5,819,303 |
534 |
|
Total |
39,913,307 |
7,269,856 |
182 |
|
SOURCE: Holeman (1968), after conversion to metric units. |
|||
rivers by continent, also shows that Asia has a very large drainage area of 10 million km2 and that its annual sediment yield is almost 106 kg which is, by far, greater than any other continent. In addition, its kg/km2 erosion is, by far, the highest by almost one order of magnitude: North America runs a very low second at 86 kg/km2, followed by South America, Australia, and Europe with 31 kg/km2, and Africa at only 24 kg/km2. Thus, quite a significant difference exists among continents.
If we observe the sediment yields and concentrations derived from some U.S. rivers and estuaries beyond the three or four rivers in Table 2, we can see from Table 3 that the distribution varies quite widely. Table 3 presents the 10 most important U.S. rivers based on large sediment discharge or drainage area. The St. Lawrence River actually carries about 75 percent of the water discharge of the Mississippi River at St. Louis. However, the St. Lawrence transports relatively little sediment because the Great Lakes act as natural sediment traps. Following the Mississippi River in volume of sediment transported are the Copper, Yukon, and Susitna rivers, all of which are in Alaska and drain high mountainous regions. The majority of U.S. rivers have been dammed up over the years, resulting in large sediment traps that are quite effective in reducing the sediment loads delivered to estuaries. Sediments that were once transported to estuaries are now probably filling the reservoirs behind the dams, rather than the channels of the estuaries.
The variability of suspended sediment discharges each year must be considered on two scales. First, within any one year most sediments will be delivered in a short time period. This is best illustrated by Figure 1, which shows that during 1 percent of a year (3.6 days), most rivers discharge better than one-half to two-thirds of their sediments
TABLE 3 Discharge of Suspended Sediment to the Coastal Zone by 10 Major Rivers of the United States, about 1980.
|
Rivers |
Average annual sediment discharge (million ton/yr) |
|
Rivers that discharge the largest sediment loads: |
|
|
Mississippia |
230 |
|
Copper |
80 |
|
Yukon |
65 |
|
Susitna |
25 |
|
Eel |
15 |
|
Brazos |
11 |
|
Columbia: |
|
|
Before Mount St. Helens eruption |
10 |
|
(After Mount St. Helens eruption—approximate) |
40 |
|
Rivers with large drainage areas: |
|
|
St. Lawrence |
1.5 |
|
Rio Grande |
.8 |
|
Colorado |
.1 |
|
NOTE: ton/yr=tons per year. aIncludes Atchafalaya River. SOURCE: Meade and Parker (1985). |
|
for that year. Further, looking at the data for 10 percent of the year (36 days), it can be seen that the vast majority of the sediments of all the rivers in Figure 1 are discharged within this 10 percent period. Conversely, 90 percent of the year represents a very small amount of the sediment-transporting ability of the three rivers, as shown in the top segments of each graph. This variability within one year means that a very high load of suspended material enters an estuary, coagulates, and sediments in a very short period of time; and that during the remaining 90 percent of the year, very low amounts enter. However, the resuspension and redistribution of the material from the shorter time period is continually occurring. Thus, the time scales within the year must be considered far more than most researchers have done in the past.
A larger time scale problem is also represented in Figure 1, as can be seen by the rare events that occur in the top figure for the Juniata River. In 1972, Hurricane Agnes produced an increased sediment load. The records of the suspended sediment discharge generated by the hurricane for the Juniata River showed that a ten day discharge was equal to three full years of average sediment transport. For the
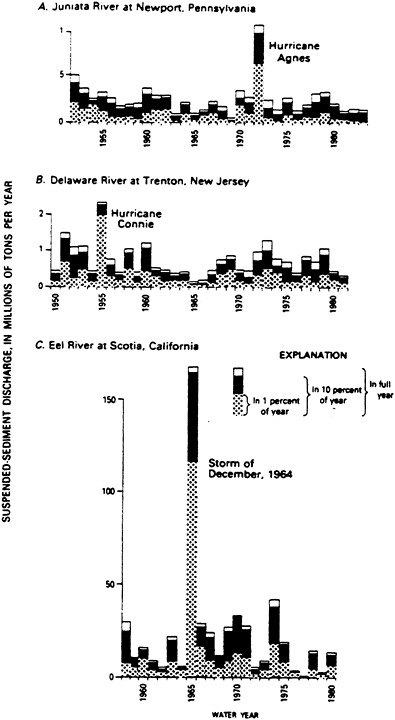
FIGURE 1 Annual suspended-sediment discharge of three rivers showing the frequencies of suspended-sediment discharges within individual years and the importance of infrequent heavy storms in producing large sediment loads. A. Juniata River at Newport, Pennsylvania. B. Delaware River at Trenton, New Jersey. C. Eel River at Scotia, California. SOURCE: Meade and Parker (1985).
Delaware River, a two day discharge represented three full years of average discharge. An even more spectacular single sediment discharge event is a storm that struck the Eel River in California. In a three day period, the Eel River carried more sediment past Scotia, California than it had during the previous seven years. In ten days, the transport was equivalent to the previous ten average years. To put this into perspective, the total suspended discharge for the Eel River was 168 million tons that year, which compares with the 184 million tons carried by the Mississippi River past St. Louis during the same year. This tremendous variability, occurring over a period of many years, is exceedingly difficult to sample and to understand because it is normally very expensive to prepare for sampling these types of rare events. However, sudden events are extremely significant in terms of quantity of sediments discharged and in the effects they have on estuaries.
Another interesting case comes from the work of Schubel (1974) on the Susquehanna River entering the Chesapeake Bay. Figure 2 shows the sediment concentration during the year 1972. It can be seen that, on the average, the concentration was about 10–20 mg/liter, with a few spikes for storm events during February, March, and into April. During June, Hurricane Agnes caused the sediment concentration to exceed 10,000 mg/liter and the discharge equaled 27,750 m3/sec. This discharge rate continued for a couple of days on a decreasing scale as the torrential rains subsided. Schubel estimated that during this one week period (June 22–28, 1972), the Susquehanna River probably discharged greater than 50×106 metric tons of suspended sediment than had been discharged during the past three decades, and probably even during the past half century. The majority of these sediments were probably deposited in the upper parts of the Chesapeake Bay, and then possibly redistributed by subsequent storms. Hence, it is again illustrated that rare events are significant in the transporting of sediments into estuaries, and could dominate deposition over many years and greatly affect the dredging and shoaling activities occurring in estuaries. Unfortunately, processes usually studied to understand sediment transport are not the rare events, but are of some average conditions over the year. For the Chesapeake Bay, this average would be when the river is discharging 10–30 mg/liter, which is not the period of significant deposition of material. This example should emphasize the need to observe more rare events; or as was shown in earlier figures, at least that 1–10 percent period of the year when high sediment loads occur, and especially when immense storms occur, to understand how materials transport, where they are deposited, and how quickly they are resuspended and redeposited.
COMPOSITION OF SUSPENDED MATERIAL
In addition to the variability of concentration and yield per year discussed in the previous section, the composition of the material varies greatly by river, particle size, and times of the year. To illustrate this variability, Figure 3 depicts the suspended sediment
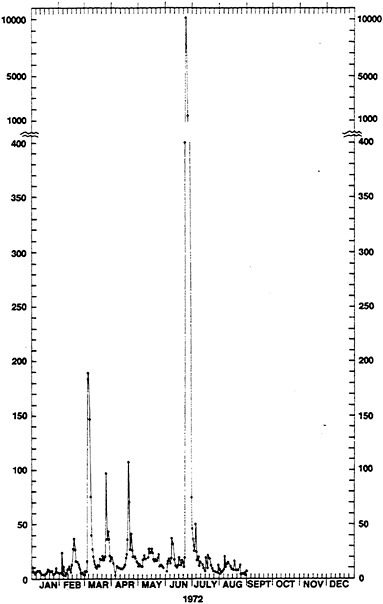
FIGURE 2 Concentration of total suspended solids (mg/liter) in the Susquehanna River at Conowingo, Maryland, during 1972. SOURCE: After Schubel (1974).
composition and particle size at the mouth of the Amazon River, and shows a mean size of about 4 µm with a logarithmic distribution about this mean (Gibbs, 1967). The smallest particle sizes (<1 µm) are dominated by the mineral montmorillonite, the intermediate size (roughly 1–3 µm) is represented by the minerals kaolinite and mica with an admixture of quartz, and the >4 µm size is dominated by quartz, mica, and feldspar. The sand-sized region (>62 µm) represents a small part of the total material that is actually transported.
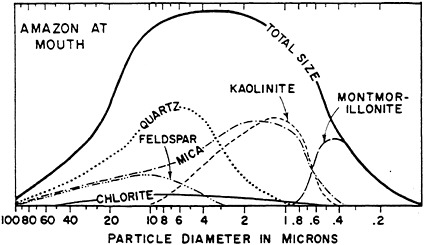
FIGURE 3 Weight frequency distribution of various minerals from the suspended material of the Amazon River. SOURCE: Gibbs (1967).
Another example is given by Figure 4, showing the particle composition distribution for suspended material near the mouth of the Mississippi River. Again, distribution is quite similar to the Amazon, with smectite (another name for montmorillonite) being the dominant mineral in the <.5 µm fraction. However, the abundance of illite and mica in the higher latitude portions of the Mississippi River is much greater than in the Amazon River; thus the minerals in the <4 µm fraction are dominated by mica, followed by kaolinite. Again, quartz becomes the dominant mineral after about 5 µm, with some other feldspars in the sand-sized fractions. Both distributions are similar, but the portions between kaolinite and illite are different for the two rivers. In the Mississippi River, illite is about three times the value of kaolinite, whereas in the Amazon River the two values are approximately similar in the 1–2 µm size fractions.
It can be seen from this example that the composition of material is greatly dependent on fraction size in the river system at any particular time, and that from river to river the overall trends remain the same: montmorillonite is prominent in the smaller sizes, intermediate sizes contain large amounts of illite and kaolinite, and in the >4 µm range quartz and feldspar become the dominant minerals. Thus, if the system contains a dam, lake, reservoir or any barrier that traps the coarser-grained material and eliminates the >10 µm material (which has a fairly high settling velocity in fresh water), half of the quartz would be eliminated in the case of the Amazon and Mississippi rivers. This is important to later discussions about coagulation rates of these minerals when they reach seawater, since minerals coagulate at slightly different rates and at different salinities. Actually, if a river contained <2 µm material (not uncommon in some very slow-moving rivers that have sediment traps in their upper regions), it would be dominated by illite, kaolinite, and montmorillonite, and would have very small amounts of quartz and chlorite.
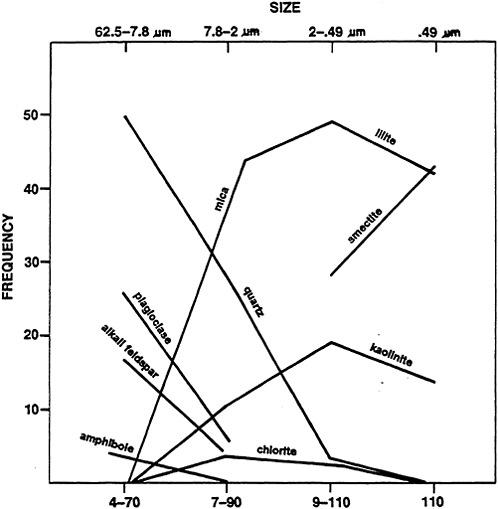
FIGURE 4 Size and mineralogic frequency of suspended solids in the mud fraction of the Mississippi River. SOURCE: After Johnson and Kelley (1984).
COAGULATION PROCESSES
As the particles discussed in the previous section encounter the first traces of seawater in an estuary, the double layer around each particle is compressed by ions in the seawater (especially by divalent ions), which destabilize these particles and create a condition conducive to coagulation. Once the particles are destabilized, the collision between two particles produces an aggregate of two, and the process continues until equilibrium is attained, with the aggregate consisting of hundreds of the original particles. A microphotograph of one aggregate from Delaware Bay in which the particles have just coagulated is shown in Figure 5. Note its high porosity, irregular outline, and very fragile nature.
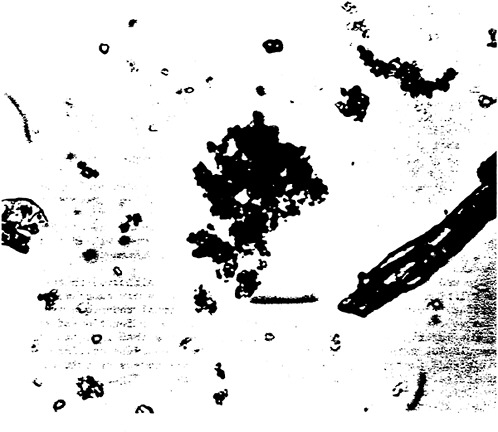
FIGURE 5 Photomicrograph of a typical floc from the turbidity maximum.
There are three processes in the coagulation of destabilized particles: (1) thermal agitation, (2) fluid shear, and (3) differential settling. The first coagulation process is thermal agitation (Brownian motion or molecular diffusion) in which the random motion of small particles is brought about by thermal effects. The driving force behind this transport is a function of the product of the Boltzmann constant and the absolute temperature. The kinetic energy of water molecules is transferred to small particles during the continuous bombardment of these particles by the surrounding water molecules. Transport by Brownian diffusion depends on the thermal effects only, and is independent of such factors as fluid flow, gravity forces, and salinity.
The second process affecting particle transport is fluid shear, either turbulent or laminar. Velocity differences or gradients occur
in all flowing waters. Hence, particles that follow the motion of the water travel at different velocities. These fluid and particle velocity gradients can produce interparticle contacts among particles suspended in the water. In these cases, particle transport depends on the mean velocity gradient (G), which for turbulent flow can be expressed as (E/V)1/2, where E is the total energy dissipated and V is the kinematic viscosity.
The third mechanism that causes coagulation is the differential settling of larger particles colliding with smaller particles as they settle in the water column. This mechanism is obviously a function of the size of the particles or flocs: the greater the difference in size, the faster the rate of coagulation. This is especially significant after large flocs (about 200 µm in size) have been generated in the turbidity maximum zone of an estuary.
All three coagulation processes always occur simultaneously, but since other conditions also exist, one process will dominate over the others. As an example, for the <.5 µm materials, the Brownian motion mechanism will dominate, whereas at a high concentration and large-size distribution, the differential settling mode will dominate, with the turbulent shear factor being the most significant at intermediate cases (Farley and Morel, 1968).
To understand the mechanisms and factors of significance in the coagulation of material in estuaries, simple laboratory experiments are helpful in elucidating the process. One fundamental technique is to observe the decrease in the number of particles as a function of time as the material coagulates. The slope of the line then indicates the coagulation rate, which is referred to as the alpha, the collision efficiency factor. Collision efficiency factors versus salinities for kaolinite, illite, and montmorillonite are shown in Figure 6. Kaolinite and illite coagulate at very low salinities, and Montmorillcnite continually increases its collision efficiency factor from low to high salinities.
The rate at which natural sediments coagulate upon entering an estuary differs from river to river. This can best be illustrated in Figure 7, which depicts the rates for the Amazon and Yukon rivers coagulating under similar conditions (Gibbs, 1983). It can be seen from the slopes that the coagulation rates vary for these three estuaries, because of differences in mineralogy and grain size and differing amounts of organic particles and coatings on the particles. The effect of organic coatings as well as salinity on the collision efficiency factor for one of these rivers (Delaware River) can best be seen in Figure 8. Coagulation begins at 1/2 ppt, increases rapidly until about 2–3 ppt, and then levels off until there are negligible differences beteeen 5 ppt and full seawater concentrations. Note also that the maximum effect of the coating occurs between 1 and 2–3 ppt and becomes negligible at higher salinities (above 10 ppt) (Gibbs, 1983).
One of the major difficulties in studying flocs in the field or laboratory is problems encountered when trying to measure the size and numbers of a floc population. Because of the very fragile nature of flocs, special techniques and equipment are needed. A series of papers
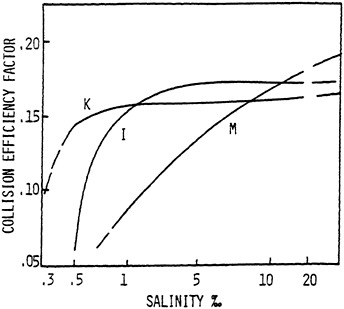
FIGURE 6 Relationship of the collision efficiency factor (ξ) and salinity for illite, kaolinite, and montmarillonite. SOURCE: Gibbs (1982a).
by Gibbs (1981, 1982a,b) and Gibbs and Konwar (1982, 1983) demonstrate that using pipettes, pumps, and Niskin bottles (using normal ports when sampling) breaks up flocs. In addition, Coulter counters and HAIC light-blocking systems are inaccurate for size analysis. In the studies discussed in this paper, great care was taken to avoid these problems. As an example, we are currently utilizing an in situ holographic system, a real-time in situ television system with special optics for magnifying and lighting, and an in situ Xenon flash camera (excellent for freeze motion photography) to measure size and number of flocs.
Several examples best illustrate the coagulation process. The overall Delaware Bay coagulation process is depicted in Figure 9, which shows particle size as very small in the river (<10 µm), increasing to about 150 µm at salinities of less than 1 ppt, then decreasing farther down the estuary. The turbidity maximum does not actually occur at the site of the largest flocs, but is oceanward of the maximum floc sizes. It should be noted that the Delaware Bay system has a very low tidal range of roughly 1 m in maximum tide and that its turbidity maximum just barely reaches 100 mg/liter.
The Gironde River estuary on the west coast of France has a very high tidal range of about 6 m. Figure 10 illustrates the change in floc size from the river where it is very small with very low concentrations to the very large flocs of about 200 µm at mid-estuary with very high concentrations (several thousand mg/liter). The largest flocs actually occur landward of the turbidity maximum, which also occurs in the Delaware River estuary. However, for the

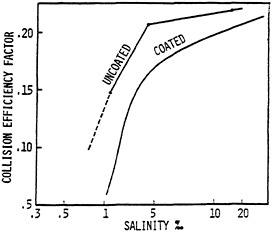
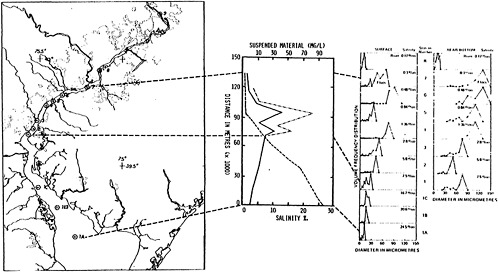
FIGURE 9 Composite diagram showing location map (on left); the center diagram shows the salinity (dashed line), surface suspended material concentration (solid line) and the near-bottom suspended material (dot and dash line) and the diagrams on the right show the floc size distribution for the surface and near-bottom samples. SOURCE: Gibbs et al. (1983).
Gironde estuary, the concentrations are much higher and the turbidity maximum reaches thousands of mg/liter. The two estuaries are quite similar: both have very low concentrations entering from their river sources, and one has a low tidal range and low turbidity maximum concentration, while the other has a high tidal range and a correspondingly high turbidity maximum value. Both attain approximately the same maximum size flocs of 150–200 µm. Floc circulation is best illustrated in Figure 11, which shows the very small particles on the left-hand side moving along with the river current. They start coagulating at about 1/2 ppt where the bottom waters contain a high concentration of large flocs. Then at about the null point (about 1 ppt in this case), the flocs concentrate at the bottom, which is also the region of the turbidity maximum. Any flocs moving beyond the surface layers and settling down are brought back by the landward-flowing lower layer, so the larger flocs are concentrated further in this region.
A study was conducted of the floc size and concentration of the sediments discharged by the Amazon River into its estuary (Gibbs and Konwar, 1986). However, its estuary is the open Atlantic shelf area and is therefore an estuary lacking borders. It can be seen in Figure 12 that the mean particle diameter reaches a maximum size of about 100+ µm approximately 100 km offshore and that the 99th percentile particle reaches roughly 200 µm at about the same position. The turbidity maximum extends from about 60 km to 90 km offshore, with a secondary maximum at the shelf break farther out. Thus, it can be seen that a system with a discharge far out into the oceans contains about the same floc size (roughly 150–200 µm) as do estuaries of the more standard type, such as the Delaware and Gironde.
To further explain the mechanisms that occur in estuaries, Table 4 compares different types of estuaries. To understand the role of tidal dynamics of estuaries, river concentrations, and mechanisms responsible for causing the high turbidity maximums, we will first look at the Delaware and Gironde rivers. Both have approximately equally low influx concentrations of about 10 mg/liter. The Delaware River has a tidal range just under 1 m, whereas the Gironde estuary has a tidal range of about 6 m. These two estuaries have about the same geometry, so this is not a significant factor. The corresponding concentrations for turbidity maximums are shown in the next column in which the Delaware River estuary has a concentration of barely 100 mg/liter at its maximum, whereas the Gironde estuary has concentrations of 3,000–4,000 and even 5,000 mg/liter, depending on the depth of the sampling. Thus, where concentrations of the inputting rivers are equal, it is the tidal dynamics that appear to be responsible for high concentrations in the turbidity maximum. The floc sizes in both estuarine systems are approximately the same (150–200 µm in diameter) for the 99th percentile flocs. Since the size maxima in both systems are approximately equal, the size of the flocs does not seem to appreciably affect the turbidity maximum concentration.
To further elucidate the effect of tides and river input concentrations on this mechanism, we will now look at two rivers having high
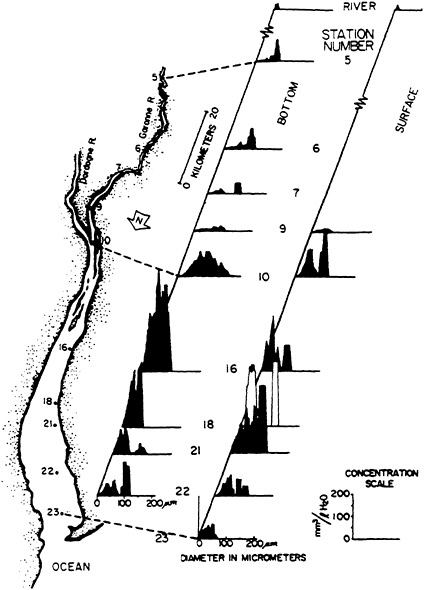
FIGURE 10 Location map of Gironde estuary showing station locations, and the size distributions for surface and bottom samples at these locations. SOURCE: Gibbs et al. (1985).
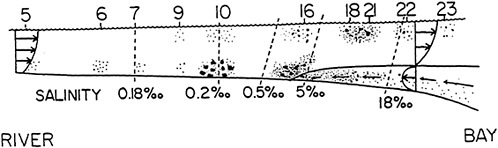
FIGURE 11 Cross-section of estuary showing floc size and concentration, along with salinities and currents. SOURCE: Gibbs et al. (1985).
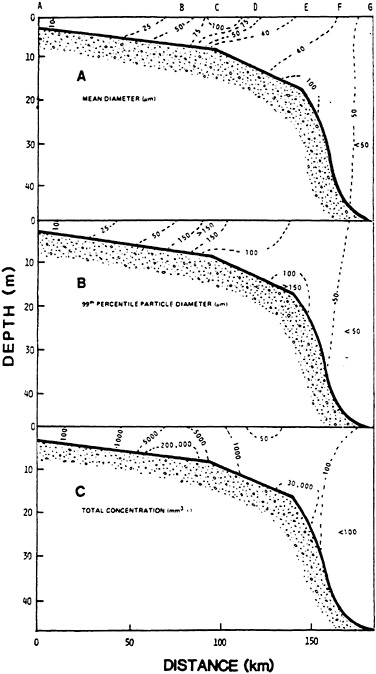
TABLE 4 Suspended Material Concentration (mg/liter), Tidal Range (m), Turbidity Maximum Concentration (mg/liter), and Maximum Floc Size (µm) for Various River/Ocean Systems
|
River Types |
Suspended Material Concentration (mg/liter) |
Tidal Range (m) |
Turbidity Maximum Concentration (mg/liter) |
Maximum Floc Size (µm) |
|
Low Concentration: |
|
|||
|
Delaware River |
≈10 |
<1 |
≈100 |
150 |
|
Gironde River |
≈10 |
6 |
3,000 |
190 |
|
High Concentration: |
|
|||
|
Amazon River |
66 |
10 |
2,000 |
180 |
|
Mississippi River |
180 |
1 |
1,000 |
150 |
concentrations, the Amazon and Mississippi rivers. The Amazon River has a high tidal range (![]() 10 m at its mouth), and the Mississippi has a very low tidal range (
10 m at its mouth), and the Mississippi has a very low tidal range (![]() 1 m). The concentrations in the turbidity maximums of these rivers are both over 1,000 mg/liter, indicating that the river concentration will dominate when it is at very high values, regardless of the tidal range. In this case, the tidal ranges are from 1–10 m, yet both rivers have turbidity maximums in the thousands. The tidal range effect seems to be overwhelmed when a very high concentration discharge enters the river system. Again, the floc sizes are approximately equal for the Amazon and Mississippi rivers (150–180 µm for the maximum flocs), with means of approximately the same values.
1 m). The concentrations in the turbidity maximums of these rivers are both over 1,000 mg/liter, indicating that the river concentration will dominate when it is at very high values, regardless of the tidal range. In this case, the tidal ranges are from 1–10 m, yet both rivers have turbidity maximums in the thousands. The tidal range effect seems to be overwhelmed when a very high concentration discharge enters the river system. Again, the floc sizes are approximately equal for the Amazon and Mississippi rivers (150–180 µm for the maximum flocs), with means of approximately the same values.
Another interesting topic for research is the effect of turbulence on the flocs themselves. Turbulence is required for most flocculation processes: laboratory experiments indicate that higher turbulence promotes faster flocculation and larger flocs, although this varies from sediment to sediment (Gibbs, 1983). Usually, turbulent forces within the environment are adequate for promoting flocculation and primarily affect the rate of floc formation. What is poorly understood and of interest is whether environmental turbulence breaks up flocs once they are formed, and whether it controls floc transport. Laboratory experiments to test these concepts have been done on natural flocs, beginning with very low turbulence and then progressively increasing it to determine the force required to break up the flocs (Gibbs and Konwar, 1986). It was determined that turbulence within the natural environment does not appear to be sufficient enough to break up the flocs except under conditions such as breaking waves on a beach, high tidal flow, over-bar flow, and other strenuous conditions. It is evident that the flocs are formed in the upper of the estuary, where the salinity increases; from that point on, turbulence appears
important only to transport for retarding of the settling flocs, but not to actual breaking and reforming of flocs after their original formation. The degree of floc breakage during dredging, transportation, and disposal has yet to be determined. Depending on engineering and environmental considerations, floc breakage can be beneficial at times because it would decrease the settling velocity and permit the current to transport the material farther distances. On the other hand, if one was attempting to retain contaminated sediments, it would be important to avoid floc breakage.
CONCLUSIONS
The sources of the material delivered by rivers into estuaries varies greatly among continents, among rivers within a continent, and even within a particular river from year to year. Rare events or exceptional storms, such as hurricanes, also produce dramatic changes in the amounts and types of materials that are delivered. These variabilities of time and geography have not been studied adequately to understand their impacts on the flow of materials and sedimentation of estuaries.
The composition of materials is shown to be fairly uniform from river to river, but as size distributions shift, so does composition of the material. Thus, if one river carries coarse-grained material and another fine-grained material, they will have widely differing compositions. This difference could then impact what happens to the material when it coagulates, as well as how it coagulates in the estuaries.
Once the river-delivered material is in the estuary and exposed to even slight amounts of salt, it tends to coagulate, which in turn controls the settling velocity and subsequently transport, resuspension, and deposition. To date, few field studies have been conducted on coagulated floc size and settling velocity, and far more extensive studies of this nature need to be undertaken. The primary difficulty with field research is the fragile nature of flocs, especially when subjected to sampling and analytical techniques. However, additional research is needed on floc size distribution, settling velocity, and resuspension of coagulated material in estuaries if we are to adequately understand the mechanisms of transport, deposition, and resuspension. The effect of turbulence on coagulation rate and floc breakage in suspension needs additional laboratory and field studies.
REFERENCES
Edzwald, J.K. 1972. Coagulation in estuaries. Publ. UNC-SG-72–06. Chapel Hill, N.C.: University of North Carolina Sea Grant Program.
Edzwald, J.K., J.B.Upchurch, and C.R.O’Melia. 1974. Coagulation in estuaries. Environ. Sci. Tech. 8:58–63.
Eppler, B., Neis and H.H.Hahn. 1975. Engineering aspects of the coagulation of colloidal particles in natural water. Progr. Water Tech. 7:207–216.
Farley, K.J. and F.M.Morel. 1986. Role of coagulation in the kinetics of sedimentation. Environ. Sci. Tech. 20:187–195.
Gibbs, R.J. 1967. Geochemistry of the Amazon Rivery system: Part 1. The factors that control the salinity and the composition and concentration of the suspended solids. Geol. Soc. Am. Bull. 78:1203–1232.
Gibbs, R.J. 1981. Floc breakage by pumps. J. Sed. Petrol. 51:30–31.
Gibbs, R.J. 1982a. Floc stability during Coulter counter size analysis. J. Sed. Petrol. 52:657–660.
Gibbs, R.J. 1982b. Floc breakage during HIAC light-blocking size analysis. Environ. Sci. Tech. 16:298–299.
Gibbs, R.J. 1983. Coagulation rates of clay minerals and natural sediments. J. Sed. Petrol. 53:1193–1203.
Gibbs, R.J. and L.Konwar. 1982. Effect of pipetting on mineral flocs. Environ. Sci. Tech. 16:119.
Gibbs, R.J. and L.Konwar. 1983. Disruption of mineral flocs using Niskin bottles. Environ. Sci. Tech. 17:374–375.
Gibbs, R.J. and L.Konwar. 1986. Coagulation and settling of Amazon River suspended sediment. Coastal Mar. Res. (in press).
Gibbs, R.J., L.Konwar, and A.Terchunian. 1983. Size of flocs suspended in Delaware Bay. Can. J. Fish. Aquat. Sci. 40:102–104.
Gibbs, R.J., D.M.Tshudy, and L.Konwar. 1985. Suspended sediment transport of the Gironde Estuary, France (Abstract). Geol. Soc. Am. Bull. 17(1):20.
Hahn, H.H. and W.W.Stumm. 1970. The role of coagulation in natural waters. Am. J. Sci. 268:354–358.
Holeman, J.N. 1968. The sediment yield of the major rivers of the world. Water Resour. Res. 4(4):737–747.
Hunt, J.R. 1980. Coagulation in continuous particle size distributions: Theory and experimental verification. Ph.D. Dissertation, California Institute of Technology, Pasadena, Calif, p. 171.
Johnson, A.G. and J.T.Kelley. 1984. Temporal, spatial, and textural variation in the mineralogy of Mississippi River suspended sediment. J. Sed. Petrol. 54:67–72.
Kranck, K. 1975. Sediment deposition from flocculated suspensions. Sedimentology 22:111–123.
Kranck, K. 1979. Dynamics and distribution of suspended particulate matter in the St. Lawrence estuary. Naturaliste Can. 106:163–173.
Krone, R.B. 1962. Flume studies of the transport of sediment in estuarial shoaling processes. Final Report to San Francisco District. Washington, D.C.: U.S. Army Corps of Engineers.
Krone, R.B. 1972. A field study of flocculation as a factor in estuarial shoaling processes. Tech. Bull. 19 prepared for Committee on Hydraulics. Washington, D.C.: U.S. Army Corps of Engineers. 62 p.
Krone, R.B. 1978. Aggregation of suspended particles in estuaries. Pp. 177–190 in Estuarine Transport, Processes, B.Kjerfve, ed. Columbia, S.C.: University of South Carolina Press.
McCave, I.N. 1984. Erosion, transport and deposition of fine-grained marine sediments. Pp. 35–69 in Fine-Grained Sediments: Deep Water Processes and Facies, D.A.V.Stow and D.J.W.Piper, eds. Oxford, U.K.: Blackwell Scientific Publishers.
Meade, R.H. and R.S.Parker. 1985. Sediment in rivers of the United States. Nat. Water Summary 1984: U.S. Geological Survey Water-Supply Paper 2275:49–60.
Schubel, J.R. 1974. Effects of storm Agnes on Chesapeake Bay. Pp. 113–132 in Suspended Solids in Water, R.J.Gibbs, ed. New York: Plenum Press.
Shiozwa, T. 1970. Experimental study on differential flocculation of clay minerals: An application of its results to recent sediments in Ishikari Bay. Japan. Assoc. Mineral. Econ. Geol. J. 63:84–85.
Syvitski, J.P.M., K.W.Asprey, D.A.Clattenburg, and G.D.Hodge. 1985. The pro-delta environment of a fjord: Suspended particle dynamics. Sedimentology 32:83–107.
Whitehouse, V.G., L.M.Jeffrey, and J.O.Debrecht. 1960. Differential settling tendencies of clay minerals in saline waters. Clays and Clay Minerals 8:2–79.
COHESIVE SEDIMENT TRANSPORT PROCESSES
A.J.Mehta
Coastal and Oceanographic Engineering Department
University of Florida, Gainesville
E.J.Hayter
Department of Civil Engineering
Clemson University
W.R.Parker
Blackdown Consultants
United Kingdom
A.M.Tester
Hydraulics Laboratory
Waterways Experiment Station
Quantitative description of fine, cohesive sediment transport is required in hydraulic engineering applications including the estimation of erosion and sedimentation in estuarial navigation channels, waterways, harbors, docks and marinas. In addition, there is a need to evaluate the strength of turbidity currents and associated rates of sediment transport over the estuarial shelf and along coasts underlain by mud banks. The high adsorptive affinity of fine suspended matter for chemical constituents in water causes fine material to act as a carrier for pollutants with consequent implications for related water quality problems.
Much of the present day knowledge concerning the underlying basic transport processes of settling and deposition, consolidation, erosion and transport in suspension is derived from research conducted mainly during the past three decades. The inter-relationship among these processes may be illustrated by the tide-dominated cyclic behavior characteristic of estuaries, as shown schematically in Figure 1 (Parker and Kirby, 1977; Mehta et al., 1982). A sediment-fluid mixture can be considered to exist in four states:
-
a mobile suspension, i.e., suspension in horizontal transport;
-
a stationary or static high density suspension which may possess a vertical velocity component;
-
a consolidating (soft) deposit; or
-
a settled (firm), consolidated bed.
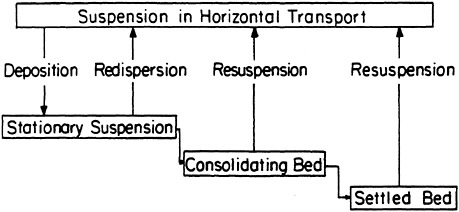
FIGURE 1 Physical states and processes governing estuarial cohesive sediment transport. SOURCE: Mehta et al. (1982).
A stationary suspension with practically no mechanical strength results from settling of cohesive aggregates in transport, particularly at times close to slack water. Under suitable conditions a bed deposit with a skeletal soil framework possessing a small but measurable shear strength begins to develop. Gelling and consolidation of this deposit and associated physico-chemical changes eventually result in a settled bed with a lower water content, a higher shear strength, and a more stable structural configuration
Sediment entrainment of stationary suspension, which typically could occur shortly after current reversal following slack water, has been referred to as redispersion or reentrainment (Parker and Kirby, 1977). Entrainment from a consolidating or a settled bed may generally be referred to as erosion or resuspension.
In this paper, basic process-related aspects are briefly reviewed, with emphasis on process description associated with Figure 1, and process characterization relevant to hydraulic engineering practice. At the outset, reference is made to parameters which characterize the sediment and the fluid. Basic processes are elaborated upon next. Definitions and measuring techniques for the bottom boundary or bed, important both to modelers of sediment transport as well as to ship navigation, are then considered. The paper concludes with brief considerations on data requirement in field application for estimation of erosion/sedimentation, with reference to available information and gaps in present knowledge.
SEDIMENT CHARACTERIZATION
When sufficient salt is added to a suspension of dispersed clay particles, the suspended particles become cohesive. Flocs or aggregates with orders-of-magnitude larger settling velocities are formed when cohesive particles are made to collide repeatedly. The transformation of dispersed particles into cohesive ones is due to ions in
solution, which suppress interparticle electrochemical repulsive forces, thereby allowing the attractive London-van der Walls forces to dominate. All suspended clay particles become cohesive when the salinity exceeds 2–3 ppt, although further increase in salinity, up to about 10 ppt in most cases, increases interparticle cohesion and can influence aggregate structure. In this paper, transport description for flocculated as opposed to dispersed fine sediment is considered, since dispersed material hardly settles, or if settled, is re-entrained by even minute levels of agitation. Sedimentation problems in estuaries and in near waters are typically associated with predominantly flocculated materials.
Sediment of size greater than 60 µm is considered to be coarse, and less than this size to be fine-grained. There appears to be some confusion in sediment transport-related literature between this mode of classification, and one that considers sediment as either cohesionless or cohesive. The boundary between cohesive and cohesionless sediment is, unfortunately, not clearly defined and generally varies with the type of material. It is, however, appropriate to state that the dominance of interparticle cohesion over gravitational force increases with decreasing particle size. Thus the effect of cohesion on the behavior of clays (particle size <2 µm) is much more pronounced than on silts (2 to 60 µm), and, in fact, cohesion in natural muds is primarily due to the presence of clay-sized sediment. Silt-sized material, particularly larger than ~20 µm, is weakly cohesive, but when combined with a sizeable weight fraction of clay sediment, constitutes a sediment which, in the flocculated state, exhibits a behavior characteristic of cohesive sediment.
Muds are typically composed of a wide range of materials such that it is difficult to provide a unique definition of mud composition. In general, muds include clay and non-clay minerals in the clay- and silt-size ranges, organic matter and, sometimes, small quantities of very fine sand. When large amounts of coarse detritus including sand, gravel, and shell occurs with mud, the interactive behavior between different-sized sediments becomes quite complex and is not presently well understood. The present practice therefore is to treat the coarse material separately from mud.
The problem of property characterization for cohesive sediment is more complex than that for coarse grained material, because aggregate properties depend upon the type of sediment, type and concentration of ions in the fluid, and on the flow condition itself. Furthermore, cohesion is influenced by colloidal organic matter, microbes, polysaccharides, etc. (Montague, 1986).
For characterizing the sediment, it is recommended that the following properties be specified through laboratory measurement: (1) grain size distribution of dispersed, non-dried sediment using, for example, the standard hydrometer test; (2) the relationship between the median (by weight) settling velocity and the suspension concentration of the flocculated sediment in native water (Owen, 1976); (3) clay and non-clay mineralogical composition through x-ray diffraction analysis (Grim, 1968); (4) total organic matter; and (5) the cation exchange capacity, CEC, which is a measure of the degree of clay cohesion (Grim,
1968). With reference to CEC (milliequivalents per 100 g) of the three major clay minerals, kaolinite is the least cohesive (CEC=3–15) and montmorillonite (smectite) the most cohesive (80–150), with illite between these two (10–40).
For characterizing the fluid, it is recommended that the following quantities be specified: (1) concentration of important cations (e.g., Na+, Ca++, Mg++) and anions (e.g., Cl−, ![]() ); (2) total salt concentration; (3) pH; and (4) fluid temperature during field as well as laboratory experiments. Quantities in items 1, 2, and 3 can be determined through standard chemical analyses.
); (2) total salt concentration; (3) pH; and (4) fluid temperature during field as well as laboratory experiments. Quantities in items 1, 2, and 3 can be determined through standard chemical analyses.
Two additional properties must be mentioned. These are bed density and rheological parameters. Inasmuch as consolidation increases bed density, it is important to obtain representative, undisturbed cores for determining the depth distribution of the density of the bed, which is always site specific. This information enables a conversion between deposited or eroded sediment mass per unit time and the corresponding changes in the suspension concentration (mass per unit volume). In addition, as noted later, density gives an approximate indication of the shear strength of the bed with respect to erosion.
In studies in which dissipation of fluid energy within the bed plays an important role, e.g., wave-mud interaction, it is essential to evaluate the rheological properties, the most important one being the viscosity, which has been found to be related to sediment density in an approximate manner (Krone, 1963; Miznot, 1968). Viscometer data indicate that muds typically exhibit a non-Newtonian rheology. Thus, it becomes necessary to specify parameters in addition to viscosity. Most commonly this includes the Bingham yield stress, for a comparatively simplified rheological description. The dynamic behavior of muds under wave-induced loading suggest a visco-elastic response, which is characterized by the viscosity and shear modulus of elasticity (Mehta and Maa, 1986).
SETTLING AND DEPOSITION
Settling characteristics of cohesive sediment affect the rates of deposition and vertical distribution of suspended material. The rate of deposition per unit bed area D, or flux of material to the bed per unit time, is calculated as the sum over a number of classes of settling flux:
(1)
where Wsi is the settling velocity of settling class i, pi is the probability of deposition, i.e., the probability that a particle of class i reaching the bed will remain there, and Cbi in the concentration of class i near the bed. Evaluation of D requires information of Wsi, pi, and Cbi. Knowledge of settling rates is also required for modeling vertical variations of suspended material in analytical or
numerical models. The purpose here is to provide information on how settling velocities, depositional probabilities, and near-bed concentrations can be estimated or measured.
Settling in Suspensions
Settling is that component of particle motion caused by the balance between gravitational forces and viscous drag on the particles. Settling velocity is therefore defined as the settling rate in quiescent fluid. Cohesive sediments in natural flows have four components to their motion: Brownian motion, gravitational settling, the motion of the suspending fluid, and rebounds from interparticle collision. Brownian motion produces no net flow but can be important to flocculation or aggregation and diffusion, especially for clay aggregates at relatively high suspension concentrations. Cohesive sediments also move with a velocity component equal to that of the surrounding fluid. This applies to both mean flows and turbulent fluctuations in homogeneous fluids. These materials are transported at approximately the same eddy transport rate as momentum (Jobson and Sayre, 1970).
Aggregation proceeds by collision brought on by Brownian motion, differential settling, and current shear. Current shear, expressed in terms of the rate of fluid shear in units of inverse time, is typically the most important factor contributing to aggregation of natural particles in turbulent waters. In the following, the settling velocity is treated on a time-invariant macroscopic level, but it should be understood that time-dependent aggregation processes affect the settling velocity. Settling velocities of cohesive materials are properties of a suspension, not unique properties of the sediment.
Settling Velocity
Methods of Analysis
Several direct and indirect methods have been used to measure settling velocity. Direct methods include visual or photographic observation. Indirect methods include sedimentation balances and settling tubes. Preventing the formation of a high-density suspension upon entering the area below the balance pan is a commonly encountered problem with the sedimentation balances approach. Accumulation or pipette analyses have been used to reduce settling tube data, which are obtained under quiescent conditions wherein aggregation is typically well advanced, and the rates of ongoing aggregation extremely low. The accumulation method, usually credited to Odén (Federal Inter-Agency River Basin Committee, 1953), estimates settling velocity from the removal rate of material from suspension. Owen (1976) gives details of laboratory procedures using a bottom-withdrawal accumulation method.
The pipette method estimates settling velocity from the change in concentration at a point in a quiescent suspension with time.
Whitehouse et al. (1960) give a procedure for laboratory determination of settling velocity using this method. Multidepth pipette analyses have also been used to investigate flocculation effects by McLaughlin (1959).
Settling velocities under continued aggregation can be estimated from flume tests. By observing the removal of material from suspension with time by deposition, and using the relationship:
(2)
where h is the depth of the vertically mixed suspension, C is the depth-mean concentration, and p is the probability of deposition, the effective settling velocity pWs can be estimated. Samples should be taken in the vertical to check the assumption implicit in Eq. 2 that the suspension has uniform concentration. If the suspension is far from being uniform, Eq. 1 can be used to interpret the data.
To determine Ws from the effective settling velocity, p must be estimated. The functional form of p depends on the time-mean value of the bed shear stress, τb, and a critical shear stress for deposition τcd which depends on the sediment-fluid composition. Krone (1962) found that
(3)
The critical shear stress for deposition is thus the bed shear stress above which no deposition occurs.
Influential Factors
Any physical or chemical factor which influences aggregate size, density, and shear strength affects the settling velocity. Marine and estuarial sediments thus exhibit a wide range of settling velocities. Reported values range from 10−4 to 100 mm/sec (Whitehouse and Jeffrey, 1952; Krone, 1962; Miznot, 1968; Owen, 1970, 1971; Chase, 1979; Burt, 1986; Teeter, 1986).
An indication of the degree of enhancement of the settling velocity due to flocculation is obtained from the illustrative results of Table 1, which are derived from the studies of Miznot (1968) and Chase (1979) in settling tubes. For primary (dispersed) particle diameters of 20, 2, and 0.2 µm, the corresponding Stokes velocity given in the last column ranges from 1.1 at a primary particle diameter of 20 µm to 4.6×10³ at 0.2 µm. Furthermore, it is noteworthy that, while the Stokes velocity decreases rapidly with particle size, the aggregate settling velocity as well as diameter retain the same orders of magnitude, as a consequence of increasing aggregation with decreasing particle size.
TABLE 1 Primary Particle and Aggregate Diameters and Settling Velocities
|
Primary particle diameter (µm) |
Stokes settling velocity (mm/sec) |
Aggregate settling velocity (mm/sec) |
Aggregate diameter (µm) |
Aggregate velocity divided by Stokes velocity |
|
2×101 |
2.4×10⁻¹ |
2.7×10⁻¹ |
8.8×101 |
1.1×100 |
|
2×100 |
2.4×10⁻³ |
1.7×10⁻¹ |
5.6×101 |
7.1×101 |
|
2×10⁻¹ |
2.4×10⁻⁵ |
1.1×10⁻¹ |
3.4×101 |
4.6×10³ |
For a given sediment, the effects of suspension concentration, salinity, and the flow field on aggregate settling velocity are found to be the most important ones deserving consideration. In general, the settling velocity increases with concentration up to about 5,000 to 10,000 mg/liter, above which it begins to decrease with increasing concentration as a consequence of hindered settling. This type of settling occurs when the sediment forms a nearly continuous network through which it begins to decrease with increasing concentration as a consequence of hindered settling. This type of settling occurs when the sediment forms a nearly continuous network through which pore water must escape slowly upwards for settling to continue. A high density suspension characterized by hindered settling is commonly referred to as fluid mud (Krone, 1962).
The effect of salinity is typically important up to about 10 ppt salinity (Krone, 1962). In this range of salinity, the settling velocity typically increases with salinity. At higher salinities, the effect is found to be important mainly for predominantly montmorillonitic materials (Whitehouse et al., 1960).
Krone (1962) measured the settling velocity of mud from the San Francisco Bay in both a quiescent tube and in a recirculating flume. Settling velocities estimated from flume tests (0.007 mm/sec) were only about 20 percent as great as those obtained from quiescent settling tests. On the other hand, Owen (1971) reported results from field settling tests in the Thames River estuary, England, using a specially designed settling tube sampler which could be used to collect the suspension in situ and measure the settling velocity soon thereafter. This method resulted in settling velocities which were a factor of 10 higher for the same sediment tested in a laboratory settling tube. This difference is clearly due to increased aggregation under estuarial turbulent flows as compared to quiescent conditions in the laboratory, and it emphasizes the need to obtain in situ settling velocity data as far as possible.
Probability of Deposition
According to Eq. 3, the probability of deposition p is 1 when the bed shear stress τb=0, i.e., there is no flow, and 0 when τb=τcd. The critical shear stress for deposition τcd is principally characterized by the type of sediment-fluid mixture, and can be determined from flume tests in which sediment, initially suspended at a high flow velocity, is allowed to deposit at a lower velocity. If this lower velocity corresponds to a τb which exceeds τcd, no deposition will occur provided the sediment has uniform properties. By allowing the sediment to deposit in two or more tests at different values of τb (< τcd) and applying Eqs. 2 and 3, τcd (and Ws) can be evaluated. For the San Francisco Bay sediment, Krone (1962) found τcd=0.06 N/m2 when the initial suspension concentration Co was less than ~300 mg/liter. At higher values of Co (ranging from 300–10,000 mg/liter), τcd= 0.078 N/m2 was obtained, indicating the influence of continued aggregation under turbulent flows on the settling process at higher concentration:
When the sediment has a broad size distribution, e.g., contains particles ranging in size from coarse silt to fine clay, τcd does not possess a unique value, but a range of values occur. In tests using kaolinite, Mehta and Partheniades (1975) found τcd ranging from 0.18 N/m2 to about 1.1 N/m2. In such a case, Eqs. 2 and 3 apply to each class i of the total sediment. Data interpretation, however, requires careful analysis.
Near-Bed Concentration
Near-bed sediment concentration in a flow is related to the depth-mean concentration and to the vertical variation in concentration. Vertical variation can be described using direct observations or by an analytic expression relating the principal quantities involved.
An analytic expression for the ratio β of near-bed concentration Cb to depth-mean concentration ![]() was developed by O’Connor and Tuxford (1980), based on the assumption of sediment flux equilibrium, constant diffusivity and constant settling velocity, as well as for settling velocity varying with concentration in the hindered settling range. Teeter (1986) developed an expression for β by assuming a parabolic distribution of diffusivity with variable boundary flux conditions. The result was
was developed by O’Connor and Tuxford (1980), based on the assumption of sediment flux equilibrium, constant diffusivity and constant settling velocity, as well as for settling velocity varying with concentration in the hindered settling range. Teeter (1986) developed an expression for β by assuming a parabolic distribution of diffusivity with variable boundary flux conditions. The result was
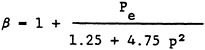
(4)
where Pe=Wsh/kz is the Peclet number for the suspension and kz is the depth-mean eddy diffusivity.
In Table 2, illustrative values of β are given for Pe ranging from 0.06 to 3 and for probability of deposition, p=0 and 1. In general, increasing magnitude of Pe implies increasingly deposition
TABLE 2 Ratio of Near-Bed to Mean Suspension Concentration, β
|
Peclet Number Pe |
β |
|
|
p=0 |
p=1 |
|
|
0.06 |
1.1 |
1.0 |
|
0.3 |
1.2 |
1.1 |
|
1.5 |
2.2 |
1.3 |
|
3 |
3.4 |
1.5 |
dominated environment. Large vertical concentration gradients (β≫1) can occur in estuaries, both under eroding flows and also when the material begins to settle out of the water column.
CONSOLIDATION
A cohesive sediment bed is formed by the combined action of hindered settling and consolidation. Sediment particles and/or aggregates comprising a stress-free stationary suspension undergo hindered settling, during which the particles begin to interact and form a soil mass near the suspension/soil-water interface is balanced by the seepage force induced by the upward flow of pore water from the underlying sediment. As the sediment continues to be brought closer together and the upward flux of pore water lessens, the weight of this near-surface sediment gradually turns into an effective stress (i.e., the difference between total hydrostatic pressure and pore water pressure), which is transmitted by virtue of particle-to-particle contact. These surface stresses are very small and in general are not measurable (Been and Sills, 1981).
Primary consolidation, which is caused by the self-weight of sediment and the overburden resulting from the overlying deposit, begins when effective stresses are first developed. As consolidation continues, a soil or sediment bed is defined to be formed when the water content of the sediment-water suspension decreases to the fluid limit (Parker and Lee, 1979). For cohesive soils, the fluid limit is a function of the initial water content of the suspension. Primary consolidation ends when the excess pore water pressure, which is equal to the total stress minus the sum of the effective stress and the static pore water pressure, has completely dissipated. Secondary consolidation, which is the result of plastic deformation of the soil under a constant overburden, begins during primary consolidation and may typically continue for many weeks or months after primary consolidation ends.
The strains involved in primary consolidation are relatively large, typically greater than π/4 radians (Parker and Lee, 1979). Lee and Sills (1979) state the consolidation strain may continue for several
days, or even months. The straining and upward expulsion of pore water gradually decreases as a soil skeleton continues to develop. Eventually, this skeleton reaches a state of equilibrium with the normal stress of the overlying sediment.
Consideration of the consolidation of cohesive sediment beds is essential in modeling bed erosion because: (1) the susceptibility to erosion of a consolidating soil decreases with time due to the continual increase in bed shear strength, and (2) the accompanying density change in turn changes the flux of eroded sediment per unit bed thickness.
There are several methods for evaluating consolidation of saturated cohesive soils. These include numerical models (Gibson et al., 1981), analytic solutions of the linearized finite strain equation (Lee and Sills, 1981), solution charts developed using the results from a numerical model (Cargill, 1984), and empirically based modeling (Hayter, 1983). Given soft bed density variation with depth at any time, these methods provide a predictive description of the subsequent time-variation of the profile and the corresponding change in the thickness of the deposit.
The numerical and analytic methods are based on solution of the governing equation for finite strain consolidation theory for the time-and depth-varying void ratio. Two constitutive relationships—that between void ratio and soil permeability, and that between void ratio and effective stress—are required for solving the consolidation equation. For any sediment-fluid mixture, these relationships may be determined by using any one of the following devices: geotechnical centrifuge, stress-controlled slurry consolidometer, pore pressure probe, and nuclear densitometer.
Hayter’s (1983) empirical approach yields very approximate results which are based on assumed time- and depth-variations of bed density expressed by a non-dimensional relationship derived from laboratory tests. Its advantage is that it avoids the complexities involved in solving the consolidation equation.
In order to assess the time-varying erosion potential of consolidating beds, a relationship of the form
(5)
where τs=cohesive bed shear strength with respect to erosion, ρD(t)= time-varying (with consolidation) bed dry density and ζ, δ are empirical coefficients, has been obtained from laboratory experiments (Miznot, 1968). Given τs in N/m2 and ρ in kg/m3, Owen (1970) obtained ζ=6.85×10⁻⁶ and δ=2.44. Using different muds, Thorn and Parsons (1980) found similar values of these coefficients (ζ=8.42×10⁻⁶, δ= 2.28). Parchure (1984) however noted that inasmuch as τs and ρD have different physical meaning, there can be no unique relationship between τs and ρD. Eq. 5 is, in fact, very approximate, but one which is quite useful for estimating τs in the absence of a better correlation between properties characterizing bed structure and τs (Hayter, 1983).
In Figure 2, a typical profile of the bulk (wet) density, ρB, obtained by Watts (1954) is shown together with the corresponding bed shear strength profile assuming the validity of Eq. 5 and coefficients ζ, δ of Thorn and Parsons (1980). The dry density, ρD, is equal to (ρB−ρW)ρs/(ρs−ρW), where ρW is fluid (salt water) density and ρs is the sediment density. The density profile extends down into the bed, and shows a characteristic step-like “differentiated” structure (Parker and Kirby, 1977). At about 12 m depth both ρB and ts have significant gradients. The problem of identifying the level at which the bed is encountered is critically important, as noted later.
EROSION
With reference to tide-induced bottom scour, the terms erosion and resuspension are often used synonymously. While the bed shear stress is the primary flow-induced parameter characterizing the erosive force, the corresponding resistive force depends on a number of factors including sediment composition, pore and eroding fluid compositions, and the manner in which the deposit is formed. The deposit itself may be in the form of a stationary or static suspension or a bed. The latter may be soft, partially consolidated, with a very high water content, or a more dense, settled bed. The mode of erosion varies both with the magnitude of the bed shear stress and the nature of the deposit.
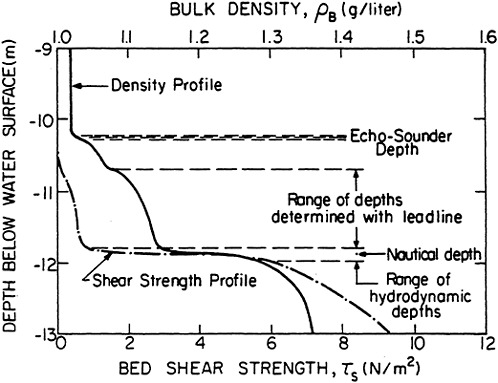
FIGURE 2 Bed bulk density and erosion shear strength, profiles and bed level definitions.
Three modes of erosion have been identified. These include: (1) floc-by-floc or aggregate-by-aggregate erosion of a bed, also referred to as surface erosion, (2) mass erosion of a bed, and (3) reentrainment of a stationary suspension, also referred to as redispersion or mass erosion (Figure 1). The rate of erosion, ![]() (mass of sediment eroded per unit bed area per unit time), can be expressed functionally as
(mass of sediment eroded per unit bed area per unit time), can be expressed functionally as
(6)
where τb−τs is the bed shear stress in excess of the cohesive bed shear strength with respect to erosion, τs, and ν1, ν2….ν1) are erosion resistance specifying parameters.
Surface erosion typically occurs at low to moderate values of the excess shear stress, τb−τs, and is prevalent in estuaries subject to corresponding currents of low to moderate strength. Quantification of the range of τb−τs or that of the current is highly dependent on the degree of resistance provided by the bed, which is site specific. The form of Eq. 6 for surface erosion depends on bed properties. For relatively dense, consolidated beds (water content well below 100 percent) with uniform properties, the erosion rate expression is
(7)
where α1 is equal to ![]() when τb=2τs, and τs is constant over bed depth. In this case, τs is often referred to as the critical shear stress for erosion, in analogy with cohensionless sediment transport (Ariathurai and Arulanandan, 1978). Values of α1 and τs vary with the type of sediment, water content, total salt concentration, ionic species in the fluid, pH, and temperature. On the other hand, α1 and τs poorly correlate with bulk soil indices such as the Atterburg limits, which are inadequate indicators of cohesive interparticle bond strength (Partheniades, 1965).
when τb=2τs, and τs is constant over bed depth. In this case, τs is often referred to as the critical shear stress for erosion, in analogy with cohensionless sediment transport (Ariathurai and Arulanandan, 1978). Values of α1 and τs vary with the type of sediment, water content, total salt concentration, ionic species in the fluid, pH, and temperature. On the other hand, α1 and τs poorly correlate with bulk soil indices such as the Atterburg limits, which are inadequate indicators of cohesive interparticle bond strength (Partheniades, 1965).
Recognizing that Na+, Ca++, and Mg++ are three commonly found cations in soils, the sodium adsorption ratio SAR is found to be a useful parameter representing the influence of ionic species on α1 and τs. SAR is defined as
(8)
where [ ] indicates concentration in milliequivalents per liter (Arulanandan et al., 1978).
For soft (water content well above 100 percent), partially consolidated beds, Parchure and Mehta (1985) found the rate expression for surface erosion to be
(9)
where α2 is an empirical rate constant, ![]() is defined as the floc erosion rate and τs generally increases with depth below the bed surface, at least over the top few centimeters, and also increases with the degree of consolidation. For thin beds, e.g., of a few centimeters thickness, the time dependence of τs becomes practically negligible after one or two weeks, and a consolidated bed results. In general, α2,
is defined as the floc erosion rate and τs generally increases with depth below the bed surface, at least over the top few centimeters, and also increases with the degree of consolidation. For thin beds, e.g., of a few centimeters thickness, the time dependence of τs becomes practically negligible after one or two weeks, and a consolidated bed results. In general, α2, ![]() and τs in Eq. 9 depend on the same physicochemical factors as α1 and τs in Eq. 7.
and τs in Eq. 9 depend on the same physicochemical factors as α1 and τs in Eq. 7.
When τb−τs becomes large, or when rapidly accelerating flows occur, the bed may fail at some plane below the surface and clumps of material are mass eroded. Erosion by this process can be described approximately by an expression of the form of Eq. 7, although the rate is typically much greater than for surface erosion. Mass erosion is dominant in areas of strong tidal currents and also under storm-generated flows.
Re-entrainment of a stationary suspension is not a well understood phenomenon. During this process, which, for instance, occurs at times following slack water and also when wind-generated waves superimposed on flood tidal currents act on recently formed fluid mud, the suspension density decreases with the progress of erosion and wave-like forms tend to develop at the interface with associated sediment entrainment. As the flow velocity increases, the rate of entrainment can become quite rapid (Wells, 1983).
Shallow and intermediate depth waves can substantially enhance the rate of bed erosion or resuspension. This rate enhancement results from bed softening under wave-induced oscillatory loading. Furthermore, if, as noted, waves occur in the presence of currents, the combined wave-current bed shear stress can be quite large and the resuspended material is easily transported by the currents. Two laboratory flume studies on wave-induced resuspension of deposited muds are noteworthy. One was by Alishahi and Krone (1964) in which waves were generated by wind. In the study by Thimokorn (1984), mechanically generated waves were used. In both studies, suspended sediment concentration variation with time was measured. Although no erosion rate expression was proposed in either study, the data suggest that the rate expression would be analogous to Eqs. 7 or 8. In a later study (Mehta and Maa, 1986) it was found that highly stratified suspensions develop during erosion, with a fluid mud layer near the bed, and a relatively much lower concentration layer above.
In conjunction with wave-induced erosion of relatively soft beds, the associated phenomena of bed softening, mud motion and attenuation of surface wave amplitude due to energy dissipation in the mud must be taken into consideration. In addition, the shear stress at the mud-fluid interface differs from the shear stress over a rigid bed as a result of the oscillatory response of the bed itself. Early observations of this type of response were made by Miznot (1968) in a laboratory flume in which he showed that the amplitude of mud oscillation is
influenced by the type of mud-fluid mixture, bed density, mud viscosity, and the degree of consolidation. These observations have since been confirmed (Mehta and Maa, 1986).
SUSPENSIONS
Concentration
Time varying suspended cohesive sediment concentration over a wide range (100 to 105 mg/liter) of spatial and temporal scales are required to be measured. There are few absolute measurement techniques adequate to the requirements of spatial resolution. As a result, it is essential to choose the most appropriate measurement technique. The choice is governed by: (1) the need to have rapid and unambiguous response over a wide range of concentrations, (2) the need to prevent the sampling method used to affect the parameter being measured, and (3) the need to have an output which is readily amenable to automated data handling (Parker, 1986).
Gravimetric Analysis
This accurate but slow technique involves collection of a water sample followed by a filtration or sedimentation procedure for determining the suspension concentration by weighing the dry sediment residue. Water bottles and shipboard pumps are the two most common water sampling devices (Parker, 1986).
Optical Methods
Instruments for optical determination of suspended sediment concentration include the transmissometer, nephelometer and Secchi disk. Nephelometers are not very practical for use in estuaries since they are sensitive to only very low concentrations. Secchi disks can be used to estimate surface values only. Transmissometers, or electro-optical turbidity meters, have been successfully used to measure vertical turbidity profiles in, among others, the Severn (England), Maas (The Netherlands), James, and Rappahannock estuaries (Kirby and Parker, 1977; Nichols 1986).
Acoustical Methods
Several investigators (Jansen, 1978; Thorne et al., 1983) have studied the use of ultrasound for sediment transport studies. In addition, there is a very considerable body of literature on the acoustic properties of particle dispersions (Ahuja, 1974). Both attenuation and scattering are influenced, as a function of frequency,
by concentration and particle size (Parker, 1986). Ambiguities occur at differing concentrations as attenuation, for example, increases and then decreases across a particular concentration range; thus, calibration by gravimetric analysis is essential. Ultrasonic measurements are particularly sensitive to compressive components in the sediment (e.g., gas microbubbles or cellular plant tissue). Nevertheless, acoustic developments have made a promising start since they offer distinct advantages of nonintrusive measurement (Orr and Grant, 1982; Orr and Hess, 1978).
Nuclear Methods
Both the gamma-ray transmission densitometer and the backscatter densitometer measure in situ sediment density profiles over the mass concentration range of 0–1,600 g/liter (Parker et al., 1975). The accuracy of these probes may be reduced by adsorbed pollutants, such as heavy metals and organic matter. If the pollutant concentrations are significant, corrections are required (Brolsma, 1983). Nuclear densitometers provide a method for near absolute determination of mass concentration, although it is limited by spatial and temporal integration. However, new detector technology offers promise for practical studies over a wide range of concentrations (Parker, 1986).
Mobile and Stationary Suspensions
The structure and horizontal movement of mobile suspensions has been examined by workers using optical turbidity sensors, sampling and other conventional oceanographic techniques. Relatively low density suspensions, less than ~1,000 mg/liter, often exhibit verticle profiles which can be approximated functions. However, Parker and Lee (1979) observed in the Severn, England, a well-mixed high-energy estuary, some important characteristics of high-density mobile and stationary suspensions as follows:
-
Continuous, vertical turbidity profiles revealed that concentration was not typically a smooth exponential function of height above the bed. The most common profiles were either vertically homogeneous or, more commonly, were stratified and temporally variable.
-
As the spring to neap cycle progressed, stratification in the suspension became more pronounced. The suspended solids population settled through the water column so that concentrations in the upper part of the column decreased, while concentrations near the bed increased.
-
At times when the currents were weak the near-bed layers became stationary on the bed but were redispersed (Figure 1) on the succeeding tide.
-
As neap tides approached, stationary suspensions persisted progressively longer into the succeeding tidal cycle until they
-
were able to resist erosions, both as a result of lower bed shear stresses and higher bed shear strength due to settling and consolidation.
These observations, as well as similar ones in the Maas estuary, in the Netherlands (Parker and Kirby, 1977), the Pao Kye estuary in Thailand (Allersma, 1980) and elsewhere along open coasts (Wells, 1983) emphasize the critical need to detect and quantify near-bed sediment transport governed by the motion of high-density fluid mud layers. In the majority of estuarial and coastal environments in which measurable rates of cohesive transport occur, it is not unusual to find that a significant portion of the transport is in fact confined to the near-bed region, particularly if the strength of current is low, or when the flow regime is wave dominated (Mehta and Maa, 1986). The ratio β of the depth-mean concentration to near-bed concentration (Table 2) is well above unity in these cases.
Dispersive Transport
Appropriate diffusion coefficients must be selected to account for dispersive transport of the suspended material. Jobson and Sayre (1970) verified the Reynolds analogy for sediment particles in the Stokes range (less than about 100 µm in size). It was found that the turbulent Schmidt number is approximately equal to one, and decreases with increasing particle size. As a result, it is acceptable to use analytic formulations relating the effective sediment mass dispersion coefficients for fine sediment to the mean flow parameters as are used for the momentum transfer coefficients. For instance Hayter (1983), in his numerical procedure, used the dispersivity tensor based on the work of Fischer (1978) for solving the depth-integrated advection-dispersion equation for tidal flows. For computing the rates of sedimentation in small basins, Askren (1979) proposed other formulations for the longitudinal and transverse dispersion coefficients.
Under waves, both longitudinal and vertical diffusion is typically much more significant in the near-bed layer than in the upper portion of the water column. Near the bed, particularly if it is soft, the wave boundary layer, wave-induced bed interface undulations and associated vortex shedding contribute to high diffusion rates. Eroded sediment therefore tends to accumulate near the bed, forming a high-density fluid mud layer (Mehta and Maa, 1986).
BED LEVEL MEASUREMENT
Measurements of bed level are central to the positive identification of erosion, bed stability, or deposition. They identify the existence and scale of problems and the success of remedial measures in mitigating them. They are used to quantify dredging need or dredging
achieved and they often constitute the principal approach available to parameterize, calibrate or check models of erosion or deposition. Thus, it is of crucial importance that bed level measurements are undertaken with meaningful accuracy.
In many cohesive sediment areas the position of the bed is occupied by a transition from muddy water, through watery mud to firm mud (Figure 1). The transition may be discontinuous and may span a few centimeters or several meters. Thus, in contrast with cohesionless sediment areas, the plan of the bed may be ill defined. In such circumstances the method used to measure the depth of water to the sediment/water interface may have a considerable influence on the result obtained.
In most practical circumstances the bed level which is of interest relates to one of the following:
-
The level within the sediment which is resistant to ambient flow-induced stresses and is the bed over which water flows—this may be designated the “hydrodynamic bed” and the depth to it the “hydrodynamic depth.”
-
The level at which sediment properties deleteriously affect the safe navigation of vessels and which is of main interest to dredging—this has been referred to as the “nautical bed” and the depth to it is the “nautical depth” (Kirby et al., 1981; Nederhof and van Bochove, 1981).
Thus hydrodynamic depth is the depth of interest to modelers for predicting sedimentation or erosion, loss of storage capacity in reservoirs, or fluxes of sorbed pollutants. Nautical depth is the depth of interest to design of navigation channels, formulation of dredging strategies or management of dredging works. In Table 3 the natural and practical determinants of bed level (hydrodynamic and nautical) are compared with methods used to measure the bed level elevation. It is self-evident that in general terms there is no physical relationship between either of the bed level definitions and the most common techniques used in surveys, e.g., leadlines (sounding weights) or acoustic sounders (echo sounders, fathometers, sonar). A particular source of confusion is the ambiguity that arises from the use of fathometers for defining bed levels in muddy areas (Kirby et al., 1980; Nederhof and Bochove, 1981; Parker and Kirby, 1977; Parker and Kirby 1982). It lies in the parameters which affect the detection of muddy substrates by echo sounders.
The principal parameters of interest to hydrographic surveys in muddy areas are sound speed and target strength (Akal, 1972; Gupta, 1966). The latter can be calculated from the reflection coefficient, which in muddy areas is strongly controlled by the density (Parker and Kirby, 1977). It has been demonstrated, however, that reflectors on echo sounder records depend principally on the density gradient rather than the density magnitude such that echo sounder reflectors may appear due to consolidation rather than deposition, and that the reflectors do not follow specific values of density (Parker and Kirby, 1982; Kirby et al., 1981). Furthermore, the critical density gradient for detection
TABLE 3 Comparison of Parameter- and Technique-Defined Bed Levels
|
Parameter/Technique |
Bed Level |
|
Hydrodynamic depth |
Bed erosion resistance balances bed shear stress; influenced by the time-dependent bed structure; related to rate of deposition. |
|
Nautical depth |
Bed properties prevent passage of ship’s hull; a concept and successfully applied to dredging management in some ports; relates to bed properties such as density or rigidity. |
|
Leadline or sounding weight |
Submerged weight of sounding lead balanced by density and viscosity of mud; influenced by shape and use of weight and bed properties. |
|
Acoustic sounding (echo sounders/fathometers/sonar) |
Reflectivity of the bed structure governs the return of echo to the acoustic source; depends on gradient of parameters (mainly density) which are time-dependent. |
|
Density profiles |
Specific density values are assigned a “non-navigable” status in the nautical depth concept; absolute definition of a parameter (density) determined by in situ measurement. |
is frequency dependent but not in a consistent manner, as illustrated in Figure 2. Here, the spatial variability between reflectors from commonly used (200 kHz frequency) survey echo sounders, as related to the density profile, is exemplified. Echo sounders define a target range, which has no unique correspondence with either hydrodynamic or nautical depth.
Leadlines are used as a standard method of checking echo sounder accuracy; however, leadline data are no more dependable. Watts (1954) reported a spread of more than 0.6 m in leadline depths measured under laboratory conditions and up to 2.0 m in field trials in muddy channels. Referring to Figure 2 it can be stated that technique defined depth (echo sounder, leadline) is in general shallower, and shows more spread than parameter defined depth (hydrodynamic, nautical).
The parameter defined bed levels are essentially related to density. The hydrodynamic bed is contingent upon bed resistance, which is defined, albeit in an approximate way, by Eq. 5. Based on accept able levels of ship hull resistance through muddy waters in port areas, the nautical bed has been specified at a bulky density between 1.1 and 1.2 g/cm3. A range of density measuring devices have been used,
including nuclear gauge systems (Caldwell, 1960; Parker and Kirby, 1982), advanced acoustic transmissometers (Chaumet-Lagrange et al., 1984), and electrical systems (Ariathurai and Arulanandan, 1986).
For calculating the rates of suspended cohesive sediment transport from field measurements, density measuring devices are significantly more reliable than echo sounders. However, in practical terms these devices are not as efficient in covering large areas which are readily examined by acoustic techniques, and are thus more suited specifically to problems involving soft muds or “fluff” in relatively confined areas of critical importance, for example, in modeling cohesive sediment transport.
DATA REQUIREMENT AND RESEARCH NEEDS
In most estuarial and nearshore areas where cohesive sediment transport occurs, it is necessary to take both erosion and deposition into account. Areas where only one of these processes is dominant are usually quite localized, e.g., erosion dominated portions of a channel with high velocities or small harbor basins where material deposits without significant resuspension. As a consequence of the oscillatory nature of tidal flows and associated cycles of erosion and deposition, modeling of cohesive sediment transport in most typical cases is carried out via solution of the advection-dispersion equation of sediment mass conservation using numerical techniques. Only, in the most simple cases, e.g., those involving either erosion or deposition in steady or quasi-steady flows, are analytic approaches feasible. In general, therefore, data collection effort in field investigations for prediction of sedimentation or scour is guided by the need to provide input to numerical models. This requirement and the present state of knowledge of transport processes essentially sets the framework for data requirement in any field investigation, as well as future research needs.
While it is not the purpose here to provide details of data requirement or procedures for data collection, which for instance have been summarized by Hayter (1983), some comments on related issues seem appropriate. First, it is recognized that, inasmuch as cohesive sediments, by virtue of their low settling velocities, are typically advected over relatively large horizontal distances during each tidal cycle, numerical model results have been found to be highly sensitive to the hydrodynamic (flow field) description, which must therefore be characterized and simulated with a good degree of accuracy to avoid gross errors in prediction, e.g., of zones of sedimentation or scour.
With regard to field data collection, particular attention must be paid to the need to obtain settling velocities in situ, as well as density profiles from the water surface down to depths at which a stable bed is encountered, i.e., bed which is not periodically eroded either under spring tides or under seasonally dependent episodic conditions. Inasmuch as scaling laws for settling velocity of cohesive aggregates in turbulent flows are not presently known, laboratory
measurement of settling velocities should not be used only for aiding in the interpretation of field determined values. Density profiles are highly site specific and cannot be deduced either from data from other sites or from laboratory tests.
Most other process-characterizing coefficients for deposition, consolidation and erosion can, and in most cases need to be obtained from laboratory tests. This requirement arises out of the fact that determining these coefficients (e.g., τcd in Eq. 3; constitutive relationships for consolidation; ζ, δ in Eq. 5; α1, α2, τs, ![]() in Eqs. 7 and 9 etc.) necessitates the isolation of each of these processes which are typically coupled in the field environment.
in Eqs. 7 and 9 etc.) necessitates the isolation of each of these processes which are typically coupled in the field environment.
Numerical model results indicate that presently known process descriptions yield reliable predictions for estuarial scour and sedimentation rates (Hayter, 1983). At the same time, gaps in understanding certain processes have been revealed. These gaps are principally associated with the estimation of settling velocities, identification of hydrodynamic depth and the behavior of stationary and mobile near-bed suspensions.
Reliable techniques for estimating field settling velocities, without resorting to in situ measurement each time, are not available. In this context, the correspondence, if any, between field and laboratory-determined settling velocities deserves special consideration in future effort.
Several sub-areas of research are essential for hydrodynamic depth identification. These include the development of suitable instrumentation for measuring current velocity profiles in high-density near-bed suspensions, understanding the interaction between high-density suspension and near-bed hydrodynamics, and effective stress response of the bed during its formation and erosion.
Finally, descriptive quantification of the behavior of stationary as well as mobile, near-bed, high-density suspensions under eroding currents as well as waves will necessitate further effort. A key element in this area is appropriate rheological characterization of the suspension.
CONCLUSIONS
An extensive body of literature presently exists to assist the engineer in understanding and characterizing the processes of settling and deposition, consolidation, and erosion of cohesive sediment. In most cases, data collection and interpretation efforts are guided by the need to predict rates of erosion and sedimentation in the field through numerical modeling. In general, both basic knowledge of the processes and practical experience are highly essential in these efforts.
Future research needs are likewise determined by gaps in present understanding of process description which is essential for improved prediction through modeling. Better estimation of settling velocities and the behavior of near-bed high-density suspensions are essential.
Detection of definable bed in the field and the coupled problem of transition between bed and suspension during erosion and deposition deserve further consideration.
REFERENCES
Ahuja, A.S. 1974. A review of the derivations of the formulas for the acoustic properties of liquid-solid mixtures. Physics of Sound in Marine Sediments, L.Hampton, ed. New York: Plenum Press. Pp. 1–17.
Akal, T. 1972. The relationship between the physical properties of underwater sediments that affect bottom reflection. Mar. Geol. 13(4):251–266.
Alishahi, M.R. and R.B.Krone. 1964. Suspension of cohesive sediment by wind-generated waves. Report HEL-2–9. Hydraulic Engineering Laboratory, University of California, Berkeley.
Allersma, E. 1980. Mud in estuaries and along coasts. Proc. Internat. Symp. River Sedimentation, Chinese Society of Hydraulic Engineering, Bejing. Pp. 663–685.
Ariathurai, R. and K.Arulanandan. 1978. Erosion rates of cohesive soils. J. Hydraul. Div. ASCE 104(HYZ):279–283.
Ariathurai, R. and K.Arulanandan. 1986. An electrical method to measure in situ sediment densities. Estuarine Cohesive Sediment Dynamics, A.J.Mehta, ed., Lecture Notes on Coastal and Estuarine Studies Vol. 14. Berlin: Springer-Verlag. Pp. 206–218.
Arulanandan, K., P.Loganathan, and R.B.Krone. 1975. Pore and eroding fluid influences on surface erosion of soil. J. Geotech. Div. ASCE 101(GTI)51–66. Proc. Paper 11075.
Askren, D.R. 1979. Numerical simulation of sedimentation and circulation in rectangular marina basins. Tech. Rep. NOS 77. Rockville, Md.: National Ocean Survey.
Been, K. and G.C.Sills. 1981. Self-weight consolidation of soft soils: An experimental and theoretical study. Geotechnique 31(4):519–535.
Brolsma, J.V. 1983. Navigation in muddy areas. Proc. Internat. Conf. Coastal and Port Eng. in Developing Countries. Vol. 1, Colombo, Sri Lanka. Pp. 678–692.
Burt, T.N. 1986. Field settling velocities of estuary muds. Estuarine Cohesive Sediment Dynamics, A.J.Mehta, ed., Lecture Notes on Coastal and Estuarine Studies Vol. 14. Berlin: Springer-Verlag. Pp. 126–150.
Caldwell, J.M. 1960. Development and tests of a radioactive sediment density probe. Techn. Memo. No. 121, U.S. Army Corps of Engineers Beach Erosion Board, Washington, D.C.
Cargill, K.W. 1984. Prediction of consolidation of very soft soil. J. Geotech. Eng. ASCE 10(6):775–795. Proc. Paper 18929.
Chase, R.R.P. 1979. Settling behavior of natural aquatic particulates. Limnol. and Oceanogr. 24(3):417–426.
Chaumet-Lagrange, M., J.Grandboulan, and C.Fourcassies. 1984. Measuring the navigable depth in a muddy channel. Proc. Second Internat. Hydrol. Tech. Conf. Plymouth, U.K. pp. 1–8. Paper No. 27.
Federal Inter-Agency River Basin Committee. 1953. Accuracy of sediment size analyses made by the bottom withdrawal tube method. Report No. 10, Measurement and Analysis of Sediment Loads in Streams, Series, St. Anthony Hydraulics Laboratory, University of Minnesota, Minneapolis.
Fischer, H.B. 1978. On the tensor form of the bulk dispersion coefficient in a bounded skewed shear flow. J. Geophys. Res. 83(C5):2373–2375.
Gibson, R.E., R.L.Schiffman, and K.W.Cargill. 1981. The theory of one-dimensional consolidation of saturated clays, Ii. Finite Nonlinear Consolidation of Thick Homogeneous Layers. Can. Geotech. J. 18(2):280–293.
Grim, R.E. 1968. Clay Mineralogy. New York: McGraw-Hill.
Gupta, R.N. 1966. Reflection of sound waves from transition layers. J. Acous. Soc. Am. 39(2)255–260.
Hayter, E.J. 1983. Prediction of Cohesive Sediment Movement in Estuarial Waters. Ph.D. dissertation, University of Florida, Gainesville.
Jansen, R.H.G. 1978. In situ measurement of sediment transport by means of ultra-sound scattering. Publication No. 203, Delft Hydraulics Laboratory, Delft, The Netherlands.
Jobson, H.E. and W.W.Sayre. 1970. Vertical transfer in open channel flow. J. Hydraul. Div. ASCE 96(HY3)703–724. Proc. Paper 7148.
Kirby, R. and W.R.Parker. 1977. The physical characteristics and environmental significance of fine sediment suspensions in estuaries. Estuaries, Geophysics and the Environment. Washington, D.C.: National Academy of Sciences. Pp. 110–120.
Kirby, R., W.R.Parker, and W.H.A.van Oostrum. 1980. Definition of the sea bed in navigation routes through mud areas. Internal. Hydrograp. Rev. LVII(1):107–117.
Krone, R.B. 1982. Flume studies of the transport of sediment in estuarial processes. Final Report, Hydraulic Engineering Laboratory and Sanitary Engineering Research Laboratory, University of California, Berkeley.
Krone, R.B. 1963. A study of rheological properties of estuarial sediments. Technical Bulletin No. 7, Committee on Tidal Hydraulics, Vicksburg, Miss.: U.S. Army Engineer Waterways Experiment Station.
Lee, K. and G.C.Sills. 1979. A moving boundary approach to large strain consolidation of a thin soil layer. Proc. Third Internat. Conf. on Numerical Methods in Geomechanics, W.Witke, ed., Rotterdam, The Netherlands, Apr. Pp. 163–173.
Lee, K. and G.C.Sills. 1981. The consolidation of a soil stratum, including self-weight effects and large strains. Num. Analyt. Meth. in Geomech. 5:105–428.
Mclaughlin, R.T. 1959. The settling properties of suspensions. J. Hydraulics Div. ASCE 85(HY12):9–42.
Mehta, A.J. and E.Partheniades. 1975. An investigation of the depositional properties of flocculated fine sediments. J. Hydraul. Res. 12(4):361–381.
Mehta, A.J., T.M.Parchure, J.G.Dixit, and R.Ariathurai. 1982. Resuspension potential of deposited cohesive sediment beds. Estuarine Comparisons, V.S.Kennedy, ed. New York: Academic Press. Pp. 591–609.
Mehta, A.J. and P.Y.Maa. 1986. Waves over mud: modeling erosion. Proc. Third Internat. Symp. on River Sedimentation, Vol. III, University of Mississippi, Jackson. Pp. 558–601.
Miznot, C. 1968. A study of the physical properties of different very fine sediments and their behavior under hydrodynamic action. La Houille Blanche 7:591–620.
Montague, C.L. 1986. Influence of biota on erodibility of sediments. Estuarine Cohesive Sediment Dynamics, A.J.Mehta, ed., Lecture Notes on Coastal and Estuarine Studies Vol. 14. Berlin: Springer-Verlag. Pp. 251–269.
Nederhof, I. and G.van Bochove. 1981. Maneuvering behavior of ships in muddy canals and harbors. Dock and Harbour Auth. LXII(726):2–6.
Nichols, M.M. 1986. Effects of fine sediment resuspension in estuaries. Estuarine Cohesive Sediment Dynamics, A.J.Mehta, ed., Lecture Notes on Coastal and Estuarine Studies Vol. 14, Berlin: Springer-Verlag. Pp. 5042.
O’Connor, B.A. and C.Tuxford. 1980. Modeling siltation at dock entrances. Proc. Third Internat. Symp. on Dredging Technology, Paper F2, British Hydraulic Research Association-Fluid Engineering, Bordeaux, France. Pp. 359–372.
Orr, M.H. and F.R.Hess. 1978. Remote acoustic monitoring of natural suspenate distribution, active suspensate resuspension and slope/ shelf water intrusions. J. Geophys. Res. 83(C8):4062–4068.
Orr, M.H. and W.D.Grant. 1982. Acoustic sensing of particles suspended by wave-bottom interactions. Mar. Geol. 45(3/4):253–260.
Owen, M.V. 1970. A detailed study of the settling velocities of an estuarine mud. Report No. INT 78, Hydraulics Research Station, Wallingford, U.K.
Owen, M.V. 1971. The effects of turbulence on settling velocities of silt flocs. Proc. Fourteenth Cong. Internat. Assoc. for Hydraulic Res. Vol. 4, Paris. Pp. 27–32.
Parchure, T.M. 1984. Erosional Behavior of Deposited Cohesive Sediments. Ph.D. dissertation. University of Florida, Gainesville.
Parker, W.R. 1986. On the observation of cohesive sediment behavior for engineering purposes. Estuarine Cohesive Sediment Dynamics, A.J.Mehta, ed., Lecture Notes on Coastal and Estuarine Studies Vol. 14, Berlin: Springer-Verlag. Pp. 270–289.
Parker, W.R., G.C.Sills, and R.E.A.Paske. 1975. In situ bulk density measurement in dredging practice and control. Proc. First Intern. Symp. on Dredging Technology, Paper B3, British Hydraulic Research Association-Fluid Engineering, S.K.Hemmings, ed., Canterbury, U.K. Pp. 25–41.
Parker, W.R. and R.Kirby. 1977. Fine sediment studies relevant to dredging practice and control. Proc. Second Intern. Symp. on Dredging Technology, Paper B2, British Hydraulic Research Association-Fluid Engineering, Texas A&M University, College Station, Tx. Pp. 15–26.
Parker, W.R. and K.Lee. 1979. The behavior of fine sediment relevant to the dispersal of pollutants. ICES Workshop on Sediment and Pollutant Interchange in Shallow Seas, S.K.Hemmings, ed., Canterbury, U.K.
Parker, W.R. and R.Kirby. 1982. Time-dependent properties of cohesive sediment relevant to sedimentation management. Estuarine Comparisons, V.S.Kennedy, ed. New York: Academic Press. Pp. 573–589.
Partheniades, E. 1965. Erosion and deposition of cohesive soils. J. Hydraul. Div. ASCE 91(HY1):105–139.
Teeter, A.M. 1986. Vertical transport in fine-grained suspension and newly-deposited sediment. Estuarine Cohesive Sediment Dynamics, A.J.Mehta, ed., Lecture Notes on Coastal and Estuarine Studies Vol. 14, Berlin: Springer-Verlag. Pp. 170–191.
Thimakorn, P. 1984. Resuspension of clays under waves. Seabed Mechanics, P.B.Denness, ed. London: Graham and Trotman. Pp. 191–196.
Thorn, M.F.C. and J.G.Parsons. 1980. Erosion of cohesive sediments in estuaries: an engineering guide. Proc. Third Internat. Symp. on Dredging Technology, Paper F1, British Hydraulic Research Association-Fluid Engineering, Bordeaux, France. Pp. 349–358.
Thorne, P.D., A.P.Salkield, and A.J.Marks. 1983. Application of acoustic techniques in sediment transport research. Acoustics and Sea Bed, N.G.Pace, ed. Bath University Press, Bath, U.K. Pp. 395–402.
Watts, G.M. 1954. laboratory and field tests of sounding leads. Technical Memorandum No. 54, U.S. Army Corps of Engineers Beach Erosion Board, Washington, D.C.
Wells, J.T. 1983. Dynamics of coastal fluid muds in low, moderate, and high tide-range environments. Can. J. Fish. Aquat. Sci. 40:130–142.
Whitehouse, U.G., and L.M.Jeffrey. 1952. Chemistry of marine sedimentation. Study of Nearshore Recent Sediments and their Environments in the Northern Gulf of Mexico, Progress Reports 5, 6, 7, American Petroleum Research Project 51, Texas A&M Research Foundation, College Station, Tx.
Whitehouse, U.G., L.M.Jeffrey, and J.D.Debbrecht. 1960. Differential settling tendencies of clay minerals in saline waters. Proc. Seventh Nat. Conf. on Clay and Clay Minerals, London: Pergamon Press. Pp. 1–79.
FIELD MEASUREMENT OF COHESIVE SEDIMENT BEHAVIOR IN ESTUARIES
R.Kirby
Ravensrodd Consultants, Ltd.
United Kingdom
In this paper field measurements are presented from two contrasted types of estuaries, made with a range of techniques that are still not commonly employed. The Severn River estuary (United Kingdom) has a high and variable tidal range (mean spring range is 12.3 m, mean neap range is 6.5 in at Avonmouth), and is well mixed with respect to salinity and temperature. The associated suspended solids regime is also high and variable. The Rhine River estuary (The Netherlands) has a low tidal range (mean spring range is 1.9 m, mean neap range is 1.5 m at Hook of Holland), and is highly stratified with respect to salinity and temperature. The generally low energy in the Rhine estuary results in a generally low-concentration, suspended solids regime. Both estuaries are the sites of major ports with large mud maintenance dredging requirements. Annual mud maintenance dredging needed at Cardiff, Newport, and Avonmouth in the Severn is currently close to 8 million tonnes, while at the Rotterdam-Europort complex, the world’s largest port, dredging requirements were close to 10 million tonnes in the mid 1970s (Figure 1). Despite the complexities of fine sediment behavior and the contrasts between the types of estuary considered, one positive feature is that the processes and mechanisms by which fine cohesive sediment is introduced into these harbors are very similar. Both estuaries experience penetration by dense, near-bed mobile suspensions, which stagnate to form stationary suspended (fluid mud) layers, and ultimately consolidate to impede safe navigation.
An exhaustive field investigation has been carried out in the Severn estuary over a number of years using the techniques discussed below. Many marine surveys have provided a large data base, such that the turbidity maximum of this estuary is now better known than any other estuary in the world. Less extensive investigations using the same techniques have been carried out in the lower Rhine.
THE SCOPE OF THE PROBLEM
The physical size of estuaries and the dynamic nature of processes operating within them pose serious problems in making valid field measurements of any conservative oceanographic parameter. Measurement
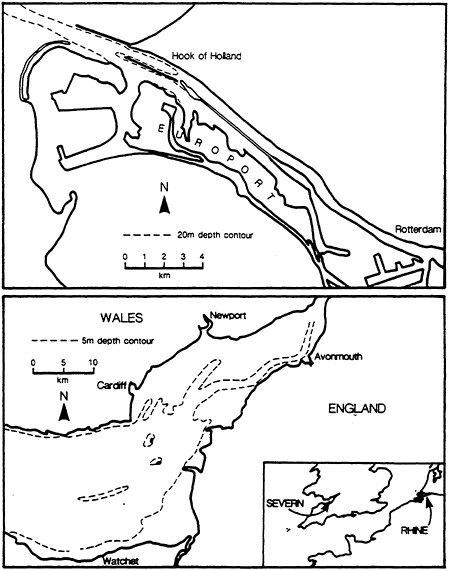
FIGURE 1 Locality map of Severn and Rhine estuaries.
of the erosion, transport, and deposition of nonconservative components, such as sediment, present even more severe logistic problems. These problems are related to the spatial discontinuity and intermittancy of the movement, and the general lack of understanding of the processes involved. Fine cohesive sediments present by far the most difficult and intractable measurement problems. Despite the difficulties, these problems must be addressed because a wide range of engineering and environmental issues are uniquely concerned with cohesive sediments.
An indication of just how much more severe are the problems of investigating fine cohesive sediments can be gained by a brief comparison with noncohesive sediments. In cohesive sediment regimes visibility is often low or nil; as a result, visual observation or
location techniques, widely used to study noncohesive sediment, are inappropriate. Erosion of noncohesive grains occurs as a result of well understood processes of grain by grain detachment from the bed. Individual grains are largely noninteracting and laboratory measurements replicate more or less exactly the prototype behavior. In contrast, cohesive sediment erosion may be by grain, or alternatively, aggregate detachment from the boundary. Frequently however, in underconsolidated cohesive boundaries, erosion—or more correctly entrainment—is by the mass failure of the underlying medium. The erodibility of such cohesive media increases with depth below the sediment surface such that, unlike sand, if a surface cohesive sediment layer is stripped, the identically sized layer beneath has an increased resistance to entrainment. Further complicating factors are the spatial variability of the erosion potential and the increase in erosion resistance with time in cohesive media. In addition, the eroding capability of a cohesive sediment-laden flow is influenced to a large extent by the concentration of the suspended load already being carried. To add to the problems of the physics, biological and electrochemical binding processes may largely control cohesive sediment erodibility.
These complexities apply to an equal extent to the processes of cohesive sediment transport. A major, and presently unquantifiable, phenomenon is the extent to which fine-grained aggregates at various levels in the flow, away from and uninfluenced by the boundary, interact with the flow and impart a significant non-Newtonian component to the flows involved. In addition, suspended sediment does not simply move as a passive and conservative component following the turbulent transport of water, but forms dense near-bed layers in which excess density and viscous forces may contribute driving forces additional to the gravitational and hydrodynamic components of flow.
For cohesive sediments there is also the unique and major complicating factor that these near-bed layers or zones, which may occupy a significant proportion of the flow (10–20 percent), have characteristics intermediate and gradational in character between water and the bed. There are thus problems as major and fundamental as deciding where “the bed” is and when “deposition” is deemed to have occurred.
This outlining of a few of the complexities of the field behavior of cohesive sediment makes it clear that the least known media, namely the dense near-bed suspended layers, are the very materials which are of the greatest practical significance in terms of introducing cohesive sediment into shipping channels and harbors.
It is as a direct result of these severe practical difficulties that, in the past, field investigations have been undertaken in a rather superficial manner, and of necessity scientists have concentrated on small-scale laboratory experiments and mathematical models. Although state of the art, such simulations are deficient in incorporating the full range of physical, biological, and chemical processes involved and therefore of limited applicability.
COHESIVE SEDIMENT BEHAVIORAL MODEL
To understand the type of measurements required it is necessary to have a clear understanding of the manner in which cohesive sediment occurs in turbid coastal regions, and the way in which the various behavioral states are interrelated. This is shown in the conceptual model in Figure 2 (Kirby and Parker, 1983).
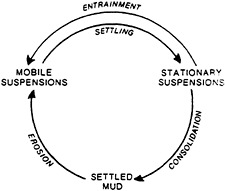
FIGURE 2 Fine-sediment behavioral model showing states of occurrence and linking processes.
Mobile suspensions are moving, fluid-supported assemblages of particles. They have been encountered over solid mass concentrations ranging from <0.01 to >150 g 1−1. They arise from several sources: by sea and river input, by the gradual erosion of settled muds over a prolonged time scale (years), and by the rapid entrainment (minutes) of stationary suspensions from the bed. Much of this material returns to the stationary suspension state by settling over intermediate time scales (hours or days).
Stationary suspensions are fluid-supported or partly framework-supported assemblages of particles having no lateral component of movement. Stationary suspensions occur over the concentration range <0.1 to ![]() 200 g 1−1. They evolve by settling from concentrated mobile layers, and the period over which relatively thick layers (
200 g 1−1. They evolve by settling from concentrated mobile layers, and the period over which relatively thick layers (![]() 3 m) come to a halt may be extremely short (a few seconds). Following this, they continue to consolidate and generally have a lifespan measured in hours or days. Some stationary suspensions are detectable by echo sounders and are commonly known as “fluid mud” (Inglis and Allen, 1957).
3 m) come to a halt may be extremely short (a few seconds). Following this, they continue to consolidate and generally have a lifespan measured in hours or days. Some stationary suspensions are detectable by echo sounders and are commonly known as “fluid mud” (Inglis and Allen, 1957).
Settled mud is deposited cohesive sediment in which individual particles are supported by the surrounding particle framework. Settled muds have a residence time measured in months or years, and develop over a period of days or weeks by the consolidation of stationary suspensions.
A range of techniques is now available which can be used to study the three-dimensional structure and behavior of those phenomena in the field.
MEASUREMENT TECHNIQUES
Many of the existing techniques used to study cohesive sediment phenomena have fundamental limitations. These are techniques involving bottle samplers and point reading optical turbidity sensors. These devices are extremely slow and laborious to use, only sample a small part of the water column, and commonly do not sample the critical 0.5–1.0 m zone immediately above the bed. The point readings of concentration at a few levels in the water column can only, in the absence of data in the intervening gaps, be joined by straight lines to produce smooth curves. Similarly, integrating bottle samplers or pump samplers which are traversed through the entire water column produce integrated, smooth, vertical concentration profiles. The same shaped profiles are produced by laboratory studies and mathematical simulations. Indeed it is the case that any discontinuous, integrating, or averaging sampling technique will produce smooth, vertical concen- tration profiles. Although such results may be adequate, and even appropriate for certain applications, they are inappropriate to the study of the processes of cohesive sediment erosion, transport, and deposition.
An alternative investigation philosophy is to apply appropriate techiques in sequence at three levels of detail. These are reconnaissance techniques, large-scale phenomenon techniques, and small-scale phenomenon techniques. (Arrays of velocity, turbidity and other parameter measuring techniques deployed from anchored platforms have been widely used and reported and thus are not considered further here.)
Reconnaissance Techniques
These techniques may be used to obtain synchronous data from large areas in a short time period, or to identify areas which can be homed onto for later and more detailed study.
Satellite images are especially useful in obtaining an instantaneous view of a large area at a particular moment in time. They show phenomena which may otherwise go unrecognized or may only be recognized following extensive and expensive ship time. Major limitations of satellite images are that they only reveal surface concentrations, whereas the most important phenomena are confined to near-bed layers and have no surface expression. Also, in high turbidity regions surface concentrations are commonly well beyond the range in which accurate estimations of turbidity levels, by color or tone slicings, can be made.
To make reconnaissance surveys of near-bed, high concentration, cohesive sediment layers, various acoustic devices have been used widely and provide much useful data. Echo sounders of various frequencies are used to locate and map the distribution and acoustic characteristics of stationary suspensions that have developed a sufficiently sharp gradient in acoustic impedence at their surface that return echoes can be detected. In addition to the limitation caused by detectability, the records are further limited by the fact that the
internal and surface reflectors have no absolute relation to density, time or any other non-acoustic property. Their results may therefore be misleading if injudisciously used. The results of applying satellite imagery to surface distributions or acoustic techniques to near-bed suspended sediment distributions are well known and not considered further here.
Large-scale Phenomenon Techniques
To study the three-dimensional anatomy of relatively low concentration, mobile suspensions in the horizontal and vertical planes, as well as the way in which this three-dimensional structure evolves through time, continuous underway measuring techniques are required. To facilitate these measurements, optical turbidity sensors calibrated to operate in the range 0–20 g 1−1, coupled with a pressure sensor to provide the depth component, are required. Over the concentration ranges commonly encountered it is frequently necessary to employ two optical turbidity meters on different sensitivity settings alongside the depth sensor. Conductivity and temperature sensors, each with a continuous output, are commonly operated in unison with the turbidity/depth array to provide supporting data. An example of such an array is shown in Figure 3. The outputs of the instruments are recorded onto various types of analog recorders, or stored and manipulated by computers.
With such devices it is possible to make rapid (6 to 8 knots), horizontal traverses of the turbidity maximum of an estuary. Generally such devices are used to make repeated traverses across complete cross sections of an estuary to reveal the structure of the suspensions.
Repeated lateral traversing may be accompanied by the vessel heaving-to at regular intervals to undertake rapid and continuous vertical profiles of the entire concentration field, from surface to bed. By free-falling the device, a complete profile in 30 m of water can be measured in 30 seconds or less. Such profiles are highly accurate and as near to being “instantaneous concentration profiles” as it is possible to achieve. The most important aspects are that the entire profile is recorded with no gaps, and that the array can reach to within a few centimeters of the bed.
By building up sequential arrays of horizontal profiles, with intervening vertical profiles, the two-dimensional structure of the turbidity maximum at a cross section over the semidiurnal cycle can be recorded. The number of passes across the section depends upon its size, but even in a large estuary hourly transits can be achieved. By visiting adjacent cross sections at comparable states in the semilunar cycle on different dates a quasi-synchronous three-dimensional description of the entire turbidity maximum can eventually be compiled. By undertaking repeated 12–1/2 hour surveys of the estuary at different energy levels (for example, spring-intermediate-neap tides, or storm-intermediate-calm or flood-intermediate-low river discharge) the changes to the three-dimensional structure of the turbidity maximum across the complete spectrum of energies to which the
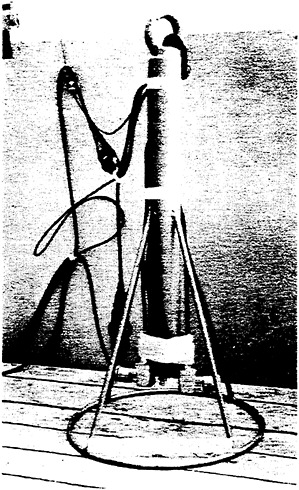
FIGURE 3 Instrument array used for making continuous horizontal and vertical traverses in relatively low concentration (0.1–20.0 g/liter−1) mobile suspensions.
estuary is subjected is revealed. This method has been applied to the Severn estuary. In this case the range of tidal energies encountered was so large that the 12–1/2 hour surveys at many standard cross sections were repeated at 0.5 m increments of tidal range and on the ascending energy (neap to spring) and descending energy (spring to neap) stages (24 stages). Although the data coverage achieved is incomplete, enough data has been obtained to document the semidiurnal waxing and waning of the regional turbidity maximum at several stages of the spring-neap cycle. The expense incurred in collecting this large data set is justified by the increased knowledge of the processes controlling cohesive sediment behavior, and by the new scientific phenomena that have been recognized.
The concentrations of dense stationary suspensions are outside the calibration range of optical systems, and combinations of gamma backscatter or gamma transmission gauges, together with pressure sensors, must be used (Figure 4). Continuous vertical profiles of density versus depth are measured in a similar fashion to the technique developed for optical turbidity meters. In this case only the low few meters of the water column need be traversed and the array is profiled
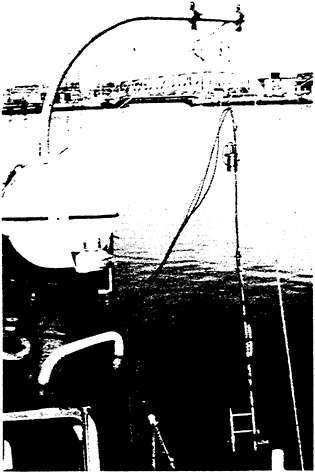
FIGURE 4 Instrument array used for high-resolution vertical profiling of dense stationary suspensions. Mounting of depth sensor at top of array prevents it becoming immersed in suspension.
more slowly. Following earlier work (Kirby and Parker, 1974) backscatter gauges have been used by a number of organizations for applied studies related to dredging efficiency and navigability. These organizations chose the backscatter gauge partly because it is easier to deploy and partly because the gauge initially developed had a faster response time than the transmission gauge (Parker et al., 1975). However, the backscatter gauge is intrinsically less suitable for process studies and surveys of the structure of stationary suspensions because it has a poor spatial resolution, and integrates the density readings over a spheroidal volume, ~30 to 40 cm diameter. In effect, although traversed continuously, this produces an integrated, smoothed profile. In contrast, the transmission gauge has a spatial resolution of ~2 cm.
Recently a high-speed transmission gauge has been developed that is capable of both vertical profiling and also towed undulating surveys, providing a continuous density and depth output (De Vlieger, 1986). This equipment permits the horizontal and vertical structure of stationary suspensions to be measured simultaneously with echo sounding surveys (Figure 5).
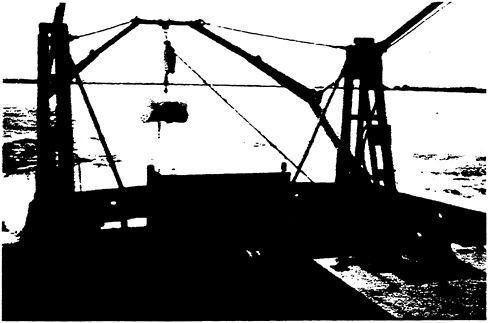
FIGURE 5 Navitracker instrument array used for vertical profiling and undulating towed density surveys.
RESULTS OF STUDIES OF LARGE-SCALE PHENOMENA
The most important feature of continuous monitoring is that, unlike discontinuous sampling, integrating, or averaging techniques, which appear to show smooth transitions in sediment concentrations, the real-time suspension structures are typified by discontinuous distributions in both the vertical and horizontal planes.
In the Severn and Rhine estuaries significant proportions (~60 percent in the Severn and ~30 percent in the Rhine) of the continuous vertical profiles are characterized by one or more major discontinuities, giving the profile a stepped or layered appearance. The layers, shown in Figure 6, are sufficiently universal, and at times persistent, that they have been termed “lutoclines” (Kirby and Parker, 1983).
In the Rhine, a three-ship exercise was mounted in which two vessels were anchored in the channel cross section to undertake current meter measurements. The third vessel steamed repeatedly to and fro across the same section carrying out vertical profiles at five positions. The suspended solids concentrations in this low-energy system are almost invariably low (0.02–0.04 g 1−1), and a mechanism for the generation of the fluid mud layers, which gave rise to the dredging requirement, was not readily apparent. The three-ship experiment fortuitously coincided with a northwest gale in the North Sea, and over a period of several hours on the late ebb/early flood tide the vertical profiles from the deepest channel station located a dense (>40 1−1) layer which grew to 1.75 m deep at maximum, with a sharp interface to the overlying water mass. Current meters on the adjacent
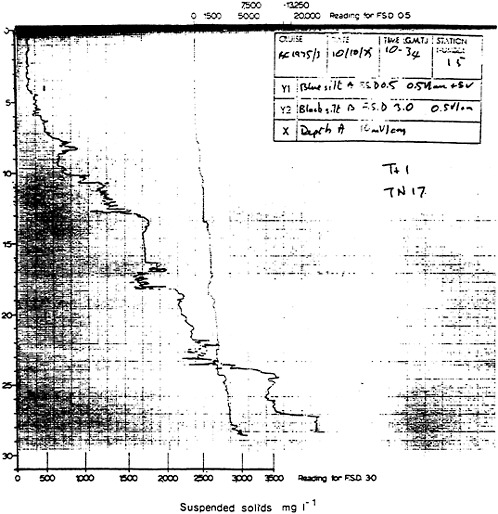
FIGURE 6 Continuous vertical profile of suspended solids concentration versus depth in mobile suspension phase showing a typical layered profile in the Severn estuary.
anchored vessel showed that this layer was flowing up-estuary into the tidal basins with a velocity of 0.2–0.3 m s−1 (Figure 7). The dense layer was moving inshore in the saline wedge some 15 m below and unrelated to the halocline. It is believed to be storms which provide the energy to erode and entrain the sediment from the bed of the North Sea itself. The suspensions generated remain fully mixed until they enter the shelter of the Rhine estuary, where turbulence levels progressively decline and the suspensions begin to settle and differentiate, while still moving up into the estuary. It was because the
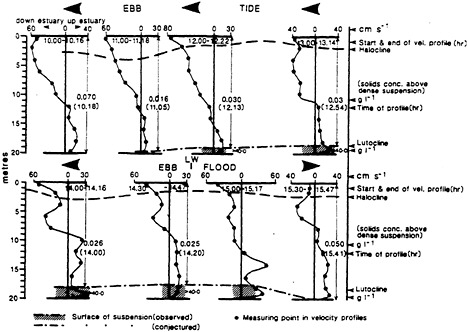
FIGURE 7 Continuous vertical profile and velocity data from experimental site in Rhine estuary showing transport of dense (>40.0 g/liter−1) near-bed layer with sharp interface to low concentration water column (~0.02 g/liter−1) above. Note velocity excess of the near-bed layer and that near-bed current flows up-estuary for whole 12–1/2 hour experiment.
the suspensions only move as a dense layer near the bed, which conventional point-sampling techniques had failed to detect, and in this case only arrive during storms when surveys are not normally carried out, that the mechanism for their introduction had previously gone undetected. Stationary suspensions with initial concentrations of 1.15 t/m3 and volumes of up to 600,000 m3 are introduced during storm events.
One advantage of working in the Severn is that, unlike the Rhine and most other areas, the high- and low-energy events are predictable and closely spaced, being the semidiurnal and semilunar cycles themselves. The relationship between energy and cohesive sediment response is comparable to that in the Rhine, however. On spring tides at the maximum ebb and flood velocities in the Severn, cohesive sediment is entrained from stationary suspensions, with a uniform bed-to-surface concentration. As velocity decreases toward low or high water, settling commences high in the water column and one or more steps may be generated. The steps continue to settle rapidly toward the bed across the slack-water period, and are redispersed during the following spring ebb or flood tides. A layer may remain discrete and identifiable for a few hours.
As the total energy in the system declines on the semilunar time scale, turbulence levels become insufficient to fully mix the suspensions on every tide, and, once established, the lutoclines remain discrete and identifiable for periods of several days. The layers merely rise and subside in response to the turbulent fluctuations of the semidiurnal cycle. Eventually, toward neap tides, the layers subside toward the bed, creating dense layers several meters deep, which become progressively more sluggish in their movement. At neap tides these dense layers eventually stagnate in the major approach channels and lock entrances, where a small proportion may consolidate and contribute to the dredging need. The remainder is re-entrained on the subsequent ascending semilunar cycle.
The evolutionary sequence of instantaneous concentration profiles that occur may be generalized into a conceptual model of cohesive sediment response to energy inputs (Figure 8) (Kirby and Parker, 1983). The conceptual model relates equally to the Severn and the Rhine. It is notable that smooth exponential profiles are not among the range of instantaneous profiles that naturally occur in turbid coastal regions.
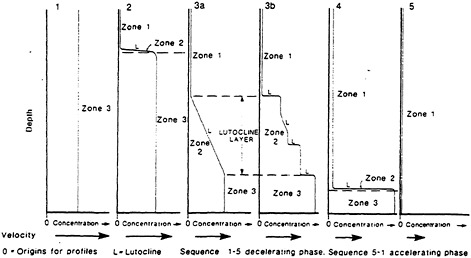
FIGURE 8 Conceptual model of evolution of layered suspensions and their relationship to total energy. Model fits both Severn and Rhine estuaries evolutionary sequences.
In addition to the almost universal presence and importance of vertical discontinuities, the continuous regional monitoring of the structure of mobile suspensions reveals the frequent presence of major discontinuities in the horizontal direction. Such discontinuities are of two types. One type are those regularly created due to the nonuniform rate of vertical mixing up from the bed on semidiurnal time scales. Vertical mixing on a semidiurnal spring tide results in
suspended sediment reaching the water surface preferentially along favored stream lines. A horizontal traverse across the stream lines at such a stage reveals a series of turbulent and high-concentration “suspension streets,” with sharp boundaries bordering unmixed areas (Figure 9). The streets expand laterally until they coalesce toward the end of the entrainment phase. A second more permanent and in some ways more significant feature, is the presence in the Severn estuary of an axially located, suspended solids front. The front is unrelated to any salinity or temperature structure in the estuary, and its position fluctuates cyclically by a small amount on both the semidiurnal and semilunar cycles. The front, shown in Figure 10, separates the high turbidity water mass on the English side from the lower turbidity water on the Welsh side (Kirby and Parker, 1982).
The presence and nature of the lateral discontinuities is also of extreme importance in understanding the processes of cohesive sediment transport. In the case of the Rhine, dense mobile suspension was only detected at one of the five profiling stations in the cross section. Frequently, there is no surface expression of such dense underflows; they do not necessarily flow in the axis of deep channels and they can remain undetected as the result of positioning errors of only a few meters.
Inasmuch as dense mobile suspensions evolve into dense stationary suspensions, it would be anticipated that similar types of internal structure would occur in the mobile and stationary phases. Dense stationary suspensions are generally located by acoustic techniques and often occupy relatively limited zones within estuaries. In the Severn the stationary suspensions form from dense mobile suspensions in the frontal region at the main channel axis. Consequently, they tend to develop chiefly on the side slopes and channel floor on the English side of the main channel. They are less common on the Welsh side of the channel.
Vertical profiles undertaken with the transmission gauge show stationary suspensions frequently to comprise series of discrete layers of progressively increasing density toward the bed (Figure 11). Many interfaces detected with the transmission gauge are not resolved by the echo sounder, as expected.
There is insufficient evidence to prove whether stationary suspensions arrive with density interfaces already established, whether they result from sequential deposition of stationary layers, whether the interfaces develop from homogeneous suspension during consolidation, or whether all three may occur. Layered stationary suspensions are common in estuaries with high cohesive sediment deposition rates.
SIGNIFICANCE OF TECHNIQUES AND PROCESSES
It is important to recognize the differences between the behavior of conservative components, such as temperature and salinity, and nonconservative components, such as silt. While the Severn is well mixed with respect to salinity and temperature, it is at times highly stratified and laterally partitioned with respect to the suspended solids
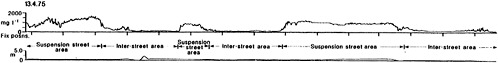
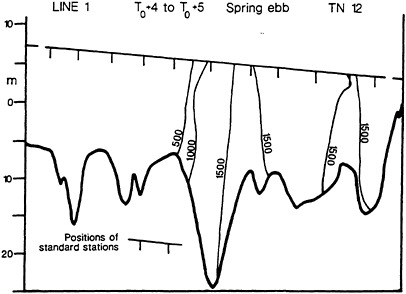
FIGURE 10 Structure of turbidity maximum along one cross section of Severn estuary compiled from single traverse in which continuous horizontal and continuous vertical profiles at indicated standard stations were obtained. Output was compiled from concentration measurements at ten percentiles of depth. Water surface slope arises from change in tide height during traverse. The suspended solids front is well displayed.
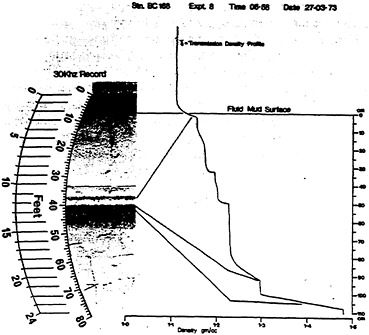
FIGURE 11 Continuous vertical profile of density versus depth in stationary suspension obtained with transmission gauge. The suspension has layered structure in which some discontinuities are not detected on the accompanying echo sounder record.
field. Amid all the complexities of fine sedo,emt bejavopr. we should recognize as a positive feature the similar behavior of suspended sediment in two such contrasted estuaries as the Severn and Rhine.
The continuous measuring techniques described show that many mobile and stationary suspension phenomena are discontinuously distributed in the natural environment. They provide the first complete description of the evolutionary sequence of suspension structures from the time of entrainment, through the various stages of transport, until final deposition. They show why it is inevitable that in all areas experiencing rapid, fine sediment deposition and having a high maintenance dredging requirement, deposition can only arise in the presence of stationary suspensions, which can themselves only have evolved from dense, near-bed mobile suspensions.
Near-bed mobile suspensions may be difficult or impossible to recognize with conventional equipment, owing to the relatively narrow zone close to the bed they occupy. Examples from the Rhine, where a thousandfold difference may occur between the upper 97 percent and the lower 3 percent of the water column, indicate the importance of locating these layers. Similarly, several mechanisms operate to restrict the lateral spread of entrained material. The resulting dense near-bed layers, which eventually develop down the transport path, may equally occupy only a restricted part of the cross section, not invariably in the deepest water.
It should be clear that the techniques adopted to reduce sediment deposition may differ depending upon whether deposition occurs by vertical settling from the overlying water column at slack water, or is due to emplacement from a moving near-bed layer. At the present time techniques for reducing costs of dredging cohesive deposition areas are concentrated on minimizing the consequences once the suspension has been arrested. These techniques include improving dredging efficiency and defining the navigability of fluid mud channels by meaningful criteria, not possible using conventional lead line and echo sounder measurements. Considerable progress has been made (Kirby, Parker, and van Oostrum, 1980; De Vlieger, 1986). In the future, progress toward further cost reductions may be made by different approaches, such as restricting the penetration of dense layers by diverting them and by alternative dredging procedures.
Several of the phenomena reported have only been recognized recently, due to the use of the techniques discussed herein, and are not taken into account in current physical and mathematical models of cohesive sediment behavior. Recognition of their existence will, at least, assist in explaining any shortfall in the performance of various simulations. Certain of the processes involved, such as the concentration dependence of erodibility and the hysteresis effects in suspensions, are especially intractable in terms of parameterisation in models. There is an urgent need not only for high caliber field studies, but also for a closer link of field and model studies. Some outstanding problems will only be solved in the field, while only models will rationalize others.
REFERENCES
Inglis, C.C. and F.H.Allen. 1957. The regimen of the Thames Estuary as affected by currents, salinities and river flow. Proc. Inst. Civ. Eng., London. Pp. 27–868.
Kirby, R. and W.R.Parker. 1974. Seabed density measurements related to echo sounder records. Dock and Harbor Auth. LV(641):423–424.
Kirby, R., W.R.Parker, and W.H.A.van Oostrum. 1980. Definition of the seabed in navigation routes through mud areas. Internat. Hydrograph. Rev. LVII(1):107–117.
Kirby, R. and W.R.Parker. 1982. A suspended sediment front in the Severn Estuary. Nature 295(5848):396–399.
Kirby, R. and W.R.Parker. 1983. The distribution and behavior of fine sediment in the Severn Estuary and Inner Bristol Channel. Can. J. Fish. Aquat. Sci. 40(1):83–95.
Parker, W.R., G.C.Sills, and R.E.A.Paske. 1976. In situ nuclear density measurement in dredging practice and control. First International Conference on Dredging Technology. Canterbury, BHRA, Cranfield. Pp. 25–41.
De Vlieger, H. 1986. Navitracker—a new system for continuous underway in situ density surveys. Dredging and Port Constr. XIII(3):32–35.
NUMERICAL MODELING OF ESTUARINE HYDRODYNAMICS AND DISPERSION OF COHESIVE SEDIMENTS
Y.Peter Sheng
Coastal and Oceanographic Engineering Department
University of Florida
The United States spends a tremendous amount of money on maintenance dredging of navigation channels as a result of sedimentation in estuaries. There is an urgent need for a comprehensive quantitative understanding of all phases (source, transport, sink) of sediment dispersion in estuaries. Fine-grained sediments in estuaries are generally cohesive because of physicochemical and/or biochemical bonding forces among sediment particles. Distribution of cohesive sediments in estuaries is affected by a variety of hydrodynamic processes and generally exhibits significant spatial and temporal variations. After entering into an estuary from rivers, bottoms, or surface/subsurface dredged material disposal, suspended sediments may be transported to other parts of the water body by advection (due to currents driven by tides, winds, and density gradients), turbulent mixing, and gravitational settling. In the meantime, sediment distribution may undergo significant changes due to flocculation. In addition, varying hydrodynamic conditions may cause sediments to be eroded from and deposited onto the bottom, thereby affecting the concentration and composition of suspended and bottom sediments.
Hence, in order to predict sediment dispersion in an estuary, it is essential to first develop and verify quantitative models of individual processes. Ideally, a comprehensive sediment dispersion model should include the following: (1) three-dimensional (mean and turbulent) current model, (2) bottom boundary layer model, (3) wave models, (4) sediment erosion model, (5) sediment deposition model, and (6) sediment flocculation/settling model. This paper will briefly review most of these models. A recent paper by Sheng (1986a) discusses some bottom boundary layer models and sediment models in greater detail.
THREE-DIMENSIONAL HYDRODYNAMIC MODEL
Various estuarine hydrodynamic models can be classified according to the following important physical features:
-
spatial dimension—zero-, one-, two-, and three-dimensional,
-
temporal resolution—steady state, time dependent, residual,
-
air-sea interface—rigid lid, free surface,
-
scale of interest—global, limited area, large scale, boundary layer,
-
turbulence parameterization—eddy viscosity, two equation, Reynolds stress,
-
forcing—wind-driven circulation, tidal circulation, density-driven circulation, wave-induced circulation.
According to the important numerical features, on the other hand, estuarine hydrodynamic models can be classified as follows:
-
numerical method—finite difference, finite element, spectral,
-
grid structure—uniform Cartesian grid, nonuniform Cartesian grid, curvilinear grid,
-
equations solved—primitive equations, Poisson equations,
-
time-differencing scheme—explicit, implicit, semi-implicit,
-
spatial-differencing scheme—upwind, second order, flux-corrected transport, particle-in-cell, etc.,
-
host computer—micro, mini, mainframe, and super computers.
Currents in estuaries are driven by tides, winds, and density gradients (associated with temperature, salinity, and sediment concentration) and are affected by varying topography and geometry. Consequently, estuarine currents are quite complex and generally three-dimensional, turbulent, and time dependent. Except for extremely shallow estuaries, there may exist significant variation of current, temperature, salinity, and suspended sediment concentration in the water column. In addition, intense vertical exchange of sediments, nutrients, and hazardous materials may take place between the relatively thin bottom boundary layers (associated with currents and waves) and the bottom sediments. Consequently, to quantitatively describe estuarine hydrodynamics and sediment dispersion, three-dimensional models must be used instead of two-dimensional vertically averaged models.
A number of three-dimensional, time-dependent, free-surface hydrodynamic models are suitable for estuarine applications (Sheng et al., 1978; Blumberg and Mellor, 1980; Heaps, 1980; Sheng and Butler, 1982; Sheng, 1986b). Although these models all solve for the three-dimensional Reynolds-averaged equations of motion, they may be significantly different in terms of turbulence parameterization, numerical method, grid structure, and solution algorithm.
While most three-dimensional models use empirically determined vertical eddy coefficients, some three-dimensional models use a simplified version of a second-order closure model of turbulent transport to parameterize the vertical turbulent mixing. This type of turbulence parameterization reduces the need of ad hoc parameter tuning and is more rigorous. A complete second-order closure model (Reynolds stress model) solves for the Reynolds-averaged dynamic equations for mean flow variables and all the second-order correlations. The simplified version of this model replaces the dynamic equations for the second-order correlations with algebraic equations. Recently, an
intermediate and particularly robust version of this model that retains the dynamics of turbulence with a dynamic equation for q2 (twice the turbulent kinetic energy) has been adapted into the three-dimensional model of Sheng (1986c). The simplified version of the second-order closure model allows reasonable prediction of the three-dimensional tidal currents and salinity intrusion in estuaries. For example, Figures 1 and 2 show the computed tidal currents and salinity distribution in Charlotte Harbor, Florida. The vertical salinity stratification agrees reasonably well with data.
To resolve complex topography in estuaries, σ stretching, a special form of boundary-fitted grid, has been used in the vertical direction of some three-dimensional models (Sheng et al., 1978; Blumberg and Mellor, 1980; Sheng and Butler, 1982). As shown in Figure 3, the σ stretching allows smooth representation of the bathymetry and same order of accuracy in shallow and deep waters. Traditionally, finite-difference models use Cartesian grids in the horizontal direction. More recently, Sheng (1986b) adapted the boundary-fitted grid (Figure 4) into a three-dimensional hydrodynamic model and solved the transformed equations of motion in terms of the contravariant velocity components (Figure 5). As an example, the tensor-invariant form of the vertically averaged equations of motion are
(1)
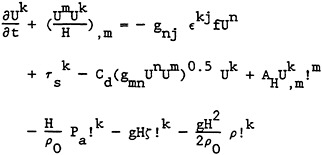
(2)
(3)
where ζ is surface elevation, U is vertically integrated velocity, T is vertically averaged temperature, superscript denotes contravariant vector component, subscript denotes covariant vector component, H is total depth, g0 is determinant of the metric tensor gij between the prototype grid xi and the transformed grid yi, i denotes a covariant spatial derivative, !m denotes a contravariant spatial derivative, ![]() is the permutation tensor, Cd is bottom friction coefficient, Pa is atmospheric pressure, ρ is density, τs is surface wind stress, qs and qb are heat fluxes at surface and bottom, and AH and KH are lateral turbulent eddy coefficients.
is the permutation tensor, Cd is bottom friction coefficient, Pa is atmospheric pressure, ρ is density, τs is surface wind stress, qs and qb are heat fluxes at surface and bottom, and AH and KH are lateral turbulent eddy coefficients.
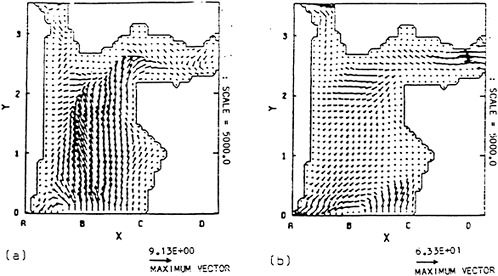
FIGURE 1 Computed three-dimensional velocity field (cm/sec) in Charlotte Harbor after 48 hours of model simulation with a 1/2 km grid: (a) near bottom, (b) near surface.
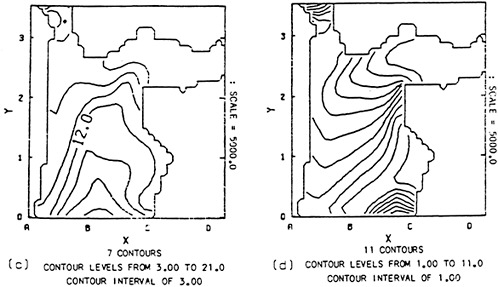
FIGURE 2 Computed salinity contours (ppt) in Charlotte Harbor after 48 hours of model simulation with a 1/2 km grid: (a) near bottom, (b) near surface.
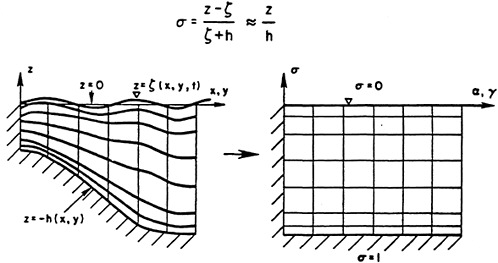

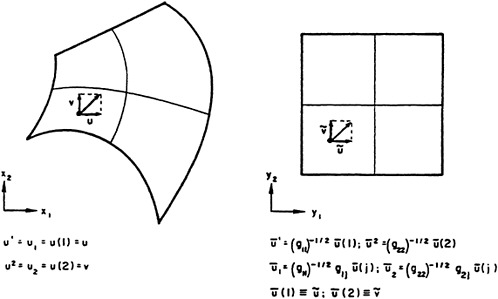
FIGURE 5 Contravariant, covariant, and physical components of a vector in the prototype and transformed systems.
Details of the three-dimensional transformed equations of motion and their solutions in terms of contravariant velocity components can be found in Sheng (in press). The three-dimensional boundary-fitted hydrodynamic model, like the finite-element model, is capable of resolving complex geometries. It is, however, more efficient than finite-element models because it only requires tridiagonal matrix inversions while finite-element models must deal with inversions of large band matrices. An example of a boundary-fitted grid for Suisun Bay, California, where significant bathymetry variation exists, is shown in Figure 6.
BOTTOM BOUNDARY LAYER MODELS
Bottom boundary layer dynamics play a predominant role in affecting both the erosion and deposition of sediments. When the free-stream velocity at some distance above the bottom and the bottom roughness is known, bottom boundary layer models are needed to estimate bottom shear stress and other mean and turbulent flow variables.
Current Boundary Layer Models
Within a fully developed turbulent boundary layer over a rough bottom and sufficiently above the individual roughness elements,
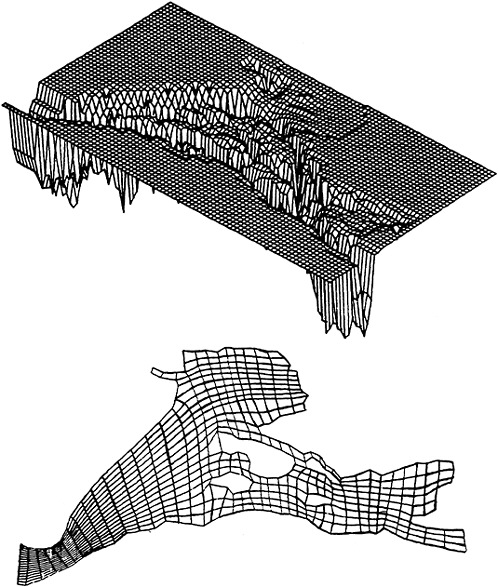
FIGURE 6 Three-dimensional view (top) and laterally boundary-fitted grid (bottom) of Suisun Bay, California.
turbulence is in equilibrium and the flow can be described by the following relationship (Businger et al., 1972):
(4)
where U is the mean velocity, U* is the friction velocity, k is the von Karman constant, zo is the roughness height, ![]() is a stability function and L is the Monin-Obukhov similarity length scale.
is a stability function and L is the Monin-Obukhov similarity length scale. ![]()
includes the effect of stable or unstable density stratification associated with gradients of temperature, salinity, and sediment concentration. Under neutral conditions, L=∞, ![]() and the velocity follows a simple logarithmic relationship. Within the logarithmic layer, the turbulent shear stress remains relatively constant.
and the velocity follows a simple logarithmic relationship. Within the logarithmic layer, the turbulent shear stress remains relatively constant.
In shallow estuarine waters where high frequency wind waves and/or sea swells may generate significant “orbital” currents near the bottom, the constant flux layer relationship as defined by Eq. 4 is still valid for sufficiently time-averaged currents, but is no longer valid for the instantaneous velocity field within any wave cycle. A more appropriate equation can be derived by considering the effect of body forces in the boundary layer equations (1). In case of significant topographical features over the bottom, profile drag must be considered in addition to the skin friction dra3 (Lewellen and Sheng, 1980; Sheng, 1982). Sheng (1982) developed a model for describing the flow within vegetation canopies.
Underneath the logarithmic layer, there exists a thin laminar sublayer with a thickness on the order of δ~10 υ/U* and a linear velocity profile. Although the sublayer is much thinner than the logarithmic layer, it is still quite thick compared to the average size of sediment particles or flocs, and hence must be considered in modeling the deposition and erosion of sediments.
Wave Boundary Layer Model
Wave boundary layer models can be classified into three categories: empirical, eddy viscosity, and second-order closure. Empirical models make use of purely empirical formulae to describe flow within the wave boundary layer based on measured free-stream velocities (Kalkanis, 1957). Most of the eddy viscosity models (Kajiura, 1968; Bakker, 1973; Brevik, 1981) follow approaches along the line of Kajiura who solved the one-dimensional, time-dependent, boundary layer equation using a three-layer eddy viscosity formulation. Trowbridge and Madsen (1984) modified Kajiura’s eddy viscosity formulae by using the instantaneous U* instead of the maximum U*. None of the eddy viscosity models, however, have demonstrated its ability to accurately simulate the turbulent shear stresses and the thickness of logarithmic layer within wave boundary layers.
Sheng (1983, 1984b, 1986a) used a second-order closure model of turbulent transport to simulate the wave boundary layer measured by Jonsson and Carlsen (1976) and reproduced their results rather well. Computed and measured mean velocity and Reynolds stresses over half of a wave cycle are shown in Figure 7. Thickness of the logarithmic layer, defined as the region within which the Reynolds stress varies by less than 1 percent from its wall value, can be explicitly computed from the model results. It is found to be much thinner (<3 cm) than Jonsson and Carlsen’s estimation (6 cm) and the fixed-wave boundary layer thickness assumed by Grant and Madsen’s (1979) current-wave boundary layer model. When sea swells propagate into a shallow estuary
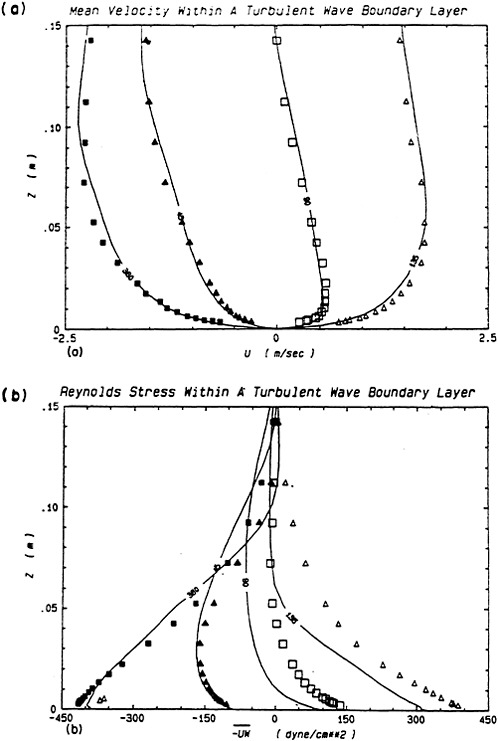
(Sheng, 1984b), the asymmetrical motion underneath a cnoidal wave tends to produce a thicker logarithmic layer during the “fast” half cycle, but produces a thinner one during the “slow” half cycle when compared to that under a nearly sinusoidal wave.
Based on wave parameters computed for the Mississippi Sound, Sheng (1983) computed the bottom orbital velocities and wave-induced bottom stresses at a number of locations during a five-day period, September 20–25, 1980. The generally southeasterly wind-generated wind waves with heights on the order of 0.3 m and wave period on the order of 3 sec. Due to the shallow water depths (between 1 and 4 m) within the Mississippi Sound, significant bottom stresses (>5 dynes/cm2) were generated at many locations. These bottom stresses were sufficient to cause erosion of sediments at many locations during the five-day period and led to significant temporal variation in the suspended sediment concentration, which agreed rather well with measured data (Sheng, 1986a).
Current-Wave Boundary Layer Model
The interaction of high-frequency wave orbital motion and low-frequency current within the bottom boundary layer has been studied experimentally. However, only the study by Kemp and Simons (1982) has provided detailed measurements of both mean and turbulent flow variables throughout the boundary layer, particularly near the bed. They reported convincingly that for combined wave and current tests, boundary layer thickness is changed and both the mean bottom shear stress and roughness length increase with the wave height.
Eddy viscosity models of current-wave boundary layer were postulated by Bakker and van Doorn (1978) and Grant and Madsen (1979). Grant and Madsen parameterized the current-wave interaction by using two different eddy viscosity formulations for the current boundary layer and the wave boundary layer, while assuming a fixed wave boundary layer thickness. On the other hand, Sheng (1983, 1984a) used a second-order closure model to simulate the current-wave boundary layer on the California shelf (90 m depth) and the Mississippi Sound (<4 m depth). Based on predicted bottom orbital velocity (Uw) of 20 cm/sec with a period (Tw) of 2.5 sec, near-bottom tidal currents on the order of 20 cm/sec, and a roughness length (zo) of 0.1 cm, the second-order closure model was used to compute flow within the bottom 10 cm of water. Based on comparison of time-averaged profiles of mean velocity, the combined current-wave case indicates a twofold increase in roughness length from the pure current case. The turbulent kinetic energy (q2/2) and Reynolds stress ![]() are increased due to the presence of waves. Near the bed, the increase amounts to more than 50 percent. Such changes will lead to enhanced erosion, deposition, and mixing of sediments within the bottom boundary layer, although breakup of settling particles may also occur. In addition, it will also result in increased dissipation for both the current and wave fields.
are increased due to the presence of waves. Near the bed, the increase amounts to more than 50 percent. Such changes will lead to enhanced erosion, deposition, and mixing of sediments within the bottom boundary layer, although breakup of settling particles may also occur. In addition, it will also result in increased dissipation for both the current and wave fields.
Effect of Sediment on Bottom Boundary Layer
Existing bottom boundary layer models discussed above generally do not include the effect of sediment on boundary layer dynamics. The sediment concentration may result in a stable or unstable density stratification, thus suppressing or enhancing turbulent mixing in the vertical direction in much the same fashion as a temperature stratification. Such an effect is accurately resolved by the second-order closure model without the need of any parameter tuning. In addition, the direct damping of turbulence due to the relative motion between sediment particles and turbulent eddy motion can be incorporated into the second-order closure model via a dissipation term in the turbulent kinetic energy equations. A recent study by Sheng (in preparation) indicated that in a laboratory flume, when bottom sediment concentration is on the order of 1 g/liter or more, the bottom stress can be reduced by 50 percent from the clear-water case.
The suspended sediment concentration near the bed may become exceedingly high (>5 kg/m3) and thus form a fluid mud system within which hindered settling is important and the flow behaves like a non-Newtonian one. The response of the fluid mud system can be modeled using a viscous model (MacPherson, 1980), a Bingham fluid model, or a visco-elastic model. The complete treatment of the bottom boundary layer requires the conjunctive use of one such model and a Newtonian bottom boundary layer model for the water column above the fluid mud system.
TRANSPORT, EROSION, AND DEPOSITION MODELS
Erosion and deposition of cohesive sediments are extremely complicated. In spite of numerous studies since the pioneering laboratory studies of Krone (1962) and Partheniades (1962), no general predictive models of erosion and deposition exist for cohesive sediments. This is due to the fact that (1) a laboratory sediment experiment does not necessarily represent the real world condition, and (2) it is difficult to measure all the important parameters required for developing erosion and deposition models. This is particularly true for erosion. Erosion takes place when the applied shear stress exceeds the resistance of the bed associated with interparticle or interfloc forces, which in turn depend on many physicochemical (e.g., water content, order of aggregate, salinity, sediment composition, and time history of bed) and biochemical (e.g., bacteria and macrofauna) parameters at the bed. Consequently, models of sediment: erosion are generally very empirical and site specific. Deposition, on the other hand, is more directly affected by the hydrodynamic processes and only weakly dependent on the bed properties, and hence is more amenable to rigorous model formulation.
Transport Model
The instantaneous sediment concentration in an estuary can be described by the following continuity and momentum equations for a particulate species:
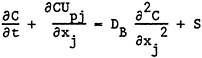
(5)
(6)
where C is the instantaneous sediment concentration, U1 represents the fluid velocity, Upi and Upj represent the particulate velocity, DB is the molecular diffusion coefficient, F1 represents body forces on the particles, τr is the relaxation time of particles, and S is a source term. If one performs ensemble averaging on Eqs. 5 and 6 and further assumes that all particles completely follow the turbulent eddy motion, the following equation is obtained:
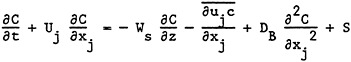
(7)
where C and c are the ensemble-averaged and fluctuating sediment concentration, respectively, Uj’s are the mean fluid velocities computed from a three-dimensional hydrodynamic model, Ws is the settling velocity of the sediment particles relative to the fluid. The net flux of sediments at the free surface and the bottom are
(8)
(9)
where η(x,y,t) is the free surface elevation, h(x,y) is the water depth, Vd is the deposition velocity, C+, is the concentration at some distance (e.g., the first grid point) above the bottom, and E is the rate of erosion.
The rate of deposition, VdC+, is directly proportional to the suspended sediment concentration above the bed. The rate of erosion, E, depends primarily on the applied shear stress and bed properties and is only weakly affected by the suspended sediment concentration through its effect on density stratification and applied shear stress.
Suspended sediment concentration computed by Eq. 7 can affect the density of the flow, which in turn can affect turbulence through buoyancy effect. Such sediment-flow interaction is explicitly accounted for in the sediment-laden flow model of Sheng and Villaret (in preparation), but is ignored in many other models.
Erosion Model
Due to the complexity of the erosion process, empiricism has been the rule of thumb in developing erosion models. A wide variety of devices have been used to study the erosion of cohesive sediments. In spite of the widely different devices and techniques, results of laboratory erosion studies have generally been presented in the following form (Sheng and Lick, 1979; Ariathurai and Arulanandan, 1978; Mehta and Partheniades, 1979; Owen, 1974):
(10)
where τb is the bottom shear stress, τc is the critical shear stress at which erosion of sediments is initiated, and M is the erosion rate constant having the dimension of an inverse velocity.
Previous laboratory studies have reported that τc, and M to a lesser extent, may vary with changes in the following parameters of the bed and overlying and pore water: water content, order of the bed aggregates (flocs), bed density, bed history, temperature, CEC (cation exchange capacity), SAR (sodium adsorption ratio), organic content, bacteria, and macrofauna, etc. However, it is extremely difficult to isolate the effects of these competing parameters in a laboratory experiment. Consequently, although we know the approximate range of M (10−6 to 2×10⁻⁵ sec/cm) and τc (0.2 to 20 dyne/cm2), there exists no predictive model for erosion of cohesive sediments. Recently Mehta et al. (1982) attempted to model a deposited bed in a laboratory flume by dividing it into the so-called newly deposited layers, partially consolidated layers, and fully consolidated layer. Within each of the partially consolidated layers, an exponential erosion relationship was proposed.
As an example, an erosion relationship determined from laboratory experiments for Mississippi Sound sediments (Sheng, 1983) is shown in Figure 8(a). The sediment composition at this site is smectite 68 percent; kaolinite, 21 percent; and illite, 11 percent. Salinity was found to significantly decrease the erodibility as shown in Figure 8(b); the rate of erosion for site 3 sediments decreased by more than an order of magnitude when the salinity increased from 0 to 30 ppt.
Most erosion studies have been performed in laboratory flumes. These laboratory experiments do not always simulate the turbulence spectrum, particle size distribution, and sediment composition in the field.
Further research is needed to determine the quantitative dependence of the rate of erosion on dominant parameters representative of real
world conditions. Previous erosion models have been developed without considering sediment-flow interaction. Sheng and Villaret (in preparation) recently studied the effects of sediment-flow interaction and deposition/settling on erosion relationships.
Deposition Model
The rate of deposition can be conveniently expressed as the product of a local concentration C and a deposition velocity, Vd, which is defined as the sediment flux at the bed divided by the suspended sediment concentration. Physically, Vd represents the velocity equivalent to the correlation between the turbulent fluctuations of the vertical velocity components and the fluctuations of the sediment concentration divided by the mean concentration. Since a concentration gradient is generally needed to deliver a sediment flux to the bed, Vd depends on all the hydrodynamic parameters governing the bottom boundary layer dynamics as well as such parameters as particle size distribution, flocculation, vegetation type and distribution, and biochemical property of the bed.
Deposition of sediment particles in estuaries is influenced by resistance of the various layers (outer boundary layer, constant flux layer, vegetation canopy, sublayer) through which the particles must pass to reach the bed. The total resistance to deposition, defined as the inverse of deposition velocity, is the sum of resistance in each layer:
(11)
where Rh represents the sum of resistance to turbulent transport in the water column, Rc represents resistance due to vegetation canopies, Rs represents resistance to the thin and relatively laminar sublayer next to the leaf surface of a vegetation canopy or a smooth bed, and Rb represents biochemical resistance encountered by sediment particles after reaching the bed.
Hydrodynamic Resistance
For simplicity, let us only consider the constant flux layer when deriving the hydrodynamic resistance Rh. Within this layer, a similarity relationship exists for the concentration field (Sheng, 1986a). Integrating the similarity relationship between zoc and z, while recognizing the definition of Vd as −wco/C(z), we can obtain the following relation:
(12)
where B is a constant (~0.75) and expressions for ![]() can be found in Sheng, 1986a.
can be found in Sheng, 1986a.
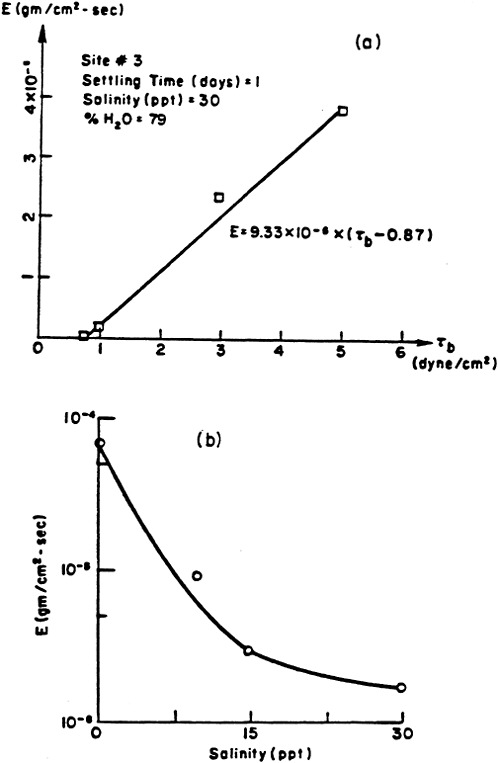
Eq. 12 can be further combined with the logarithmic velocity profile to obtain an expression for RhU since usually the velocity at some height, U(z), is known instead of U*. The results are plotted in Figure 9 for 3 heights (z=1 cm, 10 cm, 100 cm) and 3 roughness heights (zoc=0.01 cm, 0.1 cm, 1 cm) covering the unstable range (L<o), the neutral case (L>o), and the stable range.
Sublayer Resistance
The deposition of sediment particles depends primarily on the particle diameter and particle density. The effects of particle density can be incorporated into the particle size by increasing the equivalent particle size. Particles with a radius less than 80 µm tend to follow all turbulent eddies and hence can be diffused in the same manner as dissolved species, except within the laminar sublayer next to a leaf surface or a flat bottom.
Transport of particles within the sublayer is determined by three main contributions: Brownian motion, gravitational settling, and inertia impaction. To derive the deposition velocity in the sublayer, Eqs. 5 and 6 can be utilized without assuming that the particles completely follow the turbulent eddy motion. Assuming that the ensemble-averaged velocity and centration occur locally only as functions of the coordinate normal to the smooth surface, we can formally integrate the ensemble-averaged form of Eq. 6. After, further integration and utilizing the sublayer flux relationship (Lewellen and Sheng, 1980), we can obtain the following:
(13)
The deposition velocity formulae worked well, based on comparison with some data of particles deposited on the underside of a flat plate in the range where inertial impaction dominated some data for deposition of particles on a smooth surface. Some results for deposition velocity of sediments in the sublayer are shown in Figure 10 where Vd is plotted against particle diameter dp for various values of U. While depositing through the bottom boundary layer, the sediments may be continuously broken up into smaller aggregates (or flocs) due to the high shear near the bottom. Although the sediments may reach the sublayer rather quickly due to the generally low hydrodynamic resistance, a significant portion of the fine-grained sediments may remain trapped in the sublayer and not reach the bottom for a long time.
Canopy Resistance
In the presence of a vegetation canopy, the laminar sublayer over the wetted leaf surfaces will lead to increased deposition of sediments. A model of turbulent flow within a vegetation canopy was
developed (Lewellen and Sheng, 1980) wherein the skin friction drag Df (associated with the total wetted area Aw) and the profile drag Dp (associated with the frontal area Af) are distinguished. The deposition velocity due to the canopy was found to be equal to the sublayer deposition velocity multiplied by a canopy factor Fc (Sheng, 1986a). For relatively low but leafy vegetation with large total leaf surface area, the canopy-induced deposition velocity can be several times that of the sublayer deposition velocity over a flat bottom. For long- and cylinder-shaped canopies with few leaves, the canopy-induced deposition velocity is rather small compared to the sublayer deposition velocity of a flat bottom.
Erosion and Deposition of Sediments in the Mississippi Sound
An example is provided here to illustrate the effectiveness of tidal currents in redistributing the sediments in the Mississippi Sound. Tidal currents for the period between September 4 and September 5, 1980 are first computed. Initially, suspended sediment concentration of 500 mg/liter is assumed to exist within two 3-km2 areas, one in the middle of the Biloxi Channel and one in the middle of the Pascagoula Channel, and zero everywhere else. Sediment concentrations are then computed throughout a complete tidal cycle (24 hours), using four different types of bottom boundary conditions. Assuming all particles have a settling velocity of 0.05 cm/sec and follow the erosion relationship shown in Figure 8(a), the net thickness of deposited sediments at the end of the tidal cycle is shown in Figure 11. Significant erosion has taken place in all tidal inlets.
FLOCCULATION MODEL
Collision and cohesion among cohesive sediment particles lead to flocculation, i.e., larger flocs are formed from bonding among smaller particles. Cohesion among particles depends on mineral type and the physicochemical properties of the surrounding water. The primary parameters are (1) total salt concentration, (2) cation exchange capacity, which is an effective measure of the clay activity, (3) sodium adsorption ratio, which is proportional to the ratio of exchangeable sodium to calcium plus magnesium ions found in the diffuse layer of adsorbed ions near the clay surfaces, and (4) pH of the water.
The collision among particles can be significantly and directly affected by the turbulent motion in estuarine and coastal waters, in addition to the effect by Brownian motion. The sediment particle spectrum may interact with the environmental turbulence, which consists of the random motion of eddy structures ranging from the largest energy-containing scale (K) to the dissipation scale (go). The turbulence dissipation rate e=q3/K is preserved through this turbulent cascade. In addition to its effect on particle collision, turbulence can also modify the sediment particle spectrum by non-collisional processes such as fluctuation or turbulent mixing of the salinity distribution.
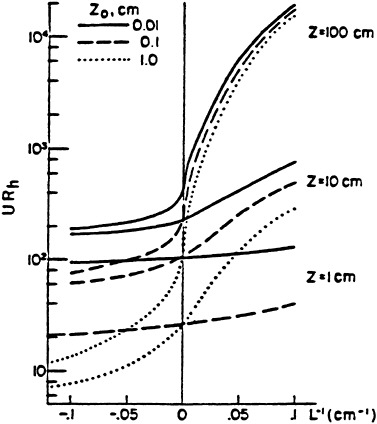
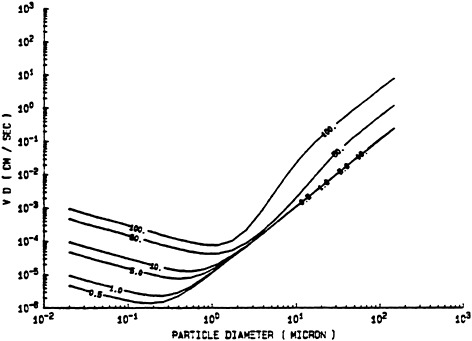
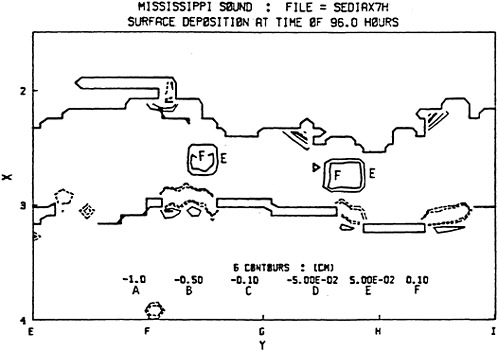
FIGURE 11 Net thickness of deposited sediments at the end of a tidal cycle in the Mississippi Sound, September 4–5, 1980. Deposition and erosion for all sediments.
Environmental Turbulence
Associated with the smallest eddies of scale ![]() there is a characteristic microtime
there is a characteristic microtime ![]() a characteristic microshear
a characteristic microshear ![]() and a characteristic acceleration
and a characteristic acceleration ![]() . The magnitudes of these quantities for the range of turbulence dissipation rates encountered in estuarine and coastal environments can be readily computed if q and Λ are known from measurements or modeling (Sheng, 1986a).
. The magnitudes of these quantities for the range of turbulence dissipation rates encountered in estuarine and coastal environments can be readily computed if q and Λ are known from measurements or modeling (Sheng, 1986a).
Interaction Between Sediment Particles and Turbulent Eddies
The particle size distribution of cohesive sediments is influenced by the turbulent eddy motion. The extent to which particles of a particular size interact with the turbulence spectrum depends on the magnitude of particle relaxation time τr, relative to the characteristic time τλ of various turbulent eddies. For simplicity, and due to the lack of comprehensive laboratory data, the relaxation times of various sized particles can be computed based on their terminal
TABLE 1 Critical Particle Radii at Various Dissipation Rates
|
|
0.001 |
0.01 |
0.1 |
1 |
10 |
|
rc (µm) |
822 |
474 |
260 |
150 |
82 |
settling speeds and assuming a particle density of 1.2 gm/cm3. Comparing the computed τr’s and the τλo for any given dissipation rate ![]() , one can determine a critical particle radius rc, such that particles with radius r<rc completely follow the motion of all turbulent eddies (τr≪τλo). As shown in Table 1, under normal estuarine and coastal conditions, sediment particles with radii less than 200 µm will completely follow the turbulent eddy motion. In such cases, the sediment particles will experience the ensemble mean shear
, one can determine a critical particle radius rc, such that particles with radius r<rc completely follow the motion of all turbulent eddies (τr≪τλo). As shown in Table 1, under normal estuarine and coastal conditions, sediment particles with radii less than 200 µm will completely follow the turbulent eddy motion. In such cases, the sediment particles will experience the ensemble mean shear  and ensemble mean rms acceleration ā. In the other extreme when τr≫τλ, the sediment particles are completely decoupled from all the turbulent eddies and do not experience any and ā in the absence of mean shear and acceleration. When τλo<τr<τλ, the motion of sediment particles is correlated with a portion of the turbulent cascade.
The total collision rate per unit volume between two groups of sediment particles with radius ri and rj, and number density nj can be expressed as:
(14)
where K is the collision kernel. Following Saffman and Turner (1956):
(15)
where K1, K2, and K3 are the contributions from turbulent shearing, turbulent acceleration, and differential settling, and e is the collision efficiency.
Evolution of Particle Size Distribution
In order to model the time evolution of the particle size distribution, it is necessary to compute and measure the turbulence in the flow field. In the meantime, sediment particles need to be conveniently divided into several groups, each with a mean radius and a median settling velocity. Conservation equations for the number density (n) and the mixing ratio (m) of each of these particle groups can be derived. In addition to advection by current and gravitational settling, transition rates among the various particle groups can be incorporated into these equations by utilizing the previously defined collision rates Nij with the appropriate collision kernels Kij and collision efficiencies eij.
For example, let us consider only two groups of sediment particles: a fine group with negligible settling speed, and a coarse group with appreciable settling speed. Taking the first two moments (the number density and mixing ratio moments) of the particle kinetic equation for each group, we can derive the following dynamic equations:
(16)
(17)
(18)
(19)
(20)
where m is the mixing ratio, n is the number density, subscript f refers to the fine particle groups and subscript c refers to the coarse particle group, Nff+Nfc represents the loss of fine particles due to self-collisions among fine particles, Nfc and Mfc represent the production of coarse number density and mixing ratio due to self-collisions among fine particles, Ncf and Mcf are the rate of loss of fine particle number density and the rate of production of coarse mixing ratio by collisions between coarse and fine particles. Ncc is the rate of loss of coarse number density by self-collision of coarse particle. All the Nij’s can be written in terms of the appropriate number densities, collision kernels and collision efficiencies as shown previously. Particle breakup due to strong turbulent shear may also be included into the above equations.
The above equations need to be ensemble-averaged and simplifying assumptions need to be introduced. Additional equations need to be introduced to describe the dynamics of second-order correlations between fluctuation velocity and fluctuation number density or fluctuation mixing ratio. Model constants need to be determined from well controlled laboratory experiments.
The modeling approach outlined above can be incorporated into the turbulent transport model described earlier. An alternative approach based on Monte Carlo simulation has been pursued by others (Pearson et al., 1984).
CONCLUSIONS
Several important aspects toward the formulation of a comprehensive sediment dispersion model have been discussed in this paper. The complexity of the overall problem dictates rigorous formulation of individual process models. A brief review was provided for the following process models: three-dimensional hydrodynamic model, bottom boundary layer model, erosion model, deposition model, and flocculation model.
Although continued research is needed to further improve the various process models, it is possible to utilize these existing models either individually or conjunctively for quantitative estimation of the dispersion of sediment in estuaries. When combined with well planned field/laboratory experiments, these models can be very useful for understanding and thus controlling sedimentation in navigation facilities.
ACKNOWLEDGMENTS
The work presented in this paper has been partially supported by the U.S. Army Corps of Engineers Waterways Experiment Station under contract DACW 39–80-C-0087 and the U.S. Geological Survey under contract 14–08–0001–21730.
REFERENCES
Ariathurai, R.O. and K.Arulanandan. 1978. Erosion of cohesive soils. J. Hydraul. Div. ASCE 104(HY4):411–416.
Bakker, W.T. 1973. Bottom friction and velocity distribution in an oscillatory flow. Rijkswaterstaat, Dir, Hydr. Res. and Water Management, Dept. Coast. Res. Memo 73–23.
Bakker, W.T. and Th.Van Doorn. 1978. Near bottom velocities in waves with a current. Proc. 16th Internat. Conf. on Coast. Eng.
Blumberg, A.F. and G.L.Mellor. 1980. A coastal ocean numerical model. Pp. 203–219 in Mathematical Modelling of Estuarine Physics, J.Sundermann and K.P.Holtz, eds. New York: Springer-Verlag.
Brevik, I. 1981. Oscillatory rough turbulent boundary layers. J. Waterways, Port, Coast, and Ocean Div. ASCE 107:175–188.
Businger, J.A., J.C.Wyngaard, Y.Izumi, and E.F.Bradley. 1972. Flux-profile relationships in the atmospheric surface layer. J. Atmos. Sci. 28:181–189.
Grant, W.D. and O.S.Madsen. 1979. Combined wave and current interaction with a rough bottom. J. Geophys. Res. 84:1797–1808.
Heaps, N.S. 1980. Spectral method for the numerical solution of the three-dimensional hydrodynamic equations for tides and surges. Pp. 75–88 in Mathematical Modelling of Estuarine Physics, J.Sundermann and K.P.Holz, eds. New York: Springer-Verlag.
Jonsson, I.G. and N.A.Carlsen. 1976. Experimental and theoretical investigations in an oscillatory rough turbulent boundary layer. J. Hydraul. Res. 14:45–60.
Kajiura, K. 1968. A model of the bottom boundary layer in water waves. Bull. Earthquake Res. Inst. 46:75–123.
Kalkanis G. 1957. Turbulent flow near an oscillatory wall. Univ. of California, Inst. of Energy Res., Ser. No. 72, Issue No. 3.
Kemp, P.H. and R.R.Simons. 1982. The interaction between waves and a turbulent current: Waves propagating with the current. J. Fluid Mech. 116:227–250.
Krone, R.B. 1962. Flume studies of the transport of sediment in estuarial shoaling processes. Contract Report, U.S. Army Corps of Engineers, San Francisco District.
Krone, R.B. 1976. Engineering interest in the benthic boundary layer. Pp. 143–146 in The Benthic Boundary Layer, I.N.McCave, ed. New York: Plenum Press.
Lewellen, W.S. and Y.P.Sheng. 1980. Modeling of dry deposition of SO2 and sulfate aerosols. Report EPRI EA-1452, Electric Power Research Institute, Palo Alto, Calif.
MacPherson, H. 1980. The attenuation of water waves over a non-rigid bed. J. Fluid Mech. 97(4):721–742.
Mehta, A.J., and E.Partheniades. 1979. Kaolinite resuspension properties. J. Hydraul. Div. ASCE 105(HY4):411–416.30.
Mehta, A.J., T.M.Parchure, J.G.Dixit, and R.Ariathurai. 1982. Resuspension potential of deposited cohesive sediment beds. Pp. 591–609 in Estuarine Comparisons, V.S.Kennedy, ed. New York: Academic Press.
Owen, M.W. 1974. Erosion and Avonmouth Mud. Hydraulic Research Station Report, Int. 78. 25 pp.
Partheniades, E. 1962. A Study of Erosion and Deposition of Cohesive Soils in Salt Water. Ph.D. Dissertation, University of California, Berkeley.
Pearson, H.J., I.A.Valioulis, and E.J.List. 1984. Monte Carlo Simulation of coagulation in discrete particle-size distributions. Part 1. Brownian motion and fluid shearing. J. Fluid Mech. 143:367–385.
Saffman, P.G. and J.S.Turner 1956. On the collision of drops in turbulent clouds. J. Fluid Mech. 1:16–30.
Sheng, Y.P. 1982. Hydraulic applications of a second-order closure model of turbulent transport. Pp. 106–119 in Applying Research to Hydraulic Practice, P.Smith, ed. New York: ASCE.
Sheng, Y.P. 1984. A turbulent transport model of coastal processes. Proc. 19th Internat. Conf. on Coastal Eng. ASCE, Houston, Tex. Pp. 2380–2396.
Sheng, Y.P. 1983. Mathematical modeling of three-dimensional coastal currents and sediment dispersion. Technical Report CERC-83–2. Vicksburg, Miss.: U.S. Army Engineer Waterways Experiment Station. Also A.R.A.P. Report No. 458, Princeton, N.J. 288 pp.
Sheng, Y.P. 1984a. Computation of current- and wave-induced erosional forcing within the Humboldt Bay. A.R.A.P. Tech. Memo #84–18, Princeton, N.J.
Sheng, Y.P. 1986b. Bottom boundary layer and cohesive sediment dynamics in estuarine and coastal waters. Pp. 360–400 in Estuarine Cohesive Sediment Dynamics, A.J.Mehta, ed. New York: Springer-Verlag.
Sheng, Y.P. 1986c. Numerical modeling of coastal and estuarine processes using boundary-fitted grids. Pp. 1426–1442 in River Sedimentation III, H.W.Shen et al., eds. University of Mississippi.
Sheng Y.P. 1986d. Second-order closure modeling of turbulent flow and sediment dispersion in coastal and estuarine waters. Pp. 1383–1396 in River Sedimentation III, H.W.Shen et al., eds. University of Mississippi.
Sheng, Y.P. In press. A three-dimensional hydrodynamic model of estuarine and coastal currents using generalized curvilinear grids. In Three-Dimensional Models of Marine and Estuarine Hydrodynamics. J.C.J.Nihoul, ed. New York: Elsevier.
Sheng, Y.P. In preparation. On the effect of suspended sediment Concentration on bottom boundary layer dynamics.
Sheng, Y.P. and H.L.Butler. 1982. Modeling coastal currents and sediment dispersion. Proc. 18th Internat. Conf. on Coast. Eng. ASCE. Capetown, South Africa. Pp. 1127–1148.
Sheng, Y.P. and W.Lick. 1979. The transport and resuspension of sediments in a shallow lake. J. Geophys. Res. 84:1809–1826.
Sheng, Y.P., W.Lick, R.T.Gedney, and F.G.Molls. 1978. Numerical computation of the three-dimensional circulation in Lake Erie. J. Phys. Oceanog. 8:713–727.
Sheng, Y.P. and C.Villaret. In preparation. On the determination of sediment erosion relationship.
Trowbridge, J. and O.S.Madsen. 1984. Turbulent wave boundary layers. J. Geophys. Res. 89:7089–8007.
MODELING ESTUARINE SEDIMENT TRANSPORT PROCESSES
William H.McAnally, Jr.
Hydraulics Laboratory
U.S. Army Engineer Waterways Experiment Station
This paper describes the methods used by the U.S. Army Corps of Engineers to model the transport, deposition, and erosion of sediments in estuaries. It shows how these methods can be applied to reduce maintenance dredging in estuaries.
The U.S. Army Corps of Engineers is responsible for design, construction, and maintenance of federal navigation channels in the United States. The Corps dredges over 250 million m3 of sediment per year in maintaining more than 30,000 km of waterways and about 1,000 harbor projects. About 60 percent of that volume,is dredged in the estuarine and coastal zone (ASCE, 1983).
The Corps uses a variety of techniques to predict navigation channel sedimentation, evaluate remedial measures before they are constructed, and evaluate sedimentation impacts of various activities. For small projects and rapid analyses, analytical methods are used (Corps of Engineers, 1984). For large projects, physical, numerical, and hybrid models are employed. This paper will concentrate on numerical and hybrid modeling of fine sediment processes.
Numerical sediment transport modeling employs computational techniques to solve mathematical expressions that describe the movement, deposition, and erosion of sediments. Hybrid modeling includes both numerical models and scale physical models in an integrated approach that uses each model for those tasks that it performs best (McAnally et al., 1984a). The hybrid method has been shown to be superior to either numerical or physical modeling alone (McAnally et al., 1984b).
The hydraulics laboratory of the Corps’ Waterways Experiment Station conducts applied research in inland and estuarine waterway hydraulics to support the Corps’ navigation responsibilities. As such, it serves as consultant to the Corps’ district and division offices, which are responsible for planning, design, construction, and operation of navigation projects. In that role, it develops analytical and numerical tools that can be used by the Corps in addressing hydraulics questions. The Waterways Experiment Station also performs hydraulics studies for other federal agencies, notably the U.S. Navy.
BASIC MODELING APPROACH
Numerical modeling is usually performed either at one of the Corps’ laboratories or at district offices in consultation with the labs. Physical modeling is usually performed at the Waterways Experiment Station. Some numerical models are intended for use only by the model developers and are not released to the Corps at large.
Two fundamental concepts govern use of numerical models by the Corps. Generalized numerical models are developed by the labs for use by Corps engineers who are expert in the physical processes, but not necessarily expert in computer use. The use of standardized models is encouraged so that reviewers do not need to research the model used for a study to note the model used and how it was applied. These two concepts lead to four practical consequences:
-
That the models must be well documented and generalized—i.e., applicable to a variety of situations.
-
That the models employ the systems approach with a collection of related programs to perform various modeling-related tasks.
-
That the approach be basically conservative, limiting revisions to those that have been thoroughly tested and avoiding frequent model revisions that would confuse users and reviewers.
-
That the models be written in modular form, so that when revisions are made, they appear as new options rather than as wholly new models that are inconsistent with previous applications.
NUMERICAL MODELS USED BY THE CORPS
One-dimensional Models
One-dimensional models are rarely used for estuarine sedimentation studies since the processes are strongly two- and three-dimensional. Exceptions are applications of the program HAD-1 to Atchafalaya Bay and the Mississippi River passes.
Two-dimensional Models
Two-dimensional models include the horizontal (depth integrated) SEDIMENT family and the vertical (breadth integrated) LAEMSED.
The SEDIMENT family of models consists of a series of daughter models to SEDIMENT2, developed by Ariathurai, MacArthur, and Krone (1977). The family has developed along two similar but distinct branches. A discussion of the various daughter models is given by McAnally, Thomas, and Ariathurai (1983). One of the Daughters, STUDH, is used extensively by the Corps as the sediment model in the TABS-2 system (Thomas and McAnally, 1985).
LAEMSED is a two-dimensional, breadth-averaged model based on LARM2 (Edinger and Buchak, 1983), a reservoir hydrodynamic model. Several
Corps models have been built on the basic LARM framework, including water quality models. Model LAEM is the estuarine hydrodynamics version of the code and LAEMSED has sediment transport capability added to it (Johnson, Trawle, and Kee, in press).
Three-dimensional Models
Two three-dimensional models have been developed for use by the Corps: SEDIMENT8 was developed under contract by Resource Management Associates (Ariathurai, 1982), and CELC3D was developed under contract by Aeronautical Research Associates of Princeton (Sheng, 1983). SEDIMENT8 is the offspring of the SEDIMENT family mentioned above.
Specialty Models
Specialty models are used for some problems that require out-of-the-ordinary treatment. One group of these are the dump models, which reproduce the disposal of dredged material in open water and assist in designing and managing open-water disposal sites. Multiple versions of these models are used to simulate various dumping operations and equipment (Trawle and Johnson, 1986). Though not covered here, these models have recently been applied to dredged material disposal in Puget Sound for the Navy.
Modeling Systems
The advent of production level numerical models has lead to development of modeling systems—collections of related computer programs that work together to generate the computational meshes, model the processes, and analyze and display the results. Prominent among these systems in the Corps are the TABS-2 system, which has been released to the public as well as the Corps, the Coastal and Inlet Processes (CIP) system, and the TABS-3 system, which is undergoing testing and revision prior to release. TABS-2 and CIP are two-dimensional systems and TABS-3 is a three-dimensional system. TABS-2 has been applied to more than two dozen projects in the last six years.
Hybrid Modeling
As mentioned above, integrated physical and numerical models used in a hybrid modeling approach take advantage of the strong points of each technique while avoiding its weaknesses. The hybrid technique for sedimentation studies was developed at the Waterways Experiment Station and first applied to the Columbia River estuary, Oregon. Results obtained there were superior to those produced by physical modeling alone. Model predictions of the increase in maintenance dredging after
construction of an enlarged navigation channel have been found to be extremely accurate in the first year following completion of the project.
CONCEPTUAL AND MATHEMATICAL MODELS
The two- and three-dimensional models solve the basic convection-diffusion equation for dispersive transport. In the two-dimensional models the equation is integrated over one of the spatial dimensions, and the resulting smearing of transport is accommodated in the diffusion terms. In both cases turbulent diffusion and dispersion due to spatial and temporal averaging are lumped into the dispersion terms that use effective diffusion coefficients analogous to Fickian diffusion.
The sink/source terms in the convection-diffusion equations serve as the means of exchanging sediment between the bed and flow. Calculating these terms represents a significant part of the difficulty in modeling.
Settling velocities appear in several of the equations. At present, settling velocities are specified by the user for all of the models. Values may change with time and space if the user chooses. Modifications underway will replace the specified settling velocities with values calculated from other parameters, such as concentration, salinity, and flow characteristics.
Bed modules in the two-dimensional models and in SEDIMENT8 are similar, based on Krone’s layering concept in which successive layers exhibit different bulk densities and resistance to erosion. At the user’s option, layers consolidate with overburden and with time, changing resistance to erosion as they consolidate. STUDH offers the option of mixing cohesive and noncohesive layers in the bed and calculating transport of each in turn.
It is noted that these numerical models, employing the latest computational techniques on some of the newest and most powerful computers available, are using mathematical models (the equations solved) that are 20- to 25-years old despite the availability of more recent, and presumed more rigorous, equations. The primary reason for this apparent discrepancy is that most of the modeling research effort of the last few years has gone toward making the models practical, i.e., providing computational efficiency, more realistic schematization, and ease of use, instead of more up-to-date equations in the physical descriptions used. This approach has been justified in the past by answers that appear to be quite good, at least in comparison to accuracy of the field data with which model results are compared. Now that the practicality of the two-dimensional models has been established and the models themselves are in the hands of end users, improvements to the physical descriptions are due and are underway.
Shear stresses for the sediment equations are calculated from the hydrodynamic results using various relationships between shear stresses and velocity squared. STUDH is most flexible in this regard, offering
several options, including Mannings, rough wall, and smooth wall forms. The models permit calculations of shear stresses due to combined currents and short period waves using equations adapted from those proposed by Bijker and by Jonsson (Thomas and McAnally, 1985).
HYDRODYNAMICS
Accurate computation of hydrodynamics is, of course, essential to accurate computation of sediment transport, but the hydrodynamic calculations are not covered here. STUDH, SEDIMENT8, and the dump models require that water levels and current velocities either be specified or computed by another model. RMA-2 (two-dimensional) and RMA-10 (three-dimensional) are used for that purpose. LAEMSED and CELC3D calculate hydrodynamics and sedimentation with the same computer code.
SOLUTION TECHNIQUES
A variety of solution techniques are employed by sediment models. STUDH and SEDIMENT8, as well as their hydrodynamic drivers, use a finite element solution technique. LAEMSED and CELC3D employ a finite difference solution. LAEMSED solves on a uniform rectilinear grid while CELC3D allows it to use boundary-fitted coordinate grids that approach the flexibility of finite element computational meshes in mapping complex geometries.
SEDIMENT8 transforms the vertical mesh into a rectangular computational domain, and the number of computational points in the vertical can vary gradually in space. It can also change to a two-dimensional depth-integrated solution over part of the mesh. RMA-10, the hydrodynamic model, can accommodate three-, two-, and one-dimensional computational cells in the same mesh. RMA-2 will accommodate both two- and one-dimensional cells. CELC3D also transforms the vertical grid into a rectangular domain, with the same number of cells in the vertical at all points.
MODEL APPLICATION EXAMPLES
Examples of model applications illustrate the use of the models in reducing maintenance dredging requirements.
Corpus Christi Harbor
LAEMSED and STUDH have been applied in combination to Corpus Christi Bay and harbor. The broad, shallow bay requires plan-form schematization to show the lateral and longitudinal variations in transport. A depth-integrated model, such as STUDH, can represent that situation well. The navigation channel and harbor exhibit significant
vertical variations in currents and sediment transport, which can best be modeled by LAEMSED. Funding and time constraints have not permitted a fully three-dimensional model application.
To properly account for the various needs of the Corpus Christi modeling effort, a LAEMSED model was constructed of the channel and harbor and a STUDH model was constructed for the bay. The LAEMSED model was used to examine measures that might diminish sediment-laden density currents into the harbor that contribute to sedimentation. STUDH was used to evaluate the role that open-water dredged material disposal plays in channel shoaling and to identify potential new disposal sites that could minimize return of disposed material to the channel.
Models have proven to be very useful in testing proposed remedial measures and identifying potential remedies not previously envisioned. This latter facility points out an important facet of model studies. The scope of work should be flexible enough to allow pursuit of ideas generated by the model results and not restrict testing to just those items planned in advance.
Kings Bay
The U.S. Navy’s TRIDENT submarine base at Kings Bay, Georgia is being constructed in a shallow, marshy estuary north of Jacksonville, Florida. Areas that were naturally less than 10 ft deep are being dredged to depths on the order of 50 ft to accommodate the Navy’s vessels. Under these circumstances, it is natural that heavy sedimentation is expected.
The Waterways Experiment Station has applied the TABS-2 numerical system (and the Coastal and Inlet Processes Modeling System) with a large physical model to Kings Bay in a hybrid modeling approach. Verification of STUDH to available field data showed it to be an excellent predictor for the pre-TRIDENT bay geometry. In fact, the model even predicted the location of the transition zone between sand clays making up the bed near Kings Bay before that location was identified from field data.
The models were next applied to predict shoaling in the completed navigation channel and facilities and to evaluate possible maintenance reductions measures. In 1986, shoaling in the partially completed facilities has been less than that predicted. Several possible reasons for the discrepancy have been suggested, including the following:
-
The winter of 1985–86 was drier than usual, reducing the inflowing sediment load to the system. Perhaps a wetter year will produce even greater shoaling than predicted.
-
One of the impacts of the deepened channels as shown in the models is an alteration of circulation in the system of bays and channels. Perhaps the partially-completed dredging has not yet led to that alteration, which will be realized only when construction is complete.
-
Formation of dense sediment suspensions that eventually may consolidate into shoals may be occurring but are not yet detected by acoustic fathometers.
-
Perhaps the great changes to the system caused by massive dredging has strained the model verification beyond the point at which results diverge from the prototype.
Data from the Kings Bay facility is still being analyzed to determine which explanation is appropriate. Plans being tested include sediment traps and installation of a tide gate to regulate the direction of flows through the facility. One series of tests involves evaluation of specialized dredging techniques. An analytic approach showed that agitation dredging or a jet array system could potentially be used to remedy localized shoaling problems. Numerical modeling tests will show the effect of resuspension by those methods on shoaling rates elsewhere in the facility.
Mississippi River
The Mississippi River estuary is being modeled by the Waterways Experiment Station using the TABS-3 modeling system (with SEDIMENT8) and TABS-2 (with STUDH) in a hybrid approach. Southwest Pass, a major distributary of the river, is the primary navigation channel route. About 20 million yd3/year are dredged from the channel. A two-phase hybrid modeling approach is being used to evaluate the reduction of maintenance dredging that will result from construction of training works and to predict requirements for a deepened channel (from 45 to 55 ft).
In the first phase, TABS-2 is being applied in concert with the physical model of the lower 30 miles of the estuary to analyze shoaling in the freshwater portion. The next phase will involve the physical model and SEDIMENT8 in analyzing the salt wedge portion of the estuary, where three-dimensional currents and transport must be reproduced.
RESEARCH NEEDS
To improve numerical and hybrid modeling of fine sediment transport, research is needed to provide a better description of the physical processes, to provide better input and verification data for the models, and to provide better solution techniques. As mentioned earlier, the Corps’ efforts have recently been concentrated, though not exclusively, in the latter area.
Work now underway (albeit slowly) will incorporate other mathematical descriptions of deposition, erosion, and consolidation into the models, as well as internal computations of settling velocities and diffusion. Other research is focusing on techniques to better measure near-bed flow velocities and sediment transport and to locate and define zones of fluid mud. This and other research will
make the Corps’ numerical, physical, and hybrid modeling tools even more useful in devising and evaluating remedies for navigation facility sedimentation.
CONCLUSIONS
Modeling of sedimentation processes by multidimensional numerical and hybrid modeling can be an effective tool in determining approaches to reduce navigation facility shoaling. In cases where the cost of dredging is high or expected to be high, or where remedial measures are expensive, modeling is advised. Localized problems (such as toe scour) may or may not be amenable to modeling solutions and must be evaluated on a case-by-case basis. Further improvements in modeling techniques, in the mathematical description of sedimentation processes, and in field measurement techniques can be expected to increase the utility of these tools.
It should be noted that models are rarely either right or wrong: they either lead the engineer to proper conclusions or to improper conclusions. Thus use of model results is as important as model results themselves. In this light, they may be compared to craftsmen’s tools, which can either be productively used or abused.
ACKNOWLEDGMENTS
Funding for development of the numerical modeling systems was provided by the research and development program of the U.S. Army Corps of Engineers, Office of the Chief of Engineers. The site-specific studies cited here were funded by the respective district offices of the Corps of Engineers. The Chief of Engineers granted permission to publish this paper.
REFERENCES
American Society of Civil Engineers. 1983. Shoaling processes in navigable waters. J. Waterway, Port, Coastal, and Ocean Engineering 109(2). Task Committee on Causes and Effects of Shoaling in Navigable Waters. New York: ASCE.
Ariathurai, R. 1982. Two and Three Dimensional Models for Sediment Transport. Lafayette, Calif.: Resource Management Associates.
Ariathurai, R., R.C.MacArthur, and R.B.Krone. 1977. Mathematical model of estuarial sediment transport. Technical Report D-77–12. Vicksburg, Miss.: U.S. Army Engineer Waterways Experiment Station.
Edinger, J.E. and E.M.Buchak. 1983. Development in LARM2: A longitudinal-vertical, time-varying hydrodynamic reservoir model. Technical Report E-83–1. Vicksburg, Miss.: U.S. Army Engineer Waterways Experiment Station.
Johnson, B.H., M.J.Trawle, and P.G.Kee. In press. A numerical model of the effects of channel deepening on shoaling and salinity intrusion in the Savannah estuary. Vicksburg, Miss.: U.S. Army Engineer Waterways Experiment Station.
King, I.P. 1982. A finite element model for three dimensional flow. Lafayette, Calif.: Resource Management Associates.
McAnally, W.H. Jr., W.A.Thomas, and R.Ariathurai. 1984. Multi-dimensional modeling of sediment transport. Proc. Conf. on Frontiers in Hydraul. Eng. New York: ASCE.
McAnally, W.H. Jr., J.V.Letter, Jr., J.P.Stewart, W.A.Thomas, and N.J.Brogdon, Jr. 1984a. Columbia River hybrid modeling system. J. Hydraul. Div. ASCE, March.
McAnally, W.H. Jr., J.V.Letter, Jr., J.P.Stewart, W.A.Thomas, and N.J.Brogdon, Jr. 1984b. Application of Columbia River hybrid modeling system. J. Hydraul. Div. ASCE, May.
Sheng, Y.P. 1983. Mathematical modeling of three-dimensional coastal currents and sediment dispersion: Model development and application. Technical Report CERC-83–2. Vicksburg, Miss.: U.S. Army Engineer Waterways Experiment Station.
Thomas, W.A. and W.H.McAnally, Jr. 1985. User’s manual for the generalized computer program system, open channel flow and sedimentation, TABS-2. IR HL-85–1. Vicksburg, Miss.: U.S. Army Engineer Waterways Experiment Station.
Trawle, M.J. and B.H.Johnson. 1986. Alcatraz disposal site investigation. MP HL-86–1. Vicksburg, Miss.: U.S. Army Engineer Waterways Experiment Station.
U.S. Army Corps of Engineers. 1984. Shoaling predictions in offshore navigation channels: Analytical and empirical methods. Engineer Technical Letter 1110–2–293. Washington, D.C.


