
4
Modifying Health Risk Behaviors1
Significant reductions in the burden of cancer are possible through changes in health behaviors. This chapter reviews current evidence of the effectiveness of interventions to promote three key behaviors in cancer prevention: nonsmoking, healthy diet, and physical activity. Although alcohol consumption was identified as a risk factor for cancer (Chapter 3), interventions to reduce alcohol consumption are not reviewed because of the cardiovascular health benefits associated with moderate consumption. The focus in this chapter is on changing individual behaviors through the provision of direct services (e.g., one-on-one counseling), contacts with health care providers or systems of care, and via community-based approaches such as worksite or school-based programs and public education media campaigns. Research on interventions to improve use of screening services is summarized in Chapter 6.
Interventions to modify behavioral risk factors can be implemented at several levels, for example, at the individual (e.g., group nutrition, exercise, or smoking cessation programs), interpersonal (e.g., advice and support from one’s physician for smoking cessation), organizational (e.g., worksite cafeteria menu changes, health care benefit policies, mass media programs),
|
1 |
This chapter is based on three background papers: (1) Interventions to Promote Key Behaviors in Cancer Prevention and Early Detection, by Edwin B. Fisher, Ross C. Brownson, Amy A. Eyler, Debra L. Haire-Joshu, and Mario Schootman; (2) The Effectiveness of Interventions to Assist in Weight Loss, by Suzanne Phelan and Rena Wing; and (3) Provider, System and Policy Strategies to Enhance the Delivery of Cancer Prevention and Control Activities in Primary Care, by Judy Ockene, Jane Zapka, Lori Pebert, Suzanne Brodney, and Stephanie Leman (www.iom.edu/ncpb). |
and societal level (e.g., tobacco control legislation, changes in standards for school nutrition programs) (Winett et al., 1989; McLeroy et al., 1988). These levels are not mutually exclusive, and reflect an evolution in prevention research from a primary focus on determinants of behavior within the individual to broader perspectives that encompass interpersonal, organizational, and community influences.
This chapter begins with a description of the many opportunities to deliver behavioral interventions, from clinical settings to public health programs. An overview is then provided of conceptual frameworks and intervention paradigms that underlie much of the reviewed behavioral research. Next, treatment-outcome research is summarized for tobacco cessation and prevention, physical activity, and diet (weight loss interventions and modification of eating patterns). Lastly, the challenges faced by health care providers in delivering effective interventions are reviewed.
THE DELIVERY OF BEHAVIORAL INTERVENTIONS
The delivery of health behaviorial interventions can take place in the context of a clinical setting or be more broadly applied to public health practice (Lichtenstein and Glasgow, 1992). Clinical programs include group and individual counseling offered through a variety of channels, including private, non-profit agencies, commercial programs, community organizations such as schools, health care centers, churches or other religious institutions, and worksites. The target population for clinical interventions is usually individuals who are motivated (or who can be motivated) to actively seek treatment. Interventions may be delivered by medical or allied health professionals or by non-medical professionals with specialty training. Behavioral interventions are often intensive, involving multiple sessions.
The target population for public health interventions is usually an unselected group of individuals or members of specific high-risk groups, regardless of their motivation to change their behavior. Interventions are delivered in natural settings, and the providers of interventions are not necessarily specialists. Public health interventions can include translating intensive behavioral programs into formats that can be delivered on a wide scale, such as self-help guides, computer-generated messages or reminders, and outreach telephone counseling. Advances in information technology have made it possible to create customized or tailored materials and to deliver them via the Internet. Also in the realm of public health interventions are large-scale efforts such as mass media programs (which can be paired with written self-help materials that are disseminated, for example, through community retail outlets) and legislative or regulatory approaches (e.g., excise taxes, school lunch policies).
Related to the clinical-public health continuum of intervention is the construct of “program impact.” The impact of an intervention is a product
of its reach into the target population (i.e., the proportion of individuals who access the intervention) and the effectiveness (or rate of behavior change) associated with the interventions offered (Abrams et al., 1995). Because of their greater intensity and personal contact, clinical interventions have higher rates of individual change relative to public health interventions. However, intensive clinical programs may actually have less impact because of their lower reach in to the population. Modest changes in a large segment of the population can result in meaningful reductions in cancer incidence and mortality.
Clearly, clinical and public health approaches are not mutually exclusive. The potential for cancer prevention through modification of health risk behaviors is optimized by a combination of the two approaches. In fact, strategies and interventions are needed on multiple levels to overcome barriers to the delivery of and access to cancer prevention and control interventions (Rimer et al., 2001). A general consensus has emerged that efforts to change social and behavioral risk factors are most successful if they link multiple levels of influence, for example, at the individual, interpersonal, institutional, community, and policy levels (Institute of Medicine, 2000b).
CONCEPTUAL FRAMEWORKS GUIDING BEHAVIORAL RESEARCH
Behavioral research is driven by theoretical models of the determinants of the target behavior. This section describes three models that guide assessments of behavioral interventions relating to tobacco use, diet, and physical activity: value expectancy theories, the social cognitive theory, and the transtheoretical or stages of change model.
Value Expectancy Theories
Value expectancy theories emphasize cognitive factors that are associated with motivation for behavior change. Motivation is viewed as a rational, decision-making process that results from an individual’s subjective value of an outcome and of the subjective probability or expectation that a particular behavior will attain the desired outcome. Two prominent value expectancy theories are the Health Belief Model (HBM) and the Theory of Reasoned Action (TRA).
Health Belief Model
First developed in the 1950s, the HBM has evolved into a psychosocial model that proposes three main determinants of motivation for health behavior change (Rosenstock, 1974):
-
perceived susceptibility to a disease or the subjective risks of contracting a serious illness;
-
perceived seriousness of an illness, in terms of both medical and lifestyle consequences; and
-
belief that particular behaviors will reduce the perceived threat, and that the associated benefits of those behaviors will outweigh the perceived costs and barriers.
Perceived susceptibility and severity are based largely on an individual’s knowledge of a disease and its potential outcome. The HBM also recognizes the potential importance of “cues to action” in starting the process of behavior change. These cues can be internal (e.g., physical symptoms that suggest disease risk or vulnerability such as “smoker’s cough”) or external (e.g., strong advice from a physician to quit smoking). More recently, the concept of self-efficacy, the belief in one’s capability to organize and execute the courses of action required to manage prospective situations, was added to the HBM (Janz and Becker, 1984). Self-efficacy can affect initiation of behavior, motivation to change behavior, and maintenance of behavior changes. The addition of self-efficacy into the model acknowledges the importance of individuals needing to believe they have the skills and abilities to implement the change.
Theory of Reasoned Action
The Theory of Reasoned Action (TRA) is another value expectancy theory that provides a mathematical description of the relationship among beliefs, attitudes, intention, and behavior (Fishbein and Ajzen, 1975). According to this model, behavioral intentions are the best single predictor of behavior. Behavioral intentions are influenced by two factors: the individual’s attitude towards the behavior (i.e., whether the person has positive or negative feelings about engaging in the behavior), and subjective norms regarding the behavior (i.e., the individual’s perception of the social pressures to engage or not engage in the behavior and one’s motivation to comply with these normative influences). Although both the HBM and TRA focus on attitudes and beliefs, the TRA goes beyond the focus of the HBM on assessment of risk to also include assessment of the social normative context. The TRA has been expanded and renamed the Theory of Planned Behavior to incorporate the self-efficacy concept.
There are potential limitations of exclusive use of value-expectancy models to guide intervention development and evaluation. First, these models assume a rational decision-making process, which is not always operative. Second, they focus primarily on health concerns as motivators. While necessary, health concerns may not be sufficient to motivate behavior
change. Finally, the emphasis of these models on cognitive factors needs to be augmented by models that take into account behavioral (e.g., skills) and environmental (e.g., situational determinants of behavior) components of the behavior change process.
Social Cognitive Theory
The cognitive-behavioral model on which most state-of-the art behavior change interventions are built has its conceptual roots in Social Cognitive Theory (SCT) (Bandura, 1989). This model extends the primarily cognitive focus of value expectancy theories and incorporates both behavioral and environmental components as equally important determinants of behavior. SCT highlights the influence of three factors: behavioral, cognitive, and environmental. Behavioral factors comprise an individual’s experiences with the target behavior (e.g., eating patterns, participation in preventive health care, prior attempts to quit smoking) and their general repertoire of behavioral skills (e.g., interpersonal skills, coping strategies, problem solving abilities). Cognitive factors include knowledge, attitudes and beliefs as outlined in the value-expectancy models plus more specific cognitive representations of situational factors relevant to the target behavior (e.g., the perception of high-fat meals as “comfort” food). Environmental factors refer to influences that are external to the person such as the actions of family members, physicians, and peer groups. Also included are more global environmental influences such as advertising and mass media, regulations and restrictions on behaviors (e.g., clean indoor air legislation), and availability of health-promoting alternatives (e.g., fruit and vegetable availability in supermarkets).
Central to social cognitive theory is the concept of reciprocal determinism to indicate that cognitive, behavioral, and environmental factors are continually interacting in an open system. An intervention could, for example, start by teaching new skills in preparing lower-fat foods (behavioral) which leads to more positive attitudes towards dietary modification (cognitive), which then results in changes in food purchases and the availability of healthy food in the home (environmental).
Social cognitive theory also introduced the concept of self-efficacy, described earlier.
Transtheoretical Model
The transtheoretical model is widely applied in studies of the determinants of behavioral risk factor modification as well as in randomized intervention trials in the areas of smoking cessation, dietary change, and physical activity (Velicer et al., 1999; Kristal et al., 2000a; Peterson and Aldana,
1999). The model describes five stages of change along a continuum of intentions and actions to modify behaviors (Prochaska and DiClemente, 1982):
-
precontemplation (not considering change in the near future);
-
contemplation (planning to change in the near future, but not taking any immediate actions);
-
preparation (taking early steps to change in the immediate future or having tried to change in the past);
-
action (made the target behavior change within the past six months); and
-
maintenance (maintained the target behavior change for more than six months).
The transtheoretical model, in addition to laying out these stages of change, describes processes that are hypothesized to result in movement through the stages of change (e.g., stimulus control, reinforcement management, social liberation). The model also assumes that the decision-making process is rational, where individuals weigh the pros and cons associated with the target behavior (Janis and Mann, 1977).
All of the models reviewed suggest that two fundamental processes must occur for successful adoption or modification of behaviors:
-
individuals must be sufficiently motivated to attempt to change their behavior, and
-
they must have the requisite skills and supports to initiate and maintain those changes.
A counseling technique called motivational interviewing facilitates these processes by providing Feedback, enhancing personal Responsibility, giving Advice along with a Menu of options, and supporting self-Efficacy by using the success of others as encouragement in a non-confrontational and Supportive context (Miller and Rollnick, 1991). A FRAMES acronym summarizes these components. Brief motivational interviewing can be applied during routine medical encounters (Rollnick, Heather and Bell, 1992).
Another strategy to bring about behavioral change is cognitive-behavioral skill-training. This approach is targeted to individuals who are actively working to change their behavior. Core components of skill-training interventions are listed in Box 4.1.
The theoretic models and intervention strategies described are often applied in the context of assessments of efforts to promote behaviors to reduce the burden of cancer.
|
BOX 4.1 Core Components of Skill-Training Interventions
|
TOBACCO CESSATION INTERVENTIONS
There is general agreement regarding the value of several approaches to smoking cessation (Task Force on Community Preventive Services, 2001; Hopkins et al., 2001a,b; US DHHS, 2000a; Fiore et al., 1996; US Preventive Services Task Force, 1996; http://www.cochrane.org/cochrane/revabstr/g160index.htm):
-
individual treatment including behavioral change procedures and medication;
-
advice to quit from physicians and other credible professionals;
-
programs implemented through community channels such as worksites, churches, and health care settings; and
-
broad, multicomponent, multichannel programs such as statewide programs to prevent smoking and encourage smoking cessation.
Smoking cessation has the advantage of a well-defined, single outcome measure (abstinence from tobacco) that lends itself well to outcomes assessment. A central conclusion from the literature on smoking cessation is that the more comprehensive and varied the treatment and the longer it is sustained, the more likely cessation will be achieved.

SOURCE: Centers for Disease Control and Prevention. Christy Turlington.
The 2000 Public Health Service Guideline presents the results of meta-analyses assessing the impact of various elements of treatments. As summarized in Table 4.1, increases in cessation rates and in the odds of quitting are parallel to increased amount of time and individualized personal contact. There is a similar trend when the data are disaggregated by the number of formats used.
These analyses demonstrate an important feature of smoking cessation: the number of different formats used in cessation interventions may be more important than the nature of the formats used. There is no one “magic bullet” in smoking cessation. Similar trends for increased rates of cessation are found for duration of contacts, duration of programs, and intervention providers. Compared to no treatment, even contact as brief as three minutes improves the odds of quitting smoking by as much as 20%. The greatest benefit (OR = 2.4) occurs for contacts above 10 minutes. Interventions that are sustained beyond 8 weeks increase the odds of quitting nearly threefold (OR = 2.7) compared to those that last less than two weeks. Receiving interventions from either nonphysician (OR = 1.7) or physician providers (OR = 2.2) improves quit rates over no treatment. Quit rates also increase with the number of clinician types involved in treatment
TABLE 4.1 Summary of Treating Tobacco Uses and Dependence (TTUD) Meta-Analysis Assessing the Impact of Various Elements of Treatment Structure
|
Structure variable |
Number of Study arms |
Estimated OR for abstinence (95% CI) |
Estimated abstinence rate (95% CI) |
|
Level of contact (43 studies) |
|||
|
No contact |
30 |
1.0 |
10.9 |
|
Minimal counseling (<3 min) |
19 |
1.3 (1.01, 1.6) |
13.4 (10.9–16.1) |
|
Low-intensity counseling (3–10 min) |
16 |
1.6 (1.2, 2.0) |
16.0 (12.8–19.2) |
|
Higher-intensity counseling (>10 min) |
55 |
2.3 (2.0, 2.7) |
22.1 (19.4–24.7) |
|
Total amount of contact time (35 studies) |
|||
|
None |
16 |
1.0 |
11.0 |
|
1–3 min |
12 |
1.4 (1.1, 1.8) |
14.4 (11.3, 17.5) |
|
4–30 min |
20 |
1.9 (1.5, 2.3) |
18.8 (15.6, 22.0) |
|
31–90 min |
16 |
3.0 (2.3, 3.8) |
26.5 (21.5, 31.4) |
|
91–300 min |
16 |
3.2 (2.3, 4.6) |
28.4 (21.3, 35.5) |
|
>300 min |
15 |
2.8 (2.0, 3.9) |
25.5 (19.2, 31.7) |
|
Number of person-to-person sessions (45 studies) |
|||
|
0–1 session |
43 |
1.0 |
12.4 |
|
2–3 sessions |
17 |
1.4 (1.1, 1.7) |
16.3 (13.7, 19.0) |
|
4–8 sessions |
23 |
1.9 (1.6, 2.2) |
20.9 (18.1, 23.6) |
|
>8 sessions |
51 |
2.3 (2.1, 3.0) |
24.7 (21.0, 28.4) |
|
Type of clinician (29 studies) |
|||
|
No clinician |
16 |
1.0 |
10.2 |
|
Self-help |
47 |
1.1 (0.9, 1.3) |
10.9 (9.1, 12.7) |
|
Non-physician |
39 |
1.7 (1.3, 2.1) |
15.8 (12.8, 18.8) |
|
Physician |
11 |
2.2 (1.5, 3.2) |
19.9 (13.7, 26.2) |
|
Number of clinician types (37 studies) |
|||
|
No clinician |
30 |
1.0 |
10.8 |
|
One type |
50 |
1.8 (1.5, 2.2) |
18.3 (15.4, 21.1) |
|
Two types |
16 |
2.5 (1.9, 3.4) |
23.6 (18.4, 28.7) |
|
Three or more types |
7 |
2.4 (2.1, 2.9) |
23.0 (20.0, 25.9) |
|
Format (58 studies) |
|||
|
No format |
20 |
1.0 |
10.8 |
|
Self-help |
93 |
1.2 (1.02, 1.3) |
12.3 (10.9, 13.6) |
|
Proactive telephone counseling |
26 |
1.2 (1.1, 1.4) |
13.1 (11.4, 14.8) |
|
Group counseling |
52 |
1.3 (1.1, 1.6) |
13.9 (11.6, 16.1) |
|
Individual counseling |
67 |
1.7 (1.4, 2.0) |
16.8 (14.7, 19.1) |
|
Number of formats (54 studies) |
|||
|
No format |
20 |
1.0 |
10.8 |
|
One format |
51 |
1.5 (1.2, 1.8) |
15.1 (12.8, 17.4) |
|
Two formats |
55 |
1.9 (1.6, 2.2) |
18.5 (15.8, 21.1) |
|
Three or four formats |
19 |
2.5 (2.1, 3.0) |
23.2 (19.9, 26.6) |
|
OR, odds ratio; CI, confidence interval. Odds ratios and abstinence rates refer to long-term (>5-month) follow-up. SOURCE: Adapted from US DHHS (2000a), Tables 12–18. Reprinted from Piasecki and Baker (2001) (www.tandf.co.uk/journals). |
|||
delivery. The consistency in findings across different intervention characteristics reflects the importance of intensity and duration of interventions.
The Effectiveness of Behavioral Interventions
Cognitive-behavioral treatment components can be delivered in a variety of formats, ranging from minimal counseling and advice from medical providers to intensive, inpatient clinical programs.
Self-Help Programs
A variety of self-help pamphlets, books, videotapes, and resources on the World Wide Web are available commercially and through volunteer agencies, including the American Lung Association, the American Heart Association, and the American Cancer Society. In a review of 24 studies that used randomization in the research design, Curry (1993) found that self-help methods achieved long-term results comparable to those achieved by intensive interventions. She attributed this to the tendency of the success rates of the self-help interventions to increase over time. As opposed to a scheduled group program, self-help materials remain available for the smoker to use again as readiness to quit increases.
Several studies have evaluated self-help programs that are tailored to individual characteristics, such as readiness to change, specific motives for quitting, or the reasons for a previous relapse. Preparation and dissemination of tailored materials may be automated to reach large numbers of smokers. Among the successful tailored approaches are individualized mailings based on participants’ answers to initial questionnaires about their smoking (Strecher et al., 1994; Prochaska et al., 1993, 2001), individualized mailings based on initial questionnaires and provided as supplements to use of over-the-counter (OTC) nicotine gum (Shiffman et al., 2000), and personalized feedback added to a self-help manual (Curry et al., 1991; Becona and Vazquez, 2001).
Physician Advice
A physician’s advice or brief counseling for smoking cessation often includes a presentation of the risks individualized by symptoms or family history, provision of accompanying cessation materials, and follow-up (Kottke et al., 1988; Ockene et al., 1991a; Rose and Hamilton, 1978; Russell et al., 1979). A recent meta-analysis (Silagy and Ketteridge, 1998) reviewed 31 studies of brief advice, defined as consisting of advice delivered in less than 20 minutes with the possibility of one follow-up contact. Smokers who received such advice were 1.7 times more likely to quit than were those who received usual care. On the basis of a review of such research, the
PHS Guidelines for Smoking Cessation (US DHHS, 2000a) emphasize the five A’s, “Ask, Advise, Assess, Assist, Arrange,” as a structure for organizing smoking cessation interventions. Adding a video on how to quit, counseling by a nurse, follow-up phone calls, referral to self-help materials, referral to group treatment, or giving patients a choice between self-help and group treatment all increased smoking cessation rates (Hollis et al., 1993; Whitlock et al., 1997a).
The national Healthy People 2010 objectives set a goal of increasing to at least 85 percent the proportion of primary care providers who routinely identify their patients’ smoking status and offer smoking cessation advice, assistance, and follow-up for all their patients who smoke (US DHHS and Office of Disease Prevention and Health Promotion, 2000).
Telephone Counseling
Another channel for delivery of brief advice as well as repeated and more extended counseling and follow-up is the telephone. A review of this literature (Lichtenstein et al., 1996) found that reactive telephone services (those that users must call) are effective for those who do access them but are not used by many quitters. Proactive services provide outreach telephone counseling to smokers, usually in conjunction with written self-help materials. The 2000 PHS Clinical Practice Guidelines concluded that telephone counseling is an effective approach to smoking cessation counseling (US DHHS, 2000a, p. 63).
Group Programs or Classes
Group smoking cessation classes have long been offered by many hospitals and at many worksites as well as by volunteer agencies such as the American Lung Association. An analysis of 494 participants in 42 of the American Lung Association’s Freedom from Smoking clinics showed a long-term abstinence rate of 29 percent (Rosenbaum and O’Shea, 1992), relative to a benchmark of 20 percent suggested by a contemporary review of published studies (Glasgow and Lichtenstein, 1987). Group programs generally include multiple components. Study designs preclude assessment of the efficacy of individual components, but their aggregate impacts are appreciable (Compas et al., 1998; Stevens and Hollis, 1989). Overall, smoking cessation rates among groups across a wide array of multicomponent group programs are quite similar.
Intensive Interventions for Individuals
In 1992, Lichtenstein and Glasgow noted the popularity in the preceding decade of public health approaches to smoking that sought to dissemi-
nate brief, inexpensive interventions to large numbers of smokers, thereby achieving a greater benefit to the population than intensive interventions implemented with quite small numbers. However, they also noted that the growing proportion of heavy smokers who found it difficult to quit suggested a renewed role for intensive interventions directed to small numbers of high-risk or difficult cases.
Using models for intensive inpatient treatment of drug dependence, researchers at the Mayo Clinic have developed an intensive residential treatment for smoking cessation. The evaluation compared participants in this program with smokers treated as outpatients and matched by age, sex, year treated, number of cigarettes smoked per day, longest previous abstinence, education, and marital status (but not psychological distress or psychopathology) (Hays et al., 2001). On the basis of self-reports of smoking status, those who received residential treatment reported rates of abstinence of 45 percent at both 6- and 12-month follow-ups, relative to abstinence rates of 26 and 23 percent in the matched comparison patients at the two times of follow-up, respectively.
Pharmacological Interventions
Pharmacotherapies for smoking cessation that have been approved by the Food and Drug Administration (FDA) and recommended in the PHS Guidelines include several forms of nicotine replacement (gum, patch, nasal spray, and inhaler) and bupropion SR, currently available as the trademarked Zyban™. Two other medications, nortriptyline and clonidine, although not approved to be marketed for smoking cessation by the FDA, are recommended as second-line medications if nicotine replacement and/or bupropion SR are not effective.
Two nicotine replacement treatment (NRT) products, gum (2 mg and 4 mg) and patch (21 mg, 14 mg, and 7 mg) are available for purchase over the counter. Nicotine patches are also available by prescription; bupropion SR can only be obtained by prescription. NRT works by partially replacing nicotine that was previously obtained by smoking. The availability of NRT in different dosages and forms allows individuals to tailor their initial dose to their baseline levels of smoking (i.e., higher-dose gum and patches and more frequent use of the nasal spray and inhaler are recommended for persons who smoke more than 25 cigarettes a day) as well as to taper their use of NRT over time. Sustained-release bupropion is an antidepressant medication that has evidence of effectiveness for smoking cessation. The mechanism of action for this medication is unknown although it is likely through its inhibitive effect on the neuronal uptake of norepinephrine and dopamine.
Results of meta-analyses of randomized trials of pharmacotherapies are summarized in Table 4.2. Overall, rates of cessation are doubled for active

SOURCE: Corbis Corporation.
versus placebo medication. As indicated in Table 4.2, recent research has examined the combination of nicotine replacement therapies. Combinations of NRT reflect recognition of the utility of augmenting steady levels of nicotine replacement obtained with the nicotine patch, with more flexible forms of dosing (e.g., nicotine gum) to cope with transient urges. A recent study also evaluated the efficacy of combining the nicotine patch with bupropion SR. In this study, the combined drugs did not significantly out-perform either therapy alone. Still unanswered is whether combining bupropion SR with NRT that has a more flexible dosing regimen (e.g., gum, nasal spray, or inhaler) would enhance cessation.
The 1988 Surgeon General’s report on smoking as nicotine addiction (US DHHS, 1988) concluded that nicotine replacement is best viewed as an adjunct to counseling or other smoking cessation programs and efforts. The 1996 Agency for Health Care Policy and Research (AHCPR) Guidelines were unable to reach a clear conclusion as to whether nicotine replacement without any behavioral counseling was no better than placebo (AHCPR, 1996). Other reviews found little evidence for nicotine replacement in isolation. For example, a meta-analysis found an odds ratio of 1.91 for continued smoking cessation for those who receive nicotine gum plus a brief intervention versus those who receive only nicotine gum (Baillie et al., 1994). The 2000 PHS Guidelines emphasized the importance of at least brief counseling for all smokers interested in quitting and concluded that, except in special circumstances, all individuals interested in quitting smok-
TABLE 4.2 Summary of TTUD Meta-Analyses Evaluating First-Line Pharmacotherapies
|
Condition |
Number of study arms |
Estimated OR (95% CI) |
Estimated abstinence rate (95% CI) |
|
Bupropion (2 studies) |
|||
|
Placebo |
2 |
1.0 |
17.3 |
|
Bupropion |
4 |
2.1 (1.5, 3.0) |
30.5 (23.2, 37.8) |
|
Nicotine gum (13 studies) |
|||
|
Placebo |
16 |
1.0 |
17.1 |
|
Nicotine gum |
18 |
1.5 (1.3, 1.8) |
23.7 (20.6, 26.7) |
|
Nicotine inhaler (4 studies) |
|||
|
Placebo |
4 |
1.0 |
10.5 |
|
Nicotine inhaler |
4 |
2.5 (1.7, 3.6) |
22.8 (16.4, 29.2) |
|
Nicotine nasal spray (3 studies) |
|||
|
Placebo |
3 |
1.0 |
13.9 |
|
Nicotine nasal spray |
3 |
2.7 (1.8, 4.1) |
30.5 (21.8, 39.2) |
|
Nicotine patch (27 studies) |
|||
|
Placebo |
28 |
1.0 |
10.0 |
|
Nicotine patch |
32 |
1.9 (1.7, 2.2) |
17.7 (16.0, 19.5) |
|
Combination nicotine replacement (3 studies) |
|||
|
One NRT |
3 |
1.0 |
17.4 |
|
Two NRTs |
3 |
1.9 (1.3, 2.6) |
28.6 (21.7, 35.4) |
|
OR, odds ratio; CI, confidence interval. Odds ratios and abstinence rates refer to long-term (>5-month) follow-up. SOURCE: Adapted from US DHHS (2000a), Tables 12–18. Reprinted from Piasecki and Baker (2001) (www.tandf.co.uk/journals). |
|||
ing should be offered medication to assist them in their efforts (US DHHS 2000a, pp. 3–5).
Worksite Programs
Worksites are an attractive channel through which to disseminate interventions because of their reach into the adult population. Reductions in smoking have been reported through workplace programs aimed at smoking alone or at multiple risk factors (Gomel et al., 1993, 1997; Emmons et al., 1999). A recent meta-analysis (Chapman et al., 1999) found that 17 of 19 studies reported reductions in the prevalence of smoking through workplace programs. However, the Working Healthy Project, a large study of multiple risk factor interventions in 26 manufacturing worksites, found benefits for reported activity levels and reported levels of consumption of fruits and vegetables but no impacts on smoking (Emmons et al., 1999). Programs aimed at worksite norms and general support for nonsmoking
have reported substantial cessation rates, even among smokers who did not formally join smoking cessation clinics (Fisher et al., 1994). Effective also are worksite restrictions on smoking, which led 18 percent of smokers in one study to quit (Sorensen et al., 1991). The meta-analysis on workplace programs (Chapman et al., 1999) estimated that 12.7 percent of the decrease in cigarette consumption in the United States between 1988 and 1994 was attributable to workplace restrictions and interventions.
Insurance Coverage of Smoking Cessation Interventions
The provision and acceptance of smoking prevention services are enabled when they are covered insurance benefits. A lack of reimbursement affects both patients and physicians (Frame, 1992; Jaen et al., 1994; Kottke et al., 1993). Smoking cessation counseling and pharmacotherapies are not consistently covered as paid services by Medicaid, health insurance plans, and managed care organizations (MCOs) and are not covered at all by Medicare (Professional Assisted Cessation Therapy, 2001; Schauffler and Parkinson, 1993). Cost may be a barrier even among individuals who are insured because of significant cost sharing (e.g., through deductibles and copayments).
Despite the higher rates of smoking among adults in the Medicaid population compared with those among insured adults (for example, 31 versus 19 percent in 1999 in California [Schauffer and Brown, 2000]), Medicaid coverage for smoking cessation services is limited. In 2000, the Medicaid programs of only 33 states and the District of Columbia covered one or more treatments for tobacco dependence, and those of 17 covered no treatments at all (CDC, 2001e). State Medicaid programs were most likely to cover some form of pharmacotherapy, but the programs of only 11 states covered at least one type of pharmacotherapy and one type of counseling, despite clear evidence that quit rates are doubled when counseling and pharmacotherapy are combined (US DHHS, 2000a). Only one state offered coverage for all treatments recommended by the Public Health Service clinical practice guidelines.
Medicare does not require coverage for smoking cessation counseling, nor does it provide reimbursements for pharmacotherapy, although a pilot program for elders has been initiated (Health Care Financing Administration, undated).
Only four states mandate that private health insurers or managed care providers offer a smoking cessation treatment benefit (Professional Assisted Cessation Therapy, 2001). However, a growing number of health insurers and MCOs are offering some form of treatment for smoking cessation (Halpin Schauffler et al., 2001; Pickett et al, 2001; Zapka et al., 1997). Results from the first annual national survey of managed health care plans conducted in 1997 (McPhillips-Tangum, 1998) showed that 75 percent of MCOs report the availability of full coverage for some smoking cessation interventions.
Unfortunately, this often consists of self-help materials, which have been found to be less effective than counseling and the use of pharmacotherapy. A survey of employers conducted in 1997 regarding their single highest-enrolled health plan indicated that 23 percent of employers provided coverage for smoking cessation devices and drugs and 22 percent provided coverage for smoking cessation counseling (Partnership for Prevention, 1997).
Thus, although there is a growing trend toward increasing coverage and reimbursement for tobacco services, it is not adequate or consistently provided through Medicaid, Medicare, health insurers, or MCOs. Several states have programs that provide tobacco treatment services to low-income, high-risk populations (see Box 4.2). In addition, the Tobacco Master Settlement Agreement in some states is providing opportunities to fund counseling or for pharmacotherapy to be available to tobacco users in those states (Professional Assisted Cessation Therapy, 2001).
Effects of Costs of Care
Costs have complex roles in discouraging or encouraging healthy behavior and the use of preventive services. This was examined in a study by Curry and colleagues (1998) at Group Health Cooperative of Puget Sound. Among participants in smoking cessation services, those who had to pay for some portion of costs achieved higher quit rates than those who received them at no cost. This reflects the commonly expressed opinion that offering services for free is counterproductive because recipients will not value services for which they do not have to pay. However, offering services at no charge resulted in participation in cessation services by a greater percentage of smokers. The benefit of increased volume outweighed the difference in efficacy among participants. As a result, when quit rates were examined as a percentage not just of participants but of all smokers in a plan, the quit rates were higher when the services were free (quit rate, 2.8 percent of all smokers) than when reduced coverage was available (quit rates, 0.7 percent of all smokers).
In another randomized controlled trial, full coverage of a tobacco dependence treatment benefit implemented in two IPA model HMOs in California was an effective and relatively low-cost strategy for significantly increasing quit rates, quit attempts, and use of nicotine gum and patch in adult smokers (Schauffler et al., 2001b). In this study, 1,204 eligible smokers were randomly assigned either to the control group, which received a self-help kit (video and pamphlet), or to the treatment group, which received the self-help kit and fully covered benefits for over-the-counter nicotine replacement therapy gum and patch, and participation in a group behavioral cessation program with no patient cost sharing. The quit rates after one year of follow-up were 18 percent in the treatment group and 13 percent in the control group (adjusted odds ratio 1.6).
|
BOX 4.2 Selected State Tobacco Control Initiatives Arizona Twenty-three percent of the revenues from a 40-cent Arizona state cigarette excise tax increase in 1992 were dedicated to programs to prevent and reduce tobacco use. Five percent was dedicated to research on prevention and treatment of tobacco-related disease and addiction. However, until 1997, multiple programmatic restrictions were placed on use of the funds, not allowing the Arizona Tobacco Education and Prevention Program (AzTEPP) to be as comprehensive as was initially proposed. By 1998, AzTEPP had a $28.2 million budget and program efforts were able to extend to youth and adult cessation activities. Surveillance systems and program evaluation studies have been implemented to assess the success of the program. Results from baseline surveys of adults show a 21 percent decline in smoking prevalence from 1996 to 1999. California California’s Tobacco Control Program was developed following the passage of state legislation in 1988. In 1989 and 1994, the cigarette excise tax was increased. By 1999, the budget for California’s program, housed within the Department of Education and the Department of Health Services, had grown to $126.8 million. The program is the largest and most comprehensive program in the United States to reduce tobacco use. It is focused on getting resources to local communities through grants to local health departments and community organizations. A major media campaign was launched to change public opinions regarding tobacco use. Resources have also been allocated to treatment programs and to adopting clean indoor air policies. This comprehensive multi-component program has been a success according to program evaluations. The rate of decline in cigarette consumption between 1993 and 1996 was steeper in California than in the rest of the country. Florida Florida was able to fund the Florida Tobacco Pilot Program with $70 million from its 1997 individual settlement with the tobacco industry. The comprehensive program began in 1998 to accomplish the main goals of changing young people’s attitudes towards tobacco use, increasing youth empowerment through community involvement, reducing young people’s access to tobacco products, and reducing youth exposure to environmental tobacco smoke. With an obvious focus on youth, the Florida State Department of Health directly involved youth in the development of the program. From 1998 to 2000, smoking rates have declined 47 percent among middle school students and 30 percent among high school students. In 2001, funding for the program was cut by nearly one-third, and perhaps as a result more recent surveys show no statistically significant declines in smoking rates. Maine In 1997, legislation in Maine increased the cigarette excise tax by 37 cents and established the Tobacco Prevention and Control Program with an initial annual budget of $4.35 million. The program became an expansion of the already existing ASSIST program. The expansion met the 1997 legislative requirements of providing an ongoing major media campaign, grants for funding community-based programs, program surveillance and evaluation, and law enforcement efforts regarding transportation, distribution, and sale of tobacco products. In 2000, the program was expanded and budgeted $18.3 million. A large portion of the budget ($8.35 million) was used for community and school-based grants, and another large portion ($6.75 million) was used for cessation and statewide multimedia campaigns. Since 1997, smoking among high school students in Maine has declined by 36 percent. Massachusetts The 25-cent increase in Massachusetts’ cigarette excise tax in 1992 produced enough revenue to fund the Massachusetts Tobacco Control Program. The program began with a large media campaign and then moved on to support community-based education and prevention activities. The state’s regional primary care Prevention Centers provided ongoing educa- |
|
tion, technical assistance, and training to local community programs and initiatives. Efforts were also aimed at increasing community awareness, promoting smoke-free workplaces, and enforcing regulation about tobacco use. The per capita consumption of cigarettes in Massachusetts declined by 32 percent between 1992 and 1999, in comparison to an 8 percent decline in the rest of the United States. Relative to the U.S. population in 1999, 25 percent more of Massachusetts’ residents lived in a town with a complete ban on smoking in restaurants. Minnesota Minnesota was one of the first states to pass statewide legislation for clean indoor air in 1975. In 1983, the Center for Nonsmoking and Health developed The Minnesota Plan for Nonsmoking and Health. By 1986, increased attention was drawn to the relationship between smoking and health, stimulating legislation to increase the state cigarette excise tax and launch a major statewide initiative, The Minnesota Tobacco Use Prevention Initiative. The initiative focused on changing the social climate surrounding the use of tobacco through school-based programs and a mass media campaign. An evaluation of the programs suggests that the initiative was successful in changing attitudes towards smoking, and in increasing school curricula dedicated to smoking prevention. However, there was not a significant decline in smoking rates in Minnesota between 1986 and 1990. Receipt of tobacco settlement money enabled the state in 2000 to support a new tobacco prevention initiative with the ambitious legislative goal of reducing tobacco use among young people by 30 percent by 2005. The initiative, called Target Market, has a large public awareness and advertising component, as well as a grassroots movement among Minnesota youth. After one year, the program has been associated with a change in teen attitudes and also reductions in tobacco use. Mississippi The Partnership for a Healthy Mississippi is a nonprofit corporation that manages a pilot program dedicated to fostering a healthier Mississippi and eliminating tobacco use among Mississippi youth. In 1997, the program’s first year budget amounted to $23.7 million, funded by an individual state settlement with the tobacco industry. Twenty-five community and youth partnership coalitions were formed during the program’s first year, with the requirement that a quarter of membership must be young people. Since 1998, the program has flourished through major youth initiatives, an increase in the number of school and community programs, numerous grants for law enforcement activities, the Mississippi Tobacco Quitline, a tobacco treatment center, and a public awareness campaign. Before 1997, smoking rates among Mississippi high school students were increasing, whereas between 1997 and 1999 smoking rates within this age group leveled off. Since the program’s expansion in 1999, smoking among public high school students in Mississippi has declined by 25 percent and the youth advocacy movement, Frontline, has helped enact state legislation banning tobacco use on school grounds and at all school events. Oregon In 1996, the Oregon state cigarette excise tax was raised by 30 cents and 10 percent of the revenue was designated for a statewide Tobacco Education and Prevention Program (TEPP). The budget totaled $17 million and was spent on five categories: (1) local coalitions; (2) public awareness and education; (3) statewide and regional projects; (4) schools; and (5) statewide coordination and evaluation. An evaluation of the program found that community-based coalitions were in place in each of the state’s counties and school projects reached 30 percent of the state’s schools. In the first year of the program, per capita cigarette consumption declined by 11.3 percent in Oregon as opposed to the 1 percent decline seen in the rest of the nation that year. From 1996 to 2000 adult smoking decreased by 9 percent in Oregon. SOURCE: USDHHS, 2000b; http://www.tobaccofreekids.org/research/factsheets/pdf/0045.pdf. |
Cost-Effectiveness of Smoking Cessation
Compared with other preventive interventions, smoking cessation is extremely cost effective (Coffield et al., 2001; Warner, 1997; Cromwell et al., 1997; Croghan et al., 1997; Elixhauser, 1990). According to a recent systematic assessment of the value of clinical preventive services, providing tobacco cessation counseling to adults should be a highly prioritized service because it is both cost-effective and likely to reduce disease burden (Coffield et al., 2001). Implementation of the 1996 Agency for Health Care Policy and Research (now the Agency for Healthcare Research and Quality) smoking cessation guideline was estimated to gain 1.7 million new quitters in the first year at an average cost of $3,779 per quitter, or $2,587 per life-year saved (Cromwell et al., 1997).
Programs for Entire Communities
As noted above, the more varied the means of encouragement of nonsmoking are, the greater the rates of abstinence that are achieved. This fact and the desirability of reaching large numbers of smokers have fueled efforts to promote nonsmoking across entire communities.
Among community-based programs, mass media programs achieve effects that are modest in terms of the percentage of smokers who quit (Flay, 1987), but that are quite substantial when one considers the numbers of smokers they may reach. The pattern of results from mass media approaches to smoking cessation shows a striking parallel to the pattern of results from clinical approaches: the more channels of influence that support cessation, the greater the impact (Kottke et al., 1988). Thus, televised programs achieve greater impacts when they are accompanied by printed materials distributed to viewers (Flay, 1987; Warnecke et al., 1992) or by group activities that provide local support for cessation (Flay, 1987; Korhonen et al., 1992).
The National Cancer Institute sponsored the Community Intervention Trial for Smoking Cessation (COMMIT), a large clinical trial that evaluated community-based programs for smoking cessation. COMMIT achieved appreciable impacts among light and moderate smokers but did not significantly increase smoking cessation among heavy smokers (Lichtenstein et al., 1995). The COMMIT program centered on a set of activities and curricula developed centrally and implemented through communities. Community involvement and ownership of the activities occurred through community boards with representatives from major community sectors such as media, health care, and education. This approach, in which the program was implemented through community boards, can be differentiated from approaches that place priority on the authority of community-based organization leadership to plan and direct programs (Fisher, 1995).

Two programs that have emphasized local authority in program direction have achieved significant, community-wide effects on smoking cessation. One program addressed smoking among women in two counties in Vermont. By the third year of the program, local community boards had assumed the burden of responsibility for program planning and implementation. Relative to the counties used for comparison, the two counties achieved significantly greater levels of smoking cessation and lower smoking prevalences (Secker-Walker et al., 2000). A second program addressed smoking in three low-income, predominantly African-American neighborhoods in St. Louis, Missouri. Each neighborhood had its own wellness committee that helped coordinate a variety of peer-based and mass media activities to encourage nonsmoking. Declines in prevalence were significantly greater in St. Louis in comparison to untreated, comparable neighborhoods in Kansas City (Fisher et al., 1998).
A critical component of community-level programs is policy related to smoking. Reducing Tobacco Use: A Report of the Surgeon General (US DHHS, 2000b) identified several aspects of policy on smoking that are important, including bans on indoor smoking to reduce exposure to environmental tobacco smoke, policies that regulate the supply of tobacco and international trade in tobacco, policies that “ease economic diversification in tobacco-producing areas” (p. 359) to minimize economic dislocation from reduced tobacco sales, regulation of tobacco sales and promotion, especially to young people, and “substantial increases in the excise taxes on cigarettes [that] would have considerable impact on the prevalence of smoking and, in the long-term, reduce the adverse health effects caused by tobacco” (p. 359). As summarized in more detail in the section on smoking prevention, there is an emerging consensus that the use of tobacco control policies is an effective and efficient means of preventing smoking among youth.
Comprehensive statewide efforts that combine policy changes with prevention and cessation interventions have shown impressive results. Increased excise taxes and targeting of their proceeds to smoking prevention programs in California and Massachusetts have resulted in substantial statewide reductions in the prevalence of smoking (Biener et al., 2000; CDC, 1996; Pierce et al., 1998; Siegel et al., 2000). A combination of a broad campaign of public education in those states (including well-financed, creative, and hard-hitting advertisements and billboards countering tobacco marketing) with community-based coalitions, support services for cessation, smoking prevention programs aimed at youth, and multicultural approaches led to greater reductions in smoking than would have been brought about by increased sales taxes alone. Replication of the effort in Oregon identified a reduction in the per capita rate of tobacco consumption of 11.3 percent over the 2 years from 1996 to 1998, in contrast to nationwide reductions of only 1 percent per year (CDC, 1999a). Selected state initia-
tives in tobacco control are described in Box 4.2 (see Chapter 8, Box 8.4 regarding state provider training initiatives).
The United States has begun to realize some public health gains secondary to declines in adult smoking rates. A recent evaluation of nonsmoking campaigns in California found associations among (1) the imposition and then reduction of support of the program, (2) changes in smoking rates, and (3) changes in rates of death from heart disease (Fichtenberg and Glantz, 2000).
Cessation Programs to Reach Underserved and Minority Populations
Two key observations about channels for reaching disadvantaged minorities are that (1) they are relatively isolated from formal or mainstream channels of information and (2) they use informal sources of information and support (Dressler, 1991). Both of these observations lead to an emphasis on peer-based and community-based programs designed to enlist informal social networks to disseminate health messages and provide peer and informal support and encouragement for behavioral change (Fisher et al., 1992; Hatch and Derthick, 1992). Additionally, health promotion programs should reflect the emphasis on family found among members of African-American and other minority groups (Ness et al., 1997; Stolley and Fitzgibbon, 1997). Efforts at the promotion of smoking cessation among African Americans and other minorities have used churches, schools, lay health advisers, mass media, and community-based approaches.
Heart, Body and Soul was a smoking cessation program implemented through churches in the low-income, predominantly African-American neighborhoods of East Baltimore, Maryland (Voorhees et al., 1996). Churches were randomized either to a minimal self-help condition or to an intensive culturally specific intervention that included (1) pastoral sermons on smoking, (2) testimony of quitters during church services, (3) the use of trained volunteers as smoking cessation counselors, (4) spiritual audiotapes as part of individual and group support, (5) a day-by-day, guided quit booklet, and (6) baseline and follow-up health fairs with feedback on carbon monoxide levels as well as other risks for cardiovascular disease. In comparison to the minimal, self-help condition, these interventions in the churches resulted in observed but not statistically significant differences in quit rates as measured by self-reports and carbon monoxide levels. Statistically significant differences were found in the proportions who regressed, those who showed no change, and those who moved forward toward quitting or maintained abstinence.
As noted earlier, a program in predominately African-American neighborhoods in St. Louis (Fisher et al., 1998) emphasized the involvement of neighborhood residents, who helped direct the program through neighborhood wellness committees and who helped coordinate a variety of neigh-

SOURCE: PhotoDisc, Inc.
borhood activities to encourage nonsmoking. Declines in the prevalence of smoking exceeded those in comparison neighborhoods.
PREVENTION OF TOBACCO USE
Because of the time course of exposure and disease incidence, reductions in cancer-related morbidity and mortality over the next two decades will result from smoking cessation rather than prevention of smoking initiation. Nevertheless, a critical public health goal is to achieve a generation of nonsmokers through widespread adoption of effective smoking prevention strategies. These strategies can range from behavioral and educational programs delivered directly to youth, to local, state, and federal tax policies that increase the cost of tobacco, to federal regulation of nicotine, the major addictive constituent of tobacco, as a drug. For more than 20 years, a state-of-the-art approach to the prevention of smoking among adolescents has developed that has emphasized programs that are implemented through key social channels (e.g., older peers) and that address social influences to smoke and social and personal skills for rebutting them. Reports of the positive impacts of these programs have been made throughout this period (Botvin et al., 1999; Perry et al., 1980). Such programs have been endorsed by several key reviews, including the 2000 Surgeon General’s report Reducing Tobacco Use (US DHHS, 2000b). One study published subsequent to this review reported negative findings from a randomized trial of smoking prevention interventions implemented across grades 3 to 10. The interven-
tion components stressed skills that helped students recognize and resist influences to smoke. Follow-up data were obtained through the 12th grade and the first 2 years past 12th grade (Peterson et al., 2000). The initial report finds no overall significant effect of the intervention on smoking prevalence in the 12th grade or 2 years later. In-depth analyses of the longitudinal results from that study have not yet been published. Still unanswered is whether the intervention had interim effects or whether such programs were more or less successful among subpopulations of children or schools (Cameron et al., 1999, 2001). Community-based approaches that encompass a broader array of social influences are likely needed to be effective (Peterson et al., 2001; Sussman et al., 2001). Such programs implemented on a statewide basis have shown success (see below).
Relatively little work has addressed family approaches to smoking prevention. This is somewhat remarkable, given the plethora of data linking parental and sibling smoking and family factors to the onset of smoking (Baumrind, 1991; Biglan et al., 1995; Chassin et al., 1996; Jessor et al., 1991). A recent study reported that a family-based approach succeeded in reducing the rate of smoking onset by 25 percent among non-Hispanic whites but not among other groups. This intervention included booklets mailed to families to help them prevent smoking among adolescents and follow-up telephone contacts by health educators (Bauman et al., 2001).
Evaluations of mass media and community-based approaches to the prevention of smoking have, as a group, achieved mixed results (Biglan et al., 2000; Sowden and Arblaster, 2000a,b).
Beyond school- and community-based educational programs, there is an emerging consensus that the implementation and enforcement of tobacco control policies are especially effective and efficient means of preventing smoking by youth (Altman et al., 1999; Farkas et al., 2000; Wakefield and Chaloupka, 2000). They can be less expensive to enact relative to preventive interventions, and they generally reach much larger populations of youth. Fueling such perspectives are findings such as those that show that nonsmoking teens who lived in towns in Massachusetts with local ordinances that restrict tobacco sales were significantly less likely (odds ratio = 0.60) to become smokers over a 4-year period than teens who lived in towns without such ordinances (Siegel et al., 1999). Another study of state tobacco control policies throughout the United States found evidence that policies can influence smoking initiation (Luke et al., 2000). States with the most extensive array of tobacco control policies had significantly lower youth smoking prevalence rates. They also tended to have lower percentages of teenagers who had smoked before age 13.
Statewide comprehensive campaigns to discourage smoking appear to be effective on a population basis (Institute of Medicine, 2000a; Warner, 2000). A review of studies from the United States and other countries (Willemsen and De Zwart, 1999) concluded that the best results are achieved through a
combination of bans on tobacco advertising to youth, increased prices, restriction of sales to youth, mass media aimed at youth, and the intensification of school-based programs for youth. Reaching similar conclusions, another review (Lantz et al., 2000) emphasized implementation of programs in a manner that takes advantage of synergies among program components. Further supporting this approach, a recent review of the impacts of comprehensive state tobacco control programs in Arizona, California, Massachusetts, Oregon, and Florida found that the combination of increased taxes and comprehensive educational and promotional program elements reduced the level of tobacco consumption more than that expected from tax increases alone (Wakefield and Chaloupka, 2000).
PHYSICAL ACTIVITY INTERVENTIONS
For general health, it is recommended that every U.S. adult should accumulate 30 minutes or more of moderate-intensity physical activity on most— and preferably all—days of the week. Public health recommendations emphasize a lifestyle approach to increasing physical activity that includes common activities such as brisk walking, climbing stairs, doing housework and yard work, and engaging in recreational activities (US DHHS and Office of Disease Prevention and Health Promotion, 2000). In addition to the recommendation for general health, the recommendation for cardiorespiratory fitness includes 20 to 60 minutes of aerobic exercise of moderate to high intensity three or more time per week (Pate et al., 1995a). Although an association between cancer and physical activity is established, the exact exercise prescription for cancer prevention or treatment is not known. This section of the chapter summarizes evidence for interventions to promote adherence to national guidelines for physical activity and for physical activity interventions as part of multicomponent treatments for weight loss.
Distinctions between physical activity, exercise, and physical fitness are useful in understanding intervention research. Physical activity is “any bodily movement produced by the contraction of skeletal muscle that substantially increases energy expenditure.” (US DHHS, 1996, p. 21). Exercise is considered a subset of physical activity that is “planned, structured, repetitive, and purposive in the sense that improvement or maintenance of one or more components of physical fitness is the objective.” (US DHHS, 1996, p. 20). Physical fitness is “the ability to carry out daily tasks with vigor and alertness, without undue fatigue.”(US DHHS, 1996, p. 20). The components of health-related fitness include cardiorespiratory endurance, muscular strength and endurance, flexibility, and body composition; the components of skill-related fitness include balance, agility, power, reaction time, speed, and coordination (US DHHS, 1996).
The way that physical activity is defined and measured varies widely. The studies described in this chapter have defined physical activity as vigor-

SOURCE: Corbis Corporation.
ous exercise, moderate physical activity, occupational physical activity, physical activity performed in school physical education classes, or lifestyle physical activity. Physical activity has been measured by a variety of means, including self-reports, physiological tests, observation, or technological monitoring. All these variations make comparisons of studies difficult and complicate efforts to summarize overall effects.
The Surgeon General’s report on physical activity and health (US DHHS, 1996) concluded that physical activity has numerous beneficial physiological effects and that factors associated with success in promoting physical activity include the following:
-
Consistent influences on physical activity patterns among adults and young people include confidence in one’s ability to engage in regular physical activity (e.g., self-efficacy), enjoyment of physical activity, support from others, positive beliefs concerning the benefits of physical activity, and lack of perceived barriers to being physically active.
-
For adults, some interventions have been successful in increasing physical activity in communities, worksites, and health care settings and at home.
-
Interventions targeting physical education in elementary school can substantially increase the amount of time students spend being physically active in physical education class (p. 8).
Interventions to Modify Physical Activity Levels and Patterns
Health Care Settings
Most studies of interventions to promote physical activity with individuals or groups of individuals have been implemented through health care settings. Patients report that they want information about physical activity from their physicians (Godin and Shephard, 1990), and several national initiatives recommend that all physicians and other health care providers advise and counsel their patients to be physically active (Simons-Morton et al., 1998). One of the goals outlined in Healthy People 2010 is to increase the proportion of primary care providers who counsel their patients about physical activity from the 22 percent found in 1995 to 85 percent in 2010 (US DHHS and Office of Disease Prevention and Health Promotion, 2000). Because studies of the importance of increasing physical activity span several chronic diseases, provider counseling regarding physical activity is not typically disease-specific.
As defined in a recent review (Simons-Morton et al., 1998), physical activity interventions in health care settings fall into four categories:
-
advice or instruction such as a statement about increasing physical activity or the use of cognitive and informational approaches to increasing knowledge;
-
behavioral approaches such as feedback, reinforcement, goal setting, and staging;
-
provision of equipment; and
-
supervised training of groups or individuals.
Simons-Morton and colleagues (1998) reviewed 12 randomized controlled or quasi-experimental interventions conducted in primary care settings for general patients. All of the studies used moderate-intensity aerobic activity as the chief behavioral target. The behavioral theories underlying the interventions were described in six of the studies; of these, three reported significant effects, two reported short-term effects, and one reported long-term effects. Physicians delivered the majority of the physical activity interventions, with two delivered by nurses and two delivered by allied health care specialists. Of the seven randomized controlled studies, five reported significant increases in physical activity, but only two of these five reported significant long-term effects.
The review of Simons-Morton and colleagues (1998) also included studies of promotion of physical activity among patients with disease. Twenty-four studies of physical activity interventions in patients with cardiovascular disease were included. The majority of these studies included supervised exercise as the mode of intervention. Interventions were delivered in both inpatient and outpatient settings and by physicians, nurse counselors, and exercise specialists. Of the 24 studies, 13 reported significant changes in physical activity or cardiorespiratory fitness in the group that received the intervention compared with levels of fitness for the control group, or reported significant increases in physical activity or cardiorespiratory fitness before and after the intervention in the intervention group but no significant changes in the control group. Eleven studies had long-term interventions; eight of these had significant long-term effects, with some lasting as long as 4 and 5 years.
Education of providers and attention to how changes in clinic procedures can help providers encourage their patients to exercise appear to be useful. A combination of physician education, reimbursement for prevention counseling, and reminders to providers was followed by increases in the proportion of patients who started to exercise (Logsdon et al., 1989). Along similar lines, the Physician-Based Assessment and Counseling for Exercise program incorporated behavioral theory into individualized, brief counseling messages for patients. Evaluation of the program indicated that it improved health providers’ knowledge about counseling for physical activity (Long et al., 1996) and led to greater improvements in the reported stage of readiness for physical activity, the reported amount of walking for exercise, and scores from an activity monitor (Calfas et al., 1996).
In addition to interventions by health care professionals, print materials and telephone-based interventions appear to be effective in promoting physical activity. A review of 21 studies of such interventions (Marcus et al., 1998d) found evidence that they have short-term impacts on physical activity, with prolonged interventions and those tailored to their audiences being more effective. Additionally, brief telephone contacts were
valuable in maintaining adherence to physical activity programs (King et al., 1988, 1991, 1995a; Lombard et al., 1995; Schultz, 1993). Print materials can also be tailored to stage of readiness for exercise or readiness for motivation (Calfas et al., 1996; Cardinal and Sachs, 1996; Jarvis et al., 1997; Marcus et al., 1998d), but their impacts have not yet been documented.
Simons-Morton and colleagues (1998) identified the characteristics of successful physical activity interventions in health care settings. These included long-term interventions, multiple contacts, supervised exercise, provision of equipment, and the use of behavioral approaches.
Worksite Interventions
Many worksite-based health promotion programs include a physical activity or fitness component (Dishman et al., 1998). The mode and extent of physical activity or fitness promotion vary greatly by program. For example, some worksite-based programs offer very structured, supervised exercise or in-house exercise facilities, whereas others promote increased leisure-time physical activities, such as through physical activity contests or media programs. Among U.S. employees, access to wellness programs and fitness centers is highest among those employed by large establishments and among professional and technical employees (Table 4.3).
An early review (Shephard, 1996) reported that among 52 studies conducted in the United States and Canada, program participants showed small but favorable changes in body mass, skinfold thickness, aerobic power, muscle strength and flexibility, overall risk-taking behavior, blood pressure, serum cholesterol levels, and cigarette smoking. However, it was also noted that although participation in such programs can enhance health-related fitness, a population effect is limited by low participation rates. Also, the rates were often difficult to determine because of Hawthorne effects (individuals altering their behavior because they are being observed as part of a study), attrition rates, and poor definition of the intervention (Shephard, 1996).
Another recent review of worksite-based physical activity interventions (Dishman et al., 1998) found that the typical worksite-based intervention for increasing physical activity yielded small positive effects, but these were not significant. Interventions that use behavior modification or incentives were associated with medium positive effects.
One noteworthy program is the Live for Life program of Johnson & Johnson. This program consisted of a well-conducted, comprehensive, quasi-experimental study with a large study population. The Live for Life program reported a substantial increase in cardiorespiratory fitness, as assessed by clinical measures, in the intervention group versus the control group (Breslow et al., 1990).
TABLE 4.3 Access to Wellness Programs and Fitness Centers Among U.S. Full-Time Employees, by Type of Employer
|
|
Percentage of Employees with Access to: |
||
|
Employer and Employee Group |
Number of Full-Time Employees |
Wellness Program |
Fitness Center |
|
Small, Private Establishments (<100 employees), 1996 |
|
||
|
All employees |
39,816,173 |
8 |
4 |
|
Professional, technical |
7,979,698 |
11 |
6 |
|
Clerical, sales |
12,279,707 |
9 |
5 |
|
Blue collar, service |
19,556,767 |
5 |
3 |
|
Medium and Large, Private Establishments (=100 employees), 1997 |
|
||
|
All employees |
38,409,120 |
36 |
21 |
|
Professional, technical |
10,659,842 |
44 |
31 |
|
Clerical, sales |
9,168,433 |
36 |
19 |
|
Blue collar, services |
18,580,845 |
32 |
16 |
|
State and Local Governments, 1998 |
|
||
|
All employees |
14,350,773 |
35 |
14 |
|
White-collar employees, except teachers |
5,992,894 |
39 |
15 |
|
Teachers |
3,816,292 |
31 |
7 |
|
Blue collar, service |
4,541,587 |
33 |
20 |
|
SOURCES: U.S. Department of Labor, Bureau of Labor Statistics (1999a,b, 2000). |
|||
School-Based Programs
Because most children attend school, schools offer an exemplary setting for the promotion of physical activity to young people (US DHHS, 1996). Several interventions have been successful in increasing moderate-intensity physical activity during physical education classes (e.g., the CATCH study). Unfortunately, results from the School Health Policies and Program study revealed that although physical education is required by most states (94 percent), it is not required every year (Pate et al., 1995b). Additionally, observations of physical education classes report that insufficient time is spent engaging in physical activity (McKenzie et al., 1996).
Earlier interventions implemented in schools focused more on knowledge-based health education classes. Newer interventions include multiple components and address both the individual and the environment (US DHHS, 1996). These components include incentives to be more physically active, social support, and enhanced curricula in both health and physical education.
A recent review (Stone et al., 1998) synthesized information from 22 studies conducted in schools. Program components included physical education programs, classroom health curricula, and out-of-school physical activity. Analysis of the results of the studies concluded that improvements in knowledge and attitudes related to physical activity were generally found in the studies that measured these attributes, and variable increases in the amount of moderate-intensity physical activity were attained during physical education classes.
Seven of the studies (the CATCH study, the Oslo Youth study, the Australian School study, the Stanford Adolescent Heart Health study, Project Active Teens, ARTEC [Active Recreation Tertiary Education Campuses], and Project GRAD [Graduation Ready for Activity Daily]) found increases in the levels of out-of-school physical activity in the intervention group compared with those in the control group. Striking among these, the CATCH III follow-up study found that a significant difference in the amount of out-of-school physical activity still existed 3 years after the intervention. Most remarkable were the results of the Oslo Youth study. The initial results indicated that significantly more students in the intervention group than control students exercised at least twice a week. A follow-up conducted 12 years later indicated that 49 percent of the participants in the intervention group still reported that they exercise at least twice a week, whereas 40 percent of the participants in the reference group made such a report (Stone et al., 1998).
Other studies not included in the review of Stone and colleagues warrant discussion. Several smaller school-based studies target specific minority groups. The Jump into Action Program was geared toward low-income Hispanic children. This program demonstrated significant increases in exercise knowledge, self-efficacy, and frequency of exercise after the intervention compared with those before the intervention, but at a follow-up evaluation, most of the significant effect was lost (Holcomb et al., 1998). Davis and colleagues (1995b) described a significant difference in knowledge and self-reported levels of exercise in a school-based intervention geared toward Navajo and Pueblo youth. In study of Hispanic and African-American youth in middle school, students reported positive effects from an aerobic dance-based physical education intervention (Flores, 1995). Also, Hopper and colleagues (1992, 1996) conducted studies in rural schools that involved parents as well as grade-school-age children and reported significant increases in knowledge about exercise.
Two recent school-based studies promoted decreased amounts of television viewing as a component of their physical activity interventions (Gortmaker et al., 1999a; Robinson, 1999). Both studies were effective in reducing the amount of time spent watching television, and one (Robinson, 1999) reported favorably significant changes in BMIs and skinfold measurements as well. However, neither study measured whether the amount of physical activity increased as the amount of time watching television decreased.
Community-Based Programs
Comprehensive community-based approaches involve a complex series of physical activity-related interventions that cover multiple targets, channels of dissemination, and settings (King, 1991). These large-scale community-based programs often use multiple media channels and various health education techniques to address knowledge, attitudes, and beliefs about physical activity and normative physical activity behavior. The Stanford Five-City Study, the Minnesota Heart Health Project, and the Pawtucket Heart Health Project have all tested community-based approaches to promoting physical activity. In the Stanford Five-City Study, the only significant findings were from cross-sectional analyses indicating that the men in the treatment cities increased their daily energy expenditures and rates of participation in vigorous exercise. The women in the treatment cities increased their rates of moderate-intensity physical activity (Young et al. 1996). Six-year findings from the Minnesota Heart Health Project suggest that in the cities that received the intervention, the overall effects of the project in terms of behavioral changes related to greater levels of physical activity were modest (Luepker et al., 1994). In the Pawtucket Heart Health Project, there were no differences in self-reported knowledge of the benefits of physical activity, attempts to increase levels of participation in exercise, or prevalence of physical inactivity between Pawtucket (whose population received the intervention) and the comparison community (Eaton et al., 1999). Findings from those studies indicate that community-wide interventions for increased physical activity are feasible, acceptable to community residents, and potentially effective (King, 1991).
The heterogeneous groups that community-based programs seek to influence face diverse barriers to physical activity, and these barriers are special challenges to community-based programs. An analysis of the determinants of physical activity among U.S. women (King et al., 2000) found that the principal barrier for each racial or ethnic group of women varied. For example, white women cited a lack of time as the main barrier to physical activity, whereas African-American women reported a lack of a safe place to be physically active (King et al., 2000). Barriers can also be multilevel. In a report of a national cross-sectional study, Brownson and colleagues (2001) reported that personal barriers to physical activity included a lack of time, feeling too tired, and no motivation to exercise; in addition, they reported that there were environmental barriers to physical activity, such as neighborhood characteristics and heavy traffic. Tailoring interventions to accommodate these barriers is important but may be difficult in broad, community-based interventions.
An authoritative review of the effectiveness of interventions to increase physical activity has recently been released by the CDC (2001d). Its findings are consistent with those presented here.
Environmental and Policy Interventions
Environmental and policy interventions that can be used to increase levels of physical activity include the implementation of policies that result in improved access to facilities and programs or the provision of support for social environments that favor physical activity (Schmid et al., 1995). Examples include walking and bicycling trails, funding for public facilities, zoning and land use policies that facilitate participation in physical activities in neighborhoods, mall walking programs, building designs that encourage physical activity, policies and incentives that promote physical activity during the workday, and policies that require comprehensive school health programs (King et al., 1995b; Sallis et al., 1998).
Sallis and colleagues (1998) reviewed seven studies of environmental and policy interventions. An intervention that was as simple and low-cost as posting signs by stairs and escalators can substantially increase levels of physical activity (Andersen et al., 1998; Blamey et al., 1995; Brownell et al., 1980; Russell et al., 1999). More complex policy and environmental interventions have had varied results. Changes in policies and improvements in the physical environment designed to increase physical activity on a military base appeared to improve the fitness of military personnel (Linenger et al., 1991), although study design limitations hinder the ability to place confidence in these results. Policy and environmental changes made to increase the numbers of employees of a large plant in Finland who walk and bicycle to work resulted in only a 7 percent increase (Vuori et al., 1994). More promising results emerged from a quasi-experimental study of 14 publicly funded leisure centers that were opened in Northern Ireland (Roberts et al., 1989). These resulted in increased levels of participation in sports and physical activity among young adults as well as smaller improvements among those in other age groups.
Programs to Reach Underserved and Minority Populations
Several church-based programs that promote physical activity have been described in the literature, but they have not been fully evaluated (Hatch et al., 1986; Lasater et al., 1986). The Lose Weight and Win Program (Kumanyika and Charleston, 1992) demonstrated moderate success in reducing participants’ blood pressure through exercise and dietary changes.
Several school-based programs have shown promise in improving rates of physical activity among minority youth. Davis and colleagues (1995b) described a significant difference in knowledge and self-reported rates of exercise in a school-based intervention geared toward Navajo and Pueblo youth. In a study with Hispanic and African-American youth in a middle school, students reported positive effects from an aerobic dance-based physical education intervention (Flores, 1995). Also, Hopper and colleagues
(1992, 1996) reported positive results of interventions in rural schools that involved parents as well as grade-school-age children.
Media-based approaches have the potential to reach minority populations in a way that may be less threatening and costly than meeting with a physician (Marcus et al., 1998d). Among the media campaigns that address minority populations, PROJECT WALK for sedentary minority women reported an increase in self-reported levels of walking (Chen et al., 1998). However, other mass media programs for physical activity have not been successful (Baranowski et al., 1990b; Nader et al., 1989).
Using a community approach, the Go Girls! Program targeted low-income, overweight, African-American adolescents (Resnicow et al., 2000). It achieved high levels of acceptance of and interest in physical activity, but it lacked a comparison group.
INTERVENTIONS TO ACHIEVE WEIGHT LOSS
Weight-loss treatments aim to modify eating habits and levels of physical activity. Decreasing energy intake, increasing energy expenditure, or a combination will result in decreases in body fat levels. To produce these changes, three main therapeutic elements are emphasized: dietary restriction, physical activity, and behavior modification. This section of the chapter synthesizes the treatment outcome literature for dietary restriction and behavioral programs.
Dietary Restriction
A caloric deficit of 3,500 calories (1 calorie = 4.2 joules) is needed to lose 0.5 kilogram (kg; 1 pound [lb]) of body fat. Thus, a reduction in caloric intake of 500 kilocalories per day (kcal/day) below requirements translates into a weight loss of about 0.5 kg (1 lb) per week; a reduction of 1,000 kcal/ day translates into a weight loss of about 1 kg (2 lb) per week. Rather than trying to estimate current intakes and expenditures and then recommending a deficit of 500 to 1,000 kcal/day, it is typical to suggest a general range of calories and then to adjust the calorie level, as needed.
Low-Calorie Diets
The most common caloric regimen is the low-calorie diet (LCD). Typically, women are recommended a balanced deficit diet of 1,200 to 1,500 kcal/day and men are recommended a balanced deficit diet of 1,500 to 1,800 kcal/day. This regimen should produce a weight loss of 0.5 to 1 kg (1 to 2 lb) per week, which is the rate of weight loss typically recommended. Foods may be self-selected among conventional foods, recipes, and frozen entrees.
LCDs have been found to produce medically significant weight loss. For example, NHLBI reviewed 34 studies evaluating the effects of LCDs (National Heart, Lung and Blood Institute, 1998). In that review, the subjects in all 34 studies demonstrated significant weight loss, averaging 8 percent of initial body weight. The panel concluded that there was strong and consistent evidence that adherence to LCDs for 3 to 12 months produced medically significant weight loss in overweight and obese patients. The review also consistently showed that waist circumference decreased with the weight loss produced by LCDs. On the basis of these data, NHLBI recommended the LCD for the treatment of most overweight and obese persons.
Very-Low-Calorie Diets
Very-low-calorie diets (VLCDs) have traditionally been defined as diets consisting of energy intakes <800 kcal/day. As energy needs vary among individuals, investigators have recently suggested defining VLCDs in terms of the amount of caloric restriction induced by a given diet in a given individual. By using these criteria, a VLCD was defined as any diet providing =50 percent of an individual’s predicted resting energy requirements (Wadden and Berkowitz, 2001).
VLCDs typically consist of liquid meal replacements (e.g., shakes) containing 100 percent of the recommended daily allowance of essential vitamins and minerals; these are consumed three to five times per day. No other foods are usually allowed. Since VLCDs can lead to dramatic shifts in fluid and electrolyte balances and may result in a significant loss of lean body mass, medical supervision is required.
VLCDs produce mean weight losses of about 20 kg (44 lb) in women and about 30 kg (66 lb) in men over 12 to 16 weeks. These reductions are two to three times greater than those produced by conventional diets of 1,200 to 1,500 kcal/day. The NHLBI review showed that VLCDs promoted weight loss of approximately 13 to 23 kg (29 to 51 lb) during the active phase of the VLCD intervention, whereas LCDs promoted weight loss of 9 to 13 kg (20 to 29 lb) (National Heart, Lung, and Blood Institute, 1998).
These favorable short-term results differ markedly from long-term outcomes. On average, patients treated by use of VLCDs regain 30 to 50 percent of their lost weight in the year following treatment and increasingly gain weight over time. In a 78-week trial, Wadden and colleagues (1989) compared a VLCD and an LCD. Weight loss was initially greater with the VLCD (12 kg [26 lb] versus 22 kg [49 lb]), but after 26 weeks the VLCD group began to regain weight, and by 52 weeks the weight loss was no longer different between the two groups.
These and other long-term data (National Task Force on the Prevention and Treatment of Obesity, 1993; Wing et al., 1994) have raised ques-
tions about the benefits of VLCDs and, in particular, of restricting caloric intake to less than 800 kcal/day. Although current VLCDs are generally safe when administered under appropriate medical supervision, they are usually limited to persons who have BMIs =30 kg/m2 and who are resistant to less aggressive approaches with LCDs.
Portion-Controlled Diets
The effectiveness of VLCDs in promoting short-term weight loss likely lies in the form and manner of the VLCD rather than the goal of the VLCD (Foster et al., 1992). Portion-controlled diets capitalize on the advantages of both the LCD and VLCD approaches. Specifically, portion-controlled diets provide the same calories and macronutrients as a conventional LCD, but patients are encouraged to use portion-controlled servings. This can be in the form of drinks, bars, or prepackaged foods meant to replace a meal or snack. For example, patients could use a liquid formula at breakfast and lunch and a portion-controlled frozen dinner at night.
Recently, investigators reported that participants who consumed a liquid formula (i.e., Slimfast) for two meals per day lost more weight than those who consumed a conventional diet with an equivalent number of calories (Ditschuneit et al., 1999). In addition, continued use of meal replacements was related to the long-term maintenance of weight loss (Flechtner-Mors et al., 2000). Other studies in which the food was provided to participants in appropriate portion sizes (Jeffery et al., 1993b; McCarron et al., 1997; Metz et al., 2000) or in which detailed meal plans and grocery lists were distributed (Wing et al., 1996a) have also shown the benefits of structured eating plans relative to those of traditional LCDs. Taken together, these data suggest that portion-controlled diets enable individuals to lose weight effectively and provide healthy nutrition.
Macronutrient Composition
The macronutrient composition of the diet typically recommended for weight loss is based on the Food Guide Pyramid (U.S. Department of Agriculture, 1992). This represents a diet that is low in fat, high in carbohydrates and fiber, and that includes moderate amounts to no alcohol. This dietary composition capitalizes on the different caloric values of nutrients. Specifically, carbohydrates and protein have 4 calories per gram (cal/g), whereas alcohol has 7 cal/g and fat has 9 cal/g.
Because fat is the most calorically dense macronutrient, its consumption is likely to increase the risk of subsequent weight gain. Thus, reducing fat intake may help produce weight loss (Insull et al., 1990; Kendall et al., 1991). Randomized control trials evaluating the effects of low-fat diets
report modest weight losses over the short term (4 kg [9 lb]) and long term (2 kg [4 lb]) (Jeffery et al., 1995; Schlundt et al., 1993). Similarly, NHLBI’s review of the literature and a recent meta-analysis (Astrup et al., 2000) concluded that lower-fat diets promoted modest weight loss and also helped promote weight maintenance.
However, reducing the amount of dietary fat alone is not optimal for weight loss. Short- and long-term randomized control trials found that weight loss was significantly greater when low-fat diets were combined with caloric restriction than when caloric restriction alone or a low-fat diet alone was used (Pascale et al., 1995; Schlundt et al., 1993). NHLBI’s review also found better weight loss and maintenance of weight loss when lower-fat diets were prescribed in combination with targeted caloric reduction (National Heart, Lung, and Blood Institute, 1998). These studies are supplemented by correlational data that also suggest the benefits of a reduced-fat diet. Greater decreases in the number of calories from dietary fat have been associated with greater short- and long-term weight losses (Harris et al., 1994; Jeffery et al., 1993b). In addition, several studies identified the consumption or the lack of consumption of specific high-fat foods (e.g., French fries and ice cream) as predictive of weight loss failure or success (Harris et al., 1994; Holden et al., 1992). Fast-food consumption or the lack thereof was also associated with weight loss failure or success (Holden et al., 1992). Thus, both the number of calories and the number of grams of fat in the diet should be monitored to achieve optimal weight loss. This is not surprising, given that many “low-fat” or “non-fat” food products compensate for the loss of fat (and calories) by increasing the amount of sugar (and calories) in the product.
Popular Diets
Diets with various energy levels and nutrient compositions have been used for weight loss. Many of the popular diets (e.g., the Atkins, Protein Power, Sugar Busters, and Zone diets) advocate reducing the amounts of specific nutrients or categories of food. These diets work for weight loss to the extent that they produce caloric deficits (Freedman et al., 2001). For example, individuals who are accustomed to a high-sugar diet but who adopt a sugar-free dietary plan may lose weight, at least in the short term, because they reduce their total intake of calories.
Most popular diets, however, have not been evaluated empirically; thus, their effects on weight loss and long-term health remain unclear. Popular diets may produce some short-term weight loss; however, there is no scientific basis for their long-term use. The available data indicate that individuals who are successful at maintaining their weight loss consume diets that are low in fat and high in carbohydrates (Klem et al., 1997). In
addition, individuals derive the greatest health benefits from diets low in saturated fat and high in carbohydrates and fiber; these increase sensitivity to insulin and lower the risk for coronary heart disease.
In summary, LCD’s consisting of 1,200 to 1,500 kcal/day can produce medically meaningful weight losses, averaging about 8 percent of initial body weight. Use of meal replacements and portion-controlled servings may help promote adherence to a diet and long-term weight maintenance. Diets that are low in fat and high in fiber and carbohydrates appear optimal for weight control and overall health.
Physical Activity Interventions to Promote Weight Loss and Maintenance
Many reviews and recommendations on the role of physical activity in the management of obesity have been published (Donnelly et al., 1991; Gleim, 1993; National Heart, Lung, and Blood Institute, 1998; Wing, 1999). Published research suggests that exercise alone (i.e., without adjunct dietary restriction) produces only modest weight loss. In the NHLBI review of the literature, 10 of 12 studies reported that exercise alone produced greater weight losses than no-exercise control conditions; however, the mean difference in weight loss was only 2.4 kg (5.3 lb) (National Heart, Lung, and Blood Institute, 1998). Therefore, the panel concluded that physical activity alone has only a modest effect or no effect on body weight. Similar findings have been reported in other reviews (Wing, 1999) and a meta-analysis of the literature (Garrow and Summerbell, 1995).
On the basis of these findings, the commonly held view is that exercise alone is not a very useful weight-loss strategy. However, the energy expenditures induced in the exercise-alone conditions of most of these studies were moderate, at best, and would not be considered enough to produce a substantial weight loss. Larger energy deficits (i.e., >3,500 kcal/week) do, in fact, promote weight loss (Bouchard et al., 1990; Sopko et al., 1985). Overall, when obese patients increase their levels of physical activity, a state of negative caloric balance is produced; at sufficiently high levels, this negative caloric balance can promote weight loss.
Induction of Weight Loss: Exercise Plus Dietary Restriction
Much research has also compared the effects of exercise, dietary restriction, and their combination in promoting weight loss. NHLBI’s review reported that 12 of 15 studies showed greater weight loss in the group that used diet plus exercise than in the group that used diet alone (a 1.9-kg [4.2-lb] difference) (National Heart, Lung, and Blood Institute, 1998). In addition, the combination of diet plus physical activity improved cardiorespiratory fitness and produced modestly greater reductions in abdominal fat levels compared with those from dietary therapy alone. Wing’s review
(1999), which included most of the same studies reviewed by NHLBI, noted that although the weight losses were greater in those who used exercise plus diet, only 2 of 13 studies showed statistically significant differences in weight loss between those in the group that used exercise plus diet and those in the group that used diet alone. Thus, although the combination of a reduced-calorie diet and increased physical activity produced greater weight loss, the effect was modest. However, given the modest increase in weight loss and the significantly greater improvements in cardiorespiratory health, the combination of a reduced-calorie diet and physical activity is the recommended treatment for obesity (National Heart, Lung, and Blood Institute, 1998).
Physical Activity and Maintenance of Weight Loss
Improving the rate of maintenance of weight loss remains a principal goal of obesity research. Empirical reviews of randomized control trials have reported that diet plus exercise generally increased long-term weight loss relative to that from diet alone, although the difference was often not statistically significant. Within these randomized control trials, those individuals who continue to perform the highest levels of activity achieve the best long-term results (Garrow and Summerbell, 1995; Jeffery et al., 1998; Pronk and Wing, 1994; Wing, 1999).
Correlational studies consistently show that the self-reported level of physical activity is a strong predictor of weight loss maintenance. In fact, exercise predicts weight loss maintenance significantly more than dietary adherence or use of other behavior modification techniques (Pronk and Wing, 1994; Wing, 1999). For example, Kayman and colleagues (1990) described the variables that differentiated weight maintainers (i.e., women who had successfully maintained their weight loss for at least 2 years), weight regainers (i.e., women who had previously lost 20 percent of their weight but had regained it), and normal-weight controls (i.e., women who had always been of average weight). One of the major factors that differentiated the three groups was adherence to exercise. Specifically, 75 percent of maintainers reported that they used exercise as part of their weight management strategy, whereas only 36 percent of weight regainers used exercise. In addition, 90 percent of maintainers and 82 percent of controls said that they had participated in exercise on a regular basis (i.e., >3 days/week for =30 minutes), whereas only 34 percent of regainers reported this behavior.
In a more recent example, the National Weight Control Registry described the weight-control behaviors of 784 men and women who had maintained an average weight loss of 30 kg (66 lb) for an average of 5.6 years (Klem et al., 1997). In that study, most participants reported extremely high levels of physical activity. Specifically, participants reported expending approximately 2,830 kcal/week, which is the equivalent of walk-
ing about 45 kilometers/week (28 miles/week) or more than 1 hour/day every day. Other correlational data have revealed similar findings (Pronk and Wing, 1994), further demonstrating the importance of physical activity in long-term weight control.
Given the low level of adherence to exercise by obese patients, identification of alternative ways to facilitate long-term adherence is paramount. One promising approach is to encourage engaging in multiple brief bouts of physical activity each day, that is, multiple 5- to 10-minute bouts of moderate-intensity activity throughout the day (Jakicic et al., 1995). Engaging in several short bouts rather than one long bout of physical activity may make it more convenient for patients to exercise. Jakicic and colleagues (1995) examined the effects of prescribing exercise in multiple short bouts (i.e., four bouts of 10 minutes each) versus one longer bout (i.e., 40 minutes). After 20 weeks, participants in the multiple-bout regimen had better rates of adherence to the exercise regimen and better initial weight loss. Both groups had similar improvements in fitness.
In a longer-term follow-up study, Jakicic and colleagues (1999) compared the effects of multiple short-bout exercise (10-min bouts), multiple short-bout exercise with home exercise equipment (i.e., a treadmill), and longer-bout exercise (40 minutes). After 18 months, the short- and long-bout exercise groups had similar weight losses and improvements in cardiorespiratory fitness, again suggesting the comparable benefits of short- and long-bout exercises. Interestingly, participants with the home exercise equipment maintained higher levels of exercise than participants in the short- and long-bout exercise groups; they also had significantly greater weight loss than participants in the short-bout exercise groups. As noted below, access to home exercise equipment may facilitate the maintenance of exercise, which can improve long-term weight loss.
Another approach to increasing physical activity is to promote lifestyle activity as an alternative or complement to programmed activity. Several studies have documented the benefits of increasing the amount of lifestyle activity (walking rather than driving, using stairs rather than escalators, and throwing away energy-saving devices such as television remote controls). For example, Andersen and colleagues (1999) found that both lifestyle activity and programmed exercise combined with a diet of 1,200 kcal/day produced weight losses of approximately 8.5 kg (19 lb) during a 16-week weight-loss program. A longer-term (2-year) study similarly reported that both lifestyle and structured exercise interventions produced significant and comparably beneficial changes in levels of physical activity, cardiorespiratory fitness, blood pressure, and the percentage of body fat (Dunn et al., 1999). Thus, the encouragement of lifestyle activity may be useful, particularly for patients who dislike programmed regimens.
Another approach is to have participants exercise at home rather than at a clinic or a health club. A number of studies have compared home-based
and supervised exercise programs. For example, Perri and colleagues (1997) evaluated the effects of a supervised group exercise program versus those of a home-based exercise program. At 12 months, participants who had been randomly assigned to home-based exercise had better rates of adherence to exercise and greater weight losses. Similarly, King and colleagues (1991) found that participants were more adherent to exercises that they could complete at home than to those that had to be completed in supervised group settings. On the basis of these and other studies (Jakicic et al., 1999), home-based exercise appears to improve rates of adherence to exercise and may help in promoting long-term exercise adoption.
In summary, the combination of a reduced-calorie diet and increased physical activity is recommended since it produces the best maintenance of weight loss, the greatest increases in cardiorespiratory fitness, and the greatest decreases in abdominal fat levels. The accumulation of exercise through short bouts of exercise, lifestyle activity, and the use of exercise equipment in the home may help improve rates of adherence to physical activity regimens.
Behavioral Programs
A number of behavioral approaches have been incorporated into weight-control programs (Brownell, 1991; Wadden and Bell, 1990; Wing, 1996). Although little research examining the efficacies of specific components of behavior programs has been conducted, in general, a multimodal approach with numerous components works better than less-intensive behavior modification programs (National Heart, Lung, and Blood Institute, 1998).
Multicomponent behavioral programs integrate cognitive-behavioral skill training strategies with dietary restriction and physical activity. Typically, treatment consists of 16 to 20 weeks of group sessions, each lasting 60 to 90 minutes. Maintenance programs vary, but contact is typically decreased over time from weekly to biweekly sessions and then to monthly sessions. Each week, a group leader introduces a new weight-control skill that builds upon skills learned in previous sessions. To promote skill building and group cohesion, patients start and complete a program together, with no new participants added to the group. In addition to a weekly topic, session time is also spent reviewing homework, setting specific behavioral goals, and helping patients resolve barriers to their weight-loss efforts (Wadden, 1993). Sessions are structured by use of an agenda, and manuals may be provided (Brownell, 1991).
Short-Term Programs
Initial randomized control trials (conducted in the 1970s) showed that multicomponent treatment was consistently superior to comparison treat-
ments, including treatments that included only psychoeducational and nutrition components. Weight losses averaged 3 to 4 kg (7 to 8 lb) in 8 weeks. Over time, both the duration and the content of treatment expanded. Specifically, the length of treatment doubled, from 8 to 10 weeks to 16 to 20 weeks. In addition, treatment began to emphasize caloric restriction and physical activity as key components for weight loss. As a result, weight losses nearly doubled (Brownell and Wadden, 1986). Today, treatment programs result in an average weight loss of 8.5 kg (18.7 lb) (9 percent of initial body weight), and attrition rates are generally low (<20 percent). Patients experience significant improvements in both cardiovascular and mental health (National Heart, Lung, and Blood Institute, 1998).
Long-Term Programs
The central problem with multicomponent treatment has been failure to promote the long-term maintenance of weight loss. In the year after treatment, patients typically regain about 30 to 35 percent of the weight that they initially lost. Weight regain generally increases with time. In 3 to 5 years after treatment, 50 percent or more of patients have returned to their baseline weight (Wadden et al., 1989).
Extending the length of treatment (i.e., to 52 or 78 weeks) can promote the maintenance of weight loss. On average, patients maintain their full end-of-treatment loss as long as they attend maintenance group sessions (Perri et al., 1988; Wadden et al., 1994; Wing et al., 1994). Unfortunately, attendance at these sessions declines over time, and after treatment ends, patients regain the weight that they lost (Perri et al., 1988; Wing et al., 1994).
A minority of individuals are able to maintain their weight by adhering to a low-calorie, low-fat diet and engaging in high levels of physical activity (Klem et al., 1997). Predicting who will succeed or fail treatment, however, has proven elusive. Personality traits, measures of psychopathology, the presence of binge eating, dietary restraint, and a history of weight cycling have all proved unreliable in predicting success. High levels of social support (Foreyt and Goodrick, 1991; Kayman et al., 1990) and greater initial body weight (Foreyt et al., 1982) are related to better short- and long-term weight-loss outcomes. In addition, the treatment variables of early weight loss (Wadden et al., 1998), consistent attendance at weight maintenance sessions (Guare et al., 1989; Jeffery et al., 1993b; Wadden et al., 1994), and adherence to self-monitoring (Jeffery et al., 1993b; McGuire et al., 1999) are also useful predictors.
In summary, multicomponent behavioral programs provide the skills and support needed to lose a medically significant amount of weight. A minority of individuals succeed at weight maintenance by adhering to a low-calorie, low-fat diet and maintaining a high level of physical activity. However, after treatment is terminated, most individuals regain weight. In
some individuals who fail to achieve lasting weight loss by standard treatment, more aggressive treatments for obesity, including pharmacological or surgical treatments, may be considered.
Commercial Weight-Loss Programs
Very few empirical studies of commercial weight-loss programs have been conducted, although more people clearly receive their weight-loss counseling from such programs than from the research programs described above. Recently, Heshka and colleagues (2000) conducted an empirical study of the Weight Watchers program. That study showed that participants who were randomly assigned to receive self-help weight-loss materials lost 1.3 kg (2.9 LB) over 26 weeks, whereas those given free vouchers to attend a Weight Watchers meeting lost 3.9 kg (8.6 lb) (Heshka et al., 2000). The weight losses in the commercial program correlated significantly with attendance at the treatment meetings.
Maintenance of weight loss in former Weight Watchers participants who had reached their goal weight while in the program has also been studied (Lowe et al., 2001). Participants contacted 1 year after treatment had regained 31.5 percent of the weight that they had initially lost; after 2, 3, 4, and 5 years participants had regained 54, 60, 78, and 76 percent of the weight that they had initially lost, respectively. Even at 5 years, however, 43 percent of the participants maintained weight losses of >5 percent compared with their weight at the time of entry into Weight Watchers and 70 percent were below their weight at the time of entry into Weight Watchers.
The Trevose program is another self-help program with a different treatment approach (Latner et al., 2000). In this program, which is led by lay people, participants must regularly attend meetings and must achieve their weight loss goals to remain in the program. Given these contingencies, many who join the program do not remain in it long term; however, for a small group of participants the program appears to be quite effective.
Further study of commercial programs is clearly needed. For the present, it is recommended that overweight individuals who wish to use commercial programs select programs based on the following criteria: a good match between programmer and consumer, the soundness and safety of the program, and the short- and long-term outcomes of the program (Institute of Medicine, 1995b).
Mediated Approaches
Although programs that involve a face-to-face treatment approach appear to be the most effective for weight loss, many overweight individuals will not enroll in such programs. In an effort to increase the audience for weight-loss programs and to reduce the cost of such programs, several
investigators have studied interventions delivered by phone (Hellerstedt and Jeffery, 1997; Wing et al., 1996b), mail (Jeffery et al., 1990; Leermarkers et al., 1998), television (Harvey-Berino, 1998; Meyers et al., 1996), or the Internet (Tate et al., 2001). In two studies that used telephone calls to remind people to self-monitor their intake, there were trends, but no significant differences, between those who received phone calls and those in a control condition who did not receive the calls (Hellerstedt and Jeffery, 1997; Leermarkers et al., 1998; Wing et al., 1996b). Leermarkers and colleagues (1998) compared a no-treatment control group with a home-based program delivered via mail and phone and a clinic-based program. Although participants in both the home-based and the clinic-based programs lost more weight than the controls, the weight losses achieved by both approaches were minimal, perhaps because the focus of the program was on weight gain prevention rather than on weight loss.
The presentation of treatment via television has appeared to be more effective. Using an interactive television technology in which patients could see and hear the therapist and other patients, Harvey-Berino (1998) achieved weight losses comparable to those achieved in a face-to-face program (7.6 versus 7.9 kg [16.8 versus 17.4 lb], respectively), over 12 weeks. A program delivered via cable television also produced weight losses comparable to those achieved in a clinic-based program over 8 weeks (Meyers et al., 1996).
Currently of interest is the use of the Internet and computer technology to deliver weight-control programs. Until recently, this approach focused mainly on the use of handheld computers to facilitate self-monitoring of eating and exercise behaviors and to provide feedback to participants (Taylor et al., 1991a; Winett et al., 1991). Recently, Tate and colleagues ( 2001) evaluated the effects of delivering a complete behavioral treatment program via the Internet and e-mail. Participants in the program delivered via the Internet received weekly lessons via e-mail and submitted their self-monitoring diaries to the therapist on a weekly basis. The therapist provided individualized feedback to the participants via e-mail. Weight losses in the group that received behavioral therapy via the Internet were significantly better than those in the control group that received weight-related information via a site on the World Wide Web (–4.1 versus –1.6 kg [–9.0 versus –3.5 lb]). This study raises the possibility that the Internet and e-mail can be useful in increasing the audience for weight-loss programs and helping these individuals achieve modest weight losses.
Pharmacological Treatments of Obesity
Obesity-related medications are recommended for use only by persons with BMIs of =30 kg/m2 with no concomitant obesity-related risk factors or
diseases (e.g., coronary heart disease or diabetes), or for patients with BMIs of =27 kg/m2 in the presence of comorbid conditions (National Heart, Lung, and Blood Institute, 1998). In addition, medications should be used only as an adjunct to a comprehensive lifestyle modification program that includes diet, physical activity, and behavioral therapy (National Heart, Lung, and Blood Institute, 1998).
The history of pharmacotherapy for weight loss has been marked by several adverse experiences. In 1997, for example, fenfluramine and dexfen-fluramine were withdrawn from the market because of their association with valvular heart disease (Weissman, 2001). Currently approved medications, however, appear to be generally safe and effective when used by appropriate persons under medical supervision.
The two medications currently approved for long-term use are sibutramine (Meridia, Abbott Laboratories) and orlistat (Xenical, Roche Pharmaceuticals). Sibutramine is a central nervous system agent that works by inhibiting the reuptake of norepinephrine and serotonin and that is associated with decreased food intake at meals. By contrast, orlistat is a gastric and pancreatic lipase inhibitor that works by blocking absorption of about one-third of the fat contained in a meal; the undigested fat is excreted in the stool.
Both medications in conjunction with dietary therapy promote weight losses of 5 to 13 kg (11 to 29 lb) of initial body weight, or approximately 3 to 9 kg (7 to 20 lb) more than those produced by placebo. Maximum weight losses are generally achieved by 6 months. Weight losses are generally well maintained, with only a minimal amount of regain for up to 2 years (Hauptman et al., 2000; Lean, 1997). Both medications appear to be useful in preventing weight regain after the use of other dietary approaches, such as a VLCD (Apfelbaum et al., 1999; Sjostrom et al., 1998). Unfortunately, few studies have compared the effect of monotherapy (i.e., medication or standard behavior modification treatment alone) versus that of combined treatment (medication plus standard behavior modification treatment). Thus, the benefits of adding medication to a comprehensive treatment program remain unclear. Nonetheless, current recommendations are that medication be used only in conjunction with a comprehensive behavioral treatment program.
Worksite-Based Interventions
Worksites are considered appealing locations for weight-loss interventions because they can reach large numbers of individuals, many of whom might not typically enroll in weight-loss programs, and these individuals can be treated cost-effectively. In addition, environmental changes can be made at the worksite to enhance treatment efficacy. Finally, worksite-based programs might be able to recover the cost of the programs through im-
proved productivity and reduced health care costs (Hennrikus and Jeffery, 1996). The proportion of worksites offering weight-loss interventions gradually increased from 15 to 24 percent between 1985 and 1992.
Most worksite-based programs for weight control include an educational component, with information regarding diet, exercise, and behavior modification strategies presented as part of the program. Typically, this information is presented in small group meetings, held weekly for 8 to 16 weeks, which appear to parallel clinic-based programs. Some worksite-based programs also include financial incentives or prizes for attendance or weight loss. One special type of incentive system that is particularly appropriate in worksite settings is the use of team competitions (Brownell et al., 1984). These competitions may have weekly weigh-ins, posting of team progress, and other strategies to promote team cohesiveness and may provide financial awards, trophies, or T-shirts as prizes. With the exception of these team competitions, most worksite-based interventions have not really taken advantage of the worksite setting. A notable exception is one program that provided point-of-purchase information in the cafeteria, a special dieters lunch table, and nutrition information about vending machine choices (Summnex et al., 1986).
It is difficult to evaluate the effectiveness of worksite-based interventions because few randomized controlled trials have been conducted in the work setting. The median rate of employee participation among overweight employees averaged 39 percent across several studies that presented this information (Hennrikus and Jeffery, 1996). Although it thus appears that many will enter these programs, attrition rates have been high, especially in programs that do not involve group competitions or incentives. Weight losses appear to be modest. Jeffery and colleagues (1985) reported that participants in a worksite-based weight-loss program lost an average of 2.1 kg (4.6 lb) during the initial 3-month treatment, whereas those in the untreated control group gained 1.2 kg (2.7 lb). Few programs have included a maintenance component, but those that have suggest the benefits of continuing to see participants over time (Abrams and Follick, 1983). Long-term weight loss in worksite-based programs appears to be problematic, as is the case in other areas of weight control.
One of the largest worksite-based interventions was conducted by Jeffery and colleagues (1993a) between 1988 and 1990. Thirty-two worksites with a total of 20,000 employees were randomized to either an intervention or a control group. About 20 percent of all employees and 40 percent of the overweight employees enrolled in weight-loss classes that were offered at the worksite on four occasions over a 2-year period. The average weight loss of the program participants was 2 kg (4 lb) over 6 months. After 2 years, however, there were no differences in average BMI or change in BMI between individuals at the worksites that received the treatment and individuals at the control worksites.
In general, worksite-based programs have tended to merely provide clinical programs in a worksite setting. With the exception of team competitions, there has been very little effort to exploit the unique aspects of the worksite in developing these intervention programs.
Community-Based Interventions
Three large community-based intervention projects have sought to reduce smoking, high blood pressure, high cholesterol levels, and obesity. Weight reduction was viewed largely for its potential impact on blood pressure and cholesterol levels. In the Stanford Five-City Study (Taylor et al., 1991b), mass media, community organizations, and educational classes were used to increase knowledge and teach behavioral change skills related to changing diet and levels of physical activity. Both the treated and the control communities gained weight over the 6 years of the study. Although there was slightly less weight gain in the treated communities in cross-sectional analyses, no differences between the treated and the control communities were seen in a cohort analysis.
The Minnesota Heart Health Program (Jeffery, 1995) included interventions similar to those mentioned above for the Stanford Five-City Study but also included worksite-based programs, a home correspondence course, and interventions aimed at preventing weight gain. Again, the results were disappointing; there were substantial weight gains over the 7 years of the study in both the treatment and the control communities.
The Pawtucket Heart program (Carleton et al., 1995) also included both community-based and worksite-based programs; although there was less of an increase in BMI over 6 years in the treated community compared with that in the control community in the cross-sectional analysis, no differences were seen in the cohort analysis.
Thus, all three community-based programs had disappointing results for obesity. It is noteworthy that these community-based interventions were more effective for other risk factors. Perhaps the fact that all three studies occurred in the 1980s, when rates of obesity were increasing so dramatically, and the fact that none of these efforts focused on obesity alone may have limited their effectiveness.
Environmental Approaches to Treatment of Overweight
All of the approaches discussed above focus on providing the general population or the overweight population with education about healthy eating and physical activity and strategies to change their behaviors. An alternative approach is to focus on changing the environment. Over the past several decades there have been a large number of environmental changes that may be associated with the increasing rates of obesity. These
include the increasing frequency of consumption of meals away from home, the explosion of fast-food restaurants, and the dramatic increases in portion sizes. Similarly, the increasing use of energy-saving devices, the large number of hours spent watching television and playing video games, and concerns about safety have led to decreases in amounts of physical activity.
To date, there have been few efforts to systematically evaluate the effect of modifying the environment on eating or exercise behavior and body weight. A number of studies have provided nutrition information to consumers in supermarkets, cafeterias, vending machines, and restaurants (Schmitz and Jeffery, 2002). Most of these have had mixed results. It may be difficult in settings such as grocery stores to provide nutrition information that can compete with the large amount of advertising and marketing that companies use to promote their products.
Rather than provide information or education, recent efforts have focused on changing the price or availability of healthy choices. Jeffery and colleagues (1994) found that increasing the numbers of fruits and salad items offered in worksite cafeterias and decreasing the costs of these items led to more purchases of these items; similar results were observed in a school cafeteria, but there was no postintervention maintenance of the effect (French et al., 1997b). Other investigators have studied the effects of changing prices and using promotional labels on vending machine choices (French et al., 1997a; Wadden and Berkowitz, 2001). Whereas the use of labels and signs had a small effect on purchases, price changes had quite dramatic effects: reducing the price of low-fat snacks by 10, 25, and 50 percent increased the levels of purchase of these items by 9, 39, and 93 percent, respectively. Interestingly, these manipulations had no significant effect on vending machine profits. The effectiveness of these environmental changes, in contrast to the limited effects of educational approaches, suggests that further research on these strategies should be conducted and that they should be tested in longer and larger research trials.
Many other environmental approaches have been suggested, but they have not been studied empirically. For example, taxes on high-fat foods, limiting food advertising during children’s television programs, and building more bike paths have all been suggested, but they have not been empirically evaluated.
Programs to Reach Underserved and Minority Populations
African Americans often achieve less weight loss than whites in standard treatment programs (Kumanyika et al., 1991; Wing and Anglin, 1992; Yanovski et al., 1994). This may be due to physiological differences that impede weight loss in African Americans (Jakicic and Wing, 1998). Alternatively, current treatment programs may be less culturally relevant to African-American participants and other minority populations (Kumanyika,
2001). Intervention programs that are culturally adapted to the population—for example, programs that involve bilingual therapists, that discuss foods typically eaten by the participants or physical activities that are popular in the culture, that incorporate the family to a greater extent, and that involve relevant institutions such as the church—appear to be more effective (Cousins et al., 1992; Kumanyika, 2001; McNabb et al., 1993).
Overall, dietary interventions designed to be culturally relevant appear to be as effective as those designed for the general population. As with other programs for the general population, behavioral interventions for underserved groups are most effective when they are developed with input from the target population and are implemented within organizations respected and valued by the target community. Interventions that target change across multiple levels appear to be effective.
Treatment Approaches for Overweight Children
There has been a rapid rise in the prevalence of overweight among children and adolescents. Because overweight children and adolescents are at increased risk of becoming overweight adults and are likely to experience both negative psychological and physiological consequences of obesity, it is important to develop effective programs for these populations. Two general approaches have been used for childhood obesity: clinic-based interventions, which target overweight children or adolescents and their parents, and school-based interventions, which target an entire classroom of children.
Clinic-Based Programs
Epstein and colleagues (1990, 1994b, 1998) have conducted the most systematic research on clinic-based programs for children. Their program, which targets overweight children ages 6 to 12, has been effective in reducing the prevalence of overweight through 10 years of follow-up (Epstein et al., 1990, 1994b). At the 10-year follow-up, 34 percent of children who participated in these programs had lost 20 percent or more of their excess weight and 30 percent were no longer obese. The key components of this highly effective clinical intervention are discussed below.
Family-Based Intervention
Overweight children are likely to have overweight parents. Because the parents are responsible for most of the food purchases and food preparation and serve as important role models for their children, it is critical to involve the parents in the treatment program (Epstein et al., 1981). Epstein and colleagues (1980) showed that it was more effective to treat the child
and the parents, targeting both for weight loss, than to focus only on the child or to have a nonspecific target. Typically, the child and parent attend separate group meetings, but they are seen together as a family to set specific behavior goals and rewards. Similarly, other research found that overweight adolescents treated with their mothers, but in separate groups, lost more weight than adolescents treated alone or in the same group as their mother (Brownell et al., 1983).
Multicomponent Program
Similar to the treatment of adults, Epstein and colleagues’ effective treatment program for children involves diet, exercise, and behavior modification. Group meetings are typically held weekly for 8 to 12 weeks. These meetings present behavioral skills such as self-monitoring, stimulus control, contingency management, and praise. Several studies have shown that adding behavioral training to a standard diet program improves the results (Epstein et al., 1980; Israel et al., 1985).
Diet Epstein and colleagues used a “traffic-light” diet in which children are encouraged to increase their levels of consumption of green foods (unlimited foods), to eat yellow foods (foods with average nutritional value for their food group) in moderation, and to limit their intake of red foods (foods that provide less nutrient density per calorie) (Epstein et al., 1980, 1986; Valoski and Epstein, 1990). Studies that use this diet have shown significant decreases in rates of obesity among preadolescent children, with corresponding improvements in the nutrient composition of the diet and changes in food preference ratings (Valoski and Epstein, 1990). Other dieting approaches, including exchange-system diets and VLCDs (Figueroa-Colon et al., 1993), have also been used extensively in the treatment of overweight children. The success of these diets appears to depend on the context in which they are presented; no studies have compared different approaches with diet modification in overweight children.
Exercise
The combination of diet and exercise has been shown to be more effective in the treatment of childhood obesity than either diet or exercise alone (Epstein et al., 1998). This finding corroborates data obtained in studies with adults. Less structured, flexible lifestyle approaches to physical activity appear to be more effective than programmed aerobic activity, in which the child must set aside 40 minutes three times a week for structured exercise (Epstein et al., 1985). Moreover, a recent study showed that overweight children who were instructed to decrease the amount of time that they spend doing sedentary activities (watching television and playing video
games) lost more weight and had improvements in fitness comparable to those for children who were instructed to increase the amount of time that they spend doing aerobic exercise or the combination (increase the amount of time that they spend doing aerobic activity plus decrease the amount of time that they spend doing sedentary activities) (Epstein et al., 1995).
School-Based Programs
Several school-based interventions have focused on modification of the diet and physical activity. Among the largest school-based interventions is the CATCH study, which was conducted in 56 elementary schools that received the intervention and 40 control elementary schools (Luepker et al., 1996). The intervention was aimed at children in grades 3 through 5 and included approaches to increasing activity, improving diet quality, and decreasing smoking. Although obesity was not a primary outcome, the fact that the intervention involved both diet and exercise makes the findings from the study relevant. The intervention included a classroom-based curriculum of diet and exercise, modification of the foods served in the school cafeteria, and increased amounts of moderate and vigorous levels of activity in physical education classes; in some schools there was also a family component to the intervention. After 3 years of intervention, positive changes were reported in the school environment (cafeteria foods had lower levels of total and saturated fats) and children spent more time participating in moderate and vigorous levels of activity during physical education classes; there were also positive changes in the children’s self-reported eating behaviors and physical activity levels. However, the intervention had no effect on BMI or skinfold thickness.
Other school-based interventions with elementary school children have shown no effect on BMI. Donnelly and colleagues (1996) studied third to fifth graders in two school districts over a period of 2 years. The children in the schools that received the intervention received enhanced physical activity, grade-specific nutrition education, and a school lunch that consisted of foods with lower levels of fat and sodium. Although the children in the school that received the intervention showed improved behaviors in the school setting, their overall dietary intakes and physical activity levels remained unaffected. Similarly, there were no differences in BMIs.
Studies that use interventions that have focused more on decreasing sedentary activity have obtained better results. Planet Health (Gortmaker et al., 1999b) targeted sixth to eighth graders in Boston, Massachusetts, schools and focused on reducing the amount of television viewing to less than 2 hours/day as well as increasing the amount of moderate and vigorous levels of activity, decreasing the level of consumption of high-fat foods, and increasing the level of consumption of fruits and vegetables. These changes were encouraged in all aspects of the curriculum, with teachers
given incentives to create lesson plans that increased the children’s levels of activity or improved their diets. After 2 years, the intervention was found to be effective in reducing the prevalence of obesity among girls. Girls that received the intervention reported greater decreases in television viewing, the consumption of more servings of fruit and vegetables, and lower daily caloric intakes than control girls (but there were no differences in the levels of moderate or vigorous activity). There were no significant effects among the boys.
Decreasing the amount of television viewing was also shown to be effective in slowing the rate of weight gain in third and fourth graders (Robinson, 1999). In that study, children were taught to budget their television viewing time to 7 hours weekly. Both boys and girls in the intervention group had smaller increases in BMIs, waist circumferences, and triceps skinfold thickness over 6 months than children in the control group.
DIETARY INTERVENTIONS
There is general agreement that a healthful dietary pattern is one that emphasizes the consumption of vegetables, fruits, and grain products and that is low in fat, saturated fat, cholesterol, and sodium. According to nutritional guidelines specific to cancer risk reduction, individuals age 2 and older should (ACS, 1996; Willett, 1999):
-
Choose most foods from plant sources.
-
Eat at least two servings of fruits daily.
-
Eat at least three servings of vegetables daily, with at least one-third being dark green or orange vegetables.
-
Eat other foods from plant sources, such as breads, cereals, grains, pasta, or beans several times each day.
-
-
Limit intake of high-fat foods, with total fat being no more than 30 percent of total caloric intake and saturated fat being no more than 10 percent of total caloric intake.
-
Limit consumption of meats, especially high-fat meats.
-
These recommendations are consistent with those of the U.S. Department of Agriculture’s Food Guide Pyramid (U.S. Department of Agriculture, 1992), the 2000 Dietary Guidelines for Americans (U.S. Department of Agriculture and US DHHS, 2000), and American Heart Association recommendations (Krauss et al., 2000).
Behavioral Interventions to Improve Eating Patterns
This section of the chapter reviews the effectiveness of behavioral interventions designed to improve fruit, vegetable, and fat intakes as defined by
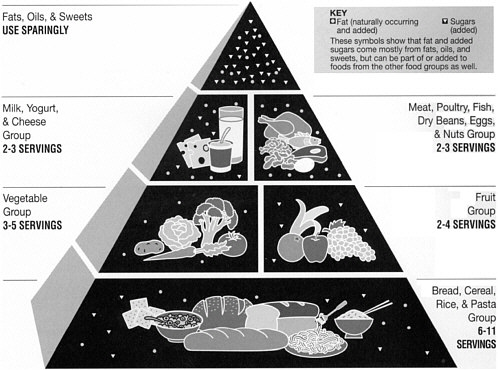
The food guide pyramid, U.S. Department of Agriculture.
current nutritional guidelines. A primary source for this review is the AHRQ Evidence Report on the Efficacy of Interventions to Modify Dietary Behavior Related to Cancer Risk: Final Evidence Report (hereafter referred to as the AHRQ Diet Report) (Agency for Healthcare Research and Quality, 2001a). Also reviewed are selected studies published from 1975 to 2000, a meta-analysis of studies of psychosocial factors and dietary change (Baranowski et al., 1999; Willett, 1995, 1999) and a NCI-sponsored review of the 5 A Day for Better Health Program (http://dccps.nci.nih.gov/5ad_1_intro.html).
Tables 4.4 and 4.5 summarize information from the AHRQ evidence report for fruits and vegetable (Table 4.4) and dietary fat (Table 4.5) intake. Interested readers are referred to the full report for an in-depth description of the study methods and rationale for data synthesis approaches. Results across 45 studies (12 for fruits and vegetables, 33 for dietary fat) are reported as median differences in percentage change in outcome. Thus, the numbers in the tables do not represent absolute changes in numbers of servings (fruits and vegetables) or percentage of energy from fat. For example, the median difference in percentage change in fruits and vegetables of +16.6 translates into an increase of approxi-
TABLE 4.4 Summary of AHRQ Analyses of the Efficacy of Interventions to Modify Dietary Behavior Related to Cancer Risk: Fruit and Vegetable Intake
|
Outcome |
Number of Studies |
Median (range) |
|
Median differences between intervention and control groups in percentage change in fruit and vegetable intake |
||
|
Fruits and Vegetables (servings/day) |
12 |
+16.6 (–3.7 to +60.9) |
|
Fruits (servings/day) |
9 |
+16.0 (0 to +73.4) |
|
Vegetables (servings/day) |
9 |
+5.7 (–17.2 to +153.2) |
|
Median differences in percentage change in fruit and vegetable outcomes by intervention characteristics |
||
|
Social Support Component |
|
|
|
Yes |
5 |
+17.3 (–3.7 to +18.6) |
|
No |
7 |
+15.9 (+6.9 to +60.9) |
|
Interactions with Food |
|
|
|
Yes |
7 |
+14.9 (–3.7 to +60.9) |
|
No |
6 |
+16.8 (+6.9 to +31.8) |
|
Goal Setting |
|
|
|
Yes |
5 |
+12.5 (–3.7 to +22.9) |
|
No |
7 |
+17.3 (+6.9 to +60.9) |
|
SOURCE: AHRQ, 2001a. |
||
mately 0.6 servings per day. The median difference for percent of energy from fat of –15.7 represents an estimated 7.3% reduction in percentage of calories from fat.
The majority of behavioral interventions to modify dietary patterns have been conducted within health care settings. The Diet Report reviewed 45 interventions conducted in health care settings, with most focused on persons at risk for chronic diseases (Agency for Healthcare Research and Quality, 2001a). The most frequently tested interventions used individualized counseling including self-monitoring, goal setting, and problem solving (Beresford et al., 1997; Chlebowski and Grosvenor, 1994; Simkin-Silverman et al., 1995), interactive recipe preparation (Boyd et al., 1996), or group sessions (Agurs-Collins et al., 1997; Coates et al., 1999; Lindholm et al., 1995; White et al., 1992). Two of the studies used computer or video components (Glasgow et al., 1996; Shannon et al., 1994). The intensities of the interventions ranged from 11 to 24 contacts, excluding the self-management or video interventions, in which contact was assumed to be ongoing. Follow-up contacts ranged from 3 months (Aubin et al., 1998) to 7 to 8 years (Boyd et al., 1996). Primarily on the basis of self-reported measures, these studies generally achieved positive results. All focused on fat consumption as the primary outcome of interest, whereas five also included
TABLE 4.5 Summary of AHRQ Analyses of the Efficacy of Interventions to Modify Dietary Behavior Related to Cancer Risk: Dietary Fat Intake (percentage of energy from fat)
|
Outcome |
Number of Studies |
Median (range) |
|
Median differences in percentage change in dietary fat intake between intervention and control groups |
||
|
Total fat (% energy) |
33 |
–15.7 (–76.4 to –1.0) |
|
Total fat (grams/day) |
7 |
–38.0 (–74.0 to –15.9) |
|
Saturated fat (% energy) |
16 |
–14.5 (–41.9 to +0.5) |
|
Median differences in percentage change in total fat (% of energy) by population |
||
|
Risk Status |
|
|
|
General risk |
12 |
–8.0 (–27.9 to –1.0) |
|
High risk |
20 |
–20.0 (–76.4 to –3.5) |
|
Median differences in percentage change in total fat (% of energy) by intervention characteristics |
||
|
Social Support |
|
|
|
Yes |
7 |
–26.7 (–76.4 to –3.5) |
|
No |
26 |
–10.4 (–44.2 to –1.0) |
|
Interactions with food |
|
|
|
Yes |
7 |
–11.0 (–26.7 to –3.2) |
|
No |
26 |
–17.8 (–76.4 to –1.0) |
|
Goal Setting |
|
|
|
Yes |
18 |
–18.9 (–44.2 to –2.7) |
|
No |
15 |
–11.0 (–76.4 to –1.0) |
|
SOURCE: AHRQ, 2001a. |
||
fruit and vegetable consumption. In general, studies in these health settings allowed retrieval of information on additional biochemical measures, including total cholesterol levels, and more intensive dietary measures (e.g., 3-day food records) that are not as frequently retrievable in other settings. These settings also allowed ongoing monitoring of at-risk groups.
A paper published subsequent to publication of the literature review in the AHRQ Diet Report extended these findings by showing both reduced levels of dietary fat intake and increased levels of fruit and vegetable consumption after an individualized intervention delivered by personalized mailings, standard dietary information, and personalized phone calls (Kristal et al., 2000a).
In summary, behavioral interventions tested in health care settings can have a significant impact on the dietary intakes of participants. These settings allow the targeting of participants at risk for disease, who may be more willing to engage in behavioral change, and offer an ideal environment for the monitoring of individuals.
Worksite Interventions
Worksites offer an environment in which effective behavioral changes can be promoted among large populations (Minkler and Wallerstein, 1997). Several studies used models of participatory research and included individuals from the worksite in the intervention development process. Although the levels of intensity of the interventions and the levels of participation in the interventions varied, those that were most successful used multiple strategies across multiple levels (the individual, the family, and the environmental levels).
According to the Diet Report’s review of worksite studies (Agency for Healthcare Research and Quality, 2001a), fat intake was the primary outcome measured in three studies (Bauer et al., 1985; Sorensen et al., 1992; Strychar et al., 1998), fruit and vegetable consumption was the primary outcome measured in one study (Buller et al., 1999), and five studies addressed fat intake and fruit and vegetable consumption combined (Anderson and Dusenbury, 1999; Hanlon et al., 1995; Sorensen et al., 1992, 1996; Thompson et al., 1999; Tilley et al., 1999a). Interventions were delivered by a diverse group of professionals, including dietitians (n = 3 studies), doctors or medical staff (n = 2 studies), and peers or counselors (n = 2 studies). Family components were included in at least three studies (Bauer et al., 1985; Sorensen et al., 1992; Tilley et al., 1999a). Environmental changes such as increasing the availability of healthy food choices and labeling of foods were notable in two studies (Sorensen et al., 1992, 1996).
Multiple behavioral components were included in interventions addressing fat intake only. Four studies incorporated multiple theoretical perspectives into their intervention designs, including community organization and activation theories, social and adult learning theory, stages of change, social support, and the health belief model (Kristal et al., 2000b; Sorensen et al., 1992, 1996; Strychar et al., 1998). For example, the Treatwell study incorporated employee advisory boards to plan interventions that included organized screenings, courses, goal setting, and cafeteria modifications, in addition to a family component (Sorensen et al., 1992). The Working Well study included interactive activities and contests plus multiple environmental changes, such as altering food choices in vending machines, with significant effects on the levels of both fruit and vegetable consumption and fat intake (Sorensen et al., 1996).
The Next Step Trial targeted both fruit and vegetable consumption and fat intake for change. Strategies reflected various theoretical perspectives and included nutrition classes, individualized feedback on intakes, mailed self-help materials, and a family component to enhance home support for change (Kristal et al., 2000a; Tilley et al., 1999a). Measurements obtained from a food frequency questionnaire indicated at the 1-year follow-up that the intervention groups had significantly increased their levels of fruit and vegetable consumption and lowered their total level of fat intake. However,
at the 2-year follow-up, there were no significant effects between groups for any of the dietary outcomes.
The Seattle 5 a Day Worksite Program randomized 28 worksites that had cafeterias and intervened in 14 sites with changes in the work environment and programs and activities targeting individual behavior change. Significant improvements in fruit and vegetable consumption were observed at the 2-year follow-up point (Beresford et al., 2001).
School-Based Interventions
Schools have been the setting for population-based interventions designed to lower the levels of fat intake and improve the levels of fruit and vegetable consumption of elementary and middle school children. As cited in the AHRQ Diet Report (Agency for Healthcare Research and Quality, 2001a), fruit and vegetable consumption was the focus of five school-based studies (Baranowski et al., 2000; Nicklas et al., 1998; Parcel et al., 1989; Resnicow et al., 1992), fat intake was the focus of four studies (Baxter et al., 1997; Harrell et al., 1996, 1998; Simons-Morton et al., 1991; Walter et al., 1988), and the combination of fruit and vegetable consumption and fat intake was the focus of three studies (Luepker et al., 1996; Perry et al., 1998a; Resnicow et al., 1992, 1998).
School-based interventions have generally focused on changing the dietary intakes of children in school settings in multiple ways, including through (1) one-to-one classroom instruction by teachers; (2) environmental change via modification of the foods served by the school cafeteria; and (3) family support through involvement in diet-related homework, activity packets, or group meetings (e.g., Gimme 5 [Baranowski et al., 2000], the Child and Adolescent Trial for Cardiovascular Health (CATCH) study [Luepker et al., 1996], 5 A Day Power Plus [Perry et al., 1998b]). For example, Parcel and colleagues (1989) included modeling, self-monitoring, and food demonstrations to enhance fruit and vegetable consumption, in addition to changes to the cafeteria environment. The Gimme 5 program attempted to improve fruit, juice, and vegetable consumption with changes to classroom curriculum and educational materials and programs for children and their parents (e.g., newsletters, videotapes, and point-of-purchase education) (Baranowski et al., 2000). Nicklas and colleagues (1998) included a media campaign with classroom, school lunch, and parental interventions. Finally, Perry and colleagues (1998b) collaborated with community food industries and the family and used other intervention components. In general, school-based behavioral interventions have yielded improvements in levels of fruit and vegetable consumption (Agency for Healthcare Research and Quality, 2001a). Studies such as the Cardiovascular Health in Children (CHIC) trial have also achieved significant reductions in total serum cholesterol levels (Harrell et
al., 1998). Finally, the Child and Adolescent Trial for Cardiovascular Health (CATCH) has demonstrated that school-based interventions can influence the dietary behavior of a child by influencing the school lunch and physical education environments (Nader et al., 1999; Perry et al., 1998a; Stone et al., 1996).
In summary, schools are an important environment where dietary behaviors in youth can be addressed. Schools are where children spend a large amount of their time, offer a system for reaching students in a defined setting that allows environmental change, and can involve the family through extracurricular activities. School-based interventions across multiple levels of the ecological model can result in significant improvements in the levels of fruit and vegetable consumption by children and reductions in the levels of fat intake. The need to create innovative programs that encourage additional parental involvement and environmental changes at home continues to be important for future work.
Community-Based Interventions
The AHRQ Diet Report denotes 24 community-based studies that address dietary behavioral change at the community level (Agency for Healthcare Research and Quality, 2001a). Of these, 10 addressed fat intake as the primary outcome (Baranowski et al., 1990a; Domel et al., 1993, Campbell et al., 1999b; Cox et al., 1995; Jaycox et al., 1983; Nader et al., 1983, 1989; Simmons-Morton et al., 1998; Stern et al., 1976; Stolley and Fitzgibbon, 1997; Turnin et al., 1992), six addressed fruit and vegetable consumption (Campbell et al., 1999a; Cullen et al., 1997; Havas et al., 1998; Lutz et al., 1999; Marcus et al., 1998a,c), and nine addressed fruit and vegetable consumption and fat intake combined (Brug et al., 1996, 1998, 1999; Fitzgibbon et al. 1996; Hartman et al., 1997; Knutsen and Knutsen, 1991; Pierce et al., 1997; Rodgers et al., 1994; Tudor-Smith et al., 1998). The Stanford Three-City Study primarily defined communities by geographical location (Farquhar et al., 1984). More recently, studies have recruited participants from community-based organizations, such as Girl Scout troops (Cullen et al., 1997), clinics that sponsor participants in the Special Supplemental Food Program for Women, Infants, and Children (WIC) (Havas et al., 1998), cancer registries (Marcus et al., 1998b), churches (Campbell et al., 1999a), and participants recruited from health maintenance organizations (Lutz et al., 1999).
Several studies targeted outcomes related to changes in levels of fruit and vegetable consumption with individual change strategies (e.g., goal setting) and inclusion of family components (Baranowski et al., 1990a; Fitzgibbon et al., 1996; Jaycox et al., 1983; Knutsen and Knutsen, 1991; Nader et al., 1983, 1989; Stolley and Fitzgibbon, 1997). Peer or lay approaches have been used to deliver interventions in multiple studies (Cullen
et al., 1997; Havas et al., 1998). For example, Havas and colleagues (1998) worked with WIC participants and trained peer educators to deliver education sessions and food demonstrations to enhance fruit and vegetable consumption. Discussion groups and mailings were also included, resulting in a significant increase in the levels of fruit and vegetable consumption by the intervention participants (0.56 versus 0.13 daily servings). Cullen and colleagues (1997) recruited Girl Scout troops and used nutrition classes, self-help materials, tasting sessions, and parental information sheets to encourage home support. This resulted in significant increases in levels of fruit and vegetable consumption. Other studies targeting changes in levels of fruit and vegetable consumption have reached the community through communication systems. Marcus and colleagues (1998c) delivered telephone messages based on participants’ stage of change and offered follow-up mailings that resulted in improvements in the rates of adherence to the Five-a-Day program guidelines. Another intervention that included one call followed by two mailings to the home yielded significant improvements in the intervention group at the initial follow-up and at 4 weeks and 4 months of follow-up (Marcus et al., 1998a).
Interventions designed to decrease levels of fat intake have also used multiple components. The Stanford Three-City Community Study used variations of intensive instruction on diet and other cardiovascular risk factors and an extensive media campaign (Farquhar et al., 1984, 1990; Fortmann et al., 1990). Results showed significant decreases in the levels of saturated fat intake between the intervention and the control groups.
Several studies that have addressed fruit and vegetable consumption and fat intake combined have examined more intensive interventions, such as home visits with newsletters (Knutsen and Knutsen, 1991) and weekly classes or sessions (Fitzgibbon et al., 1996; Hartman et al., 1997), and minimal interventions such as computer-tailored letters (Brug et al., 1996, 1998, 1999) or telephone counseling (Pierce et al., 1997). Rodgers and colleagues (1994) altered supermarket environments to promote a significant positive dietary message. The North Karelia project used a range of interventions, from mass media educational campaigns to cooperation with agricultural and food merchandising groups, to improve the availability of healthy alternatives such as low-fat milk (Puska et al., 1985). The Minnesota Heart Health program and Project LEAN also used public-private partnerships to enhance the delivery of the dietary campaign message, further expanding on this collaborative concept (Heimendinger et al., 1996).
Community-based behavioral interventions have been effective in promoting dietary change. These programs have targeted change across multiple levels. In addition, they are more frequently delivered by non-professional, lay, or peer educators, ensuring ongoing resources and the development of a community capacity for ongoing dietary change.

SOURCE: Agricultural Research Service, USDA. Photo by Scott Bauer.
Programs to Reach Underserved and Minority Populations
Among African Americans, diet may be an area of special vulnerability (World Cancer Research Fund and American Institute for Cancer Research, 1997). African Americans, particularly those living in rural communities, report poorer dietary intakes (Baranowski et al., 2000; Johnson et al., 1994; Lillie-Blanton et al., 1996; Schonfeld-Warden and Warden, 1997). Also, programs that promote healthy diets have not worked as well for African Americans as they have for other groups.
The availability of fruits and vegetables is a substantial predictor of intake (Hearn et al., 1998), and the availability of fruits and vegetables is lower in rural communities than in other areas. Additionally, the low levels of educational attainment and the limited literacy skills often found among individuals in minority and rural communities may result in limited exposure and receptivity to health messages designed for better-educated, urban groups (Kirby et al., 1995). This association is not limited to the United States and has also been reported in England (Margetts et al., 1998).
Community-based organizations have tested interventions in several population groups. Fitzgibbon and colleagues (1996) recruited Hispanic families from literacy training programs and offered a culturally specific curriculum over 12 weeks designed to improve both fat intake and fruit and vegetable consumption (Fitzgibbon et al., 1996). Stolley and Fitzgibbon (1997) recruited low-income mothers and daughters from a tutoring program to receive a low-fat, multicomponent intervention. Significant reductions in total fat intake were noted for both mothers and daughters. Auslander and colleagues (Auslander et al., 2000; Haire-Joshu et al., 1999) used a stage-based, personalized intervention implemented by peers and offered to overweight, low-income African-American women through a local neighborhood agency. The results showed significant benefits in terms of increased skills in the interpretation of food labels and improved knowledge of nutrition and the fat contents of foods.
Church-based approaches have also been effective in reaching ethnically diverse groups. A church program in Samoa used community-based organization approaches to program development and was successful in reducing waist circumference and eliminating weight gain in those at high risk for diabetes (Simmons-Morton et al., 1998).
A combination of church- and community-based approaches had promising effects on helping African-American participants consume a healthy diet (Campbell et al., 1999a). In each county randomized to the intervention, the pastors of local churches appointed a three- to seven-member Nutrition Action Team that was “responsible for organizing and implementing many of the program activities” (Campbell et al., 1999a, p. 1391). The intervention itself “used an ecological framework, targeting activities at the individual, social network, and community levels” (p. 1391). It included tailored bulletins and other print materials; group activities such as gardening, educational sessions, and personal recipe tasting; and the serving of more fruits and vegetables at church functions. To reinforce healthy eating habits, the program also included lay health advisers, pastor support, and community-based coalitions (these coalitions were located within each county and were composed of church members, representatives of local agencies, farmers, and grocers) and distributed materials through local grocers. Reflecting the strong community focus of the program, individual churches were also encouraged to implement their own activities, in addition to the planned intervention. These included “5-a-Day Sundays,” gospelfests, and events for youth. The intervention lasted 20 months. It resulted in a significant difference (0.85 servings of fruits and vegetables per day) between the counties that received the intervention and the counties that received delayed treatment.
Members of minority and low-income groups can be reached effectively at worksites, and individuals who are members of important social networks at worksites can be used to influence the dietary behaviors of their co-workers. For example, Buller and colleagues (1999) encouraged
the intake of five servings of fruits and vegetables per day via peers and managers at worksites with blue-collar workers. Informal social networks or cliques were used as a structure for the program. Workers from informal networks were trained to provide program interventions for their colleagues in those networks. The intervention included various print media and information sessions conducted by peer educators for large and small groups and included ethnically specific messages that encouraged the participants to increase their levels of fruit and vegetable consumption. In addition, the work environment was modified (through the use of cafeteria promotions). The intervention was found to have significant effects at 18 months (an increase of 0.77 servings) and 24 months (an increase of 0.41 servings) by use of dietary recall as the measurement method. However, use of food frequency methods showed a different effect at 18 months, but the effect remained significant (an increase of 0.46 servings); at 24 months there was no significant effect (an increase of 0.04 servings).
THE HEALTH CARE SYSTEM AND BEHAVIOR RISK REDUCTION
Health care organizations and settings and the providers who work in them have extraordinary opportunities to affect the health of a large percentage of people who are at risk for cancer. In 2000, 72 percent of U.S. adults reported going to a doctor’s office or clinic to get care in the past year (Agency for Healthcare Research and Quality, 2001b), with this contact providing opportunities to offer counseling and other interventions. In addition to the high rate of contact, providers who are credible sources of health-related information frequently provide care on a regular basis in primary care settings. All types of clinicians—physicians, nurses, nurse practitioners, dentists, psychologists, pharmacists, health educators, dietitians, and many others—can effectively deliver prevention messages and prevention counseling (Fiore et al., 1996, US DHHS, 2000a).
Opportunities for the promotion and delivery of cancer prevention and control services can be found in a variety of locations where health care is delivered, including private physician office practices, integrated delivery systems or staff model health maintenance organizations (HMOs), and public health clinics. Health care providers in ambulatory health care settings have unique opportunities to promote the use of cancer prevention and early detection services; however, levels of access to such providers are not uniformly high. In 1998, the vast majority of individuals relied on doctors’ offices and HMOs (70 percent) and on clinics or health centers (16 percent) for their routine and preventive care (1998 National Health Interview Survey, special tabulations by National Cancer Policy Board staff). A significant segment of the adult population (11 percent) reported that they did not have a usual source of routine care, which points to the limits of
interventions aimed at health care professionals to improve access to cancer prevention and early detection services.
As summarized in the previous sections, there is evidence of the effectiveness of interventions for smoking cessation, physical activity, and dietary modification delivered in health care settings. Unfortunately, there has been little integration of these interventions into routine health care delivery. According to surveys with patients and providers, behavior risk factors are not routinely addressed.
With regard to tobacco use, only about one-half of patients who smoke report that they have received advice to quit (Doescher and Saver, 2000; Anda et al., 1987; CDC, 1993; Frank et al., 1991; Gilpin et al., 1993; Goldstein et al., 1997; Kottke et al., 1997; Pierce and Gilpin, 1994; Rogers et al., 1997; Thorndike et al., 1998) and far fewer report that they have received any smoking cessation assistance or follow-up (Goldstein et al., 1997; Rogers et al., 1997), as recommended by both the current clinical practice guidelines for tobacco treatment (US DHHS, 2000a) and the Healthy People 2010 objective (US DHHS and Office of Disease Prevention and Health Promotion, 2000). The type of visit affects the rate of smoking intervention, with more interventions occurring during well visits than during acute care visits and with more interventions occurring for smokers with chronic tobacco-related illnesses than for smokers with non-tobacco-related illnesses (Jaen, 1997; Jaen et al., 1997, 1998; Sesney et al., 1997; Stange et al., 1994; Thorndike et al., 1998; Frame, 1995). The general infrequency of well visits and patients not being ready to stop smoking may help explain the less than desirable rates of smoking cessation interventions by physicians. Recent clinical practice guidelines call for intervening with all smokers at all visits, whether or not the visit is for an illness caused or complicated by tobacco use (US DHHS, 2000a). Despite evidence of the effectiveness of physician-delivered smoking interventions, physicians may view them as ineffective because of their clinical experience, in which only about 5 percent of patients advised to quit will do so in the course of a given year (Warner, 1998).
National data on the prevalence of provider provision of counseling to modify the diet as it relates to cancer prevention are lacking. Healthy People 2010 Objective 19-17 is to increase to 75 percent the proportion of physician office visits made by patients with a diagnosis of cardiovascular disease, diabetes, or hyperlipidemia that include counseling or education related to diet and nutrition (US DHHS and Office of Disease Prevention and Health Promotion, 2000). Although this objective does not relate specifically to provider counseling for cancer prevention, it is the only Healthy People 2010 objective that addresses provider counseling to modify the diet.
It is difficult to gauge the prevalence of diet modification counseling specific to cancer prevention or even general nutrition counseling (e.g., to
decrease dietary fat intake, increase levels of consumption of fruits, vegetables, whole grains, and fiber, and limit red meat consumption) because available studies are based on provider practices in specific regions, organizations, or subpopulations and many of the studies suffer from low response rates. According to studies with acceptable response rates (above 60 percent) patients reporting that physicians offered dietary counseling ranged from 14 to 70 percent (Hunt et al., 1995; Kreuter et al., 1997; Taira et al., 1997). The rates of provision of diet modification counseling in selected studies that relied on physician self-report are somewhat higher, ranging from 66 to 79 percent (Glanz et al., 1995; Kushner, 1995; Ashford et al., 2000). On the basis of direct observation, the prevalence of counseling to modify the diet to reduce the risk of cancer ranged from 9 to 43 percent (Stange et al., 2000; Stange et al., 1998; Russell and Roter, 1993).
Roughly one-third (34 percent) of individuals who had visited a physician in the past year were counseled by the physician to begin or to continue any type of exercise or physical activity, according to estimates from the 1995 National Health Interview Survey (Wee et al., 1999). Estimates of the prevalence of physical activity counseling by providers range from 13 to 36 percent according to studies in which providers in health care settings were directly observed as they provided care (Podl et al., 1999; Russell and Roter, 1993; Stange et al., 1998; Stange et al., 2000). There is a tendency for primary care providers to discuss secondary prevention rather than focus on primary prevention (Wee et al., 1999). Although the goal is to have primary care physicians conduct primary prevention counseling, patients who have disease are more likely to be counseled about physical activity (Podl et al., 1999; Rosen et al., 1984; Wee et al., 1999), and the more risk factors a patient has, the more likely it is that the patient will be counseled (Kreuter et al., 1997). The lack of a standard protocol has been identified as a barrier to carrying out physical activity counseling (Gemson and Elinson, 1986; Orleans et al., 1985).
How a clinical practice is organized, its delivery capacity, and its manual and computerized administrative support systems can greatly affect a provider’s ability to deliver preventive health care in general and address behavioral risk factors specifically. Medical chart prompts, checklists, and reminders improve the physician’s ability to identify a patient’s needs and behavioral risk factor counseling rates (Chang et al., 1995; Cohen et al., 1989; Cummings et al., 1989a,b; Fiore, 1991; Fiore et al., 1995; McIlvain et al., 1992; Ockene et al., 1996; Robinson et al., 1995; Solberg et al., 1990; Strecher et al., 1991). Smoking status designated as a vital sign on the chart increases the rate at which physicians ask their patients about smoking, discuss or advise cessation, and arrange a follow-up appointment or referral to a stop smoking program (Ahluwalia et al., 1999; Robinson et al., 1995). Most studies of the effects of computerized systems demonstrate that physicians who use such systems counsel their patients about changes
in health behaviors at higher rates (McPhee et al., 1991; Ornstein et al., 1995). Computer-based reminder systems offer a quick and easy way to monitor patients (Frame and Werth, 1993), but such systems require considerable institutional commitment and resources.
Health risk appraisals (HRAs) provide individualized estimates of health risks and can be used as part of behavioral counseling in primary care settings. The evidence that HRAs improve rates of provider counseling is conflicting, with some showing improvements (Geiger et al., 1993; Gemson and Sloan, 1995) and some not noting such improved rates (Smith et al., 1985).
Periodic chart audits have been used as part of continuous quality improvement (CQI) initiatives as a way of assessing provider performance to provide feedback and improve compliance with clinical practice guidelines (Shortell et al., 1995). Trials of the effectiveness of CQI in improving prevention services have largely been negative (Solberg et al., 2000).
The need for multiple strategies is embodied in the U.S. Public Health Service clinical practice guideline for the treatment of tobacco use and dependence (US DHHS, 2000a). It emphasizes that, without supportive systems, policies, and environmental prompts, it is unlikely that the individual clinician will routinely assess and treat tobacco use. These guidelines include six strategies for systems-level interventions, modified here to encompass multiple behavioral risk factors:
-
implement a behavioral risk factor identification system in every clinic;
-
provide education, resources, and feedback to promote provider delivery of an intervention;
-
dedicate staff to provide treatment and include assessment of the delivery of this treatment in performance evaluations;
-
promote policies within the organization that support and provide behavior change treatment services;
-
include effective behavior change treatment as paid or covered services; and
-
reimburse clinicians and specialists for delivery of effective behavior change treatments and include these treatments in the defined duties of clinicians.
In addition to practice-specific factors, certain characteristics of the contemporary ambulatory care environment may not be conducive to preventive care practices (1998 National Ambulatory Medical Care Survey and 1998 National Hospital Ambulatory Medical Care Survey, special tabulations, NCPB staff):
-
Prevention services are optimally provided in the context of routine health care visits or checkups, but such non-illness-related visits are rela-
-
tively unusual, making up 17 percent of the estimated 717.6 million ambulatory care visits made by adults in 1998.
-
Prevention services are more likely to be provided when patients see their primary care physician, but less than half (44 percent) of ambulatory care visits made by adults in 1998 were to a patient’s primary care provider.
-
Counseling about risk behaviors such as smoking cessation or describing the pros and cons of screening procedures can be time-consuming, yet most adult patients (63 percent) spend less than 15 minutes with the physician during their ambulatory care visits.
-
During ambulatory care visits, adult patients generally spend time with physicians, but they also see other providers, although they see them less often. Patients see, for example, nurses, nurse practitioners, or physician’s assistants, but these encounters occur during roughly only 20 percent of ambulatory care visits. These nonphysician providers can be important sources of counseling services, even though they are not frequently encountered.
One of the reasons most frequently cited by clinicians for not implementing prevention services is a real or perceived lack of time given the other demands of a primary care practice (Ashford et al., 2000; Battista and Mickalide, 1990; Burns et al., 2000; Cooper et al., 1998; Dunn et al., 2001; Jaen et al., 1994; Kottke et al., 1993; Kushner, 1995; Rafferty, 1998; Walsh et al., 1999). Responses to the patient’s presenting complaints and concerns often take precedence (Burns et al., 2000; McBride et al., 1997; Stange et al., 1994). The total amount of time needed by the physician to deliver effective preventive services may not be prohibitive. Physicians can, for example, initiate a smoking cessation intervention, and this can be followed by provision of most of the intervention and follow-up by another clinician (e.g., a nurse, a nurse practitioner, or a physician’s assistant). Physicians can deliver prevention services at high rates and still have a productive practice, as defined by relative value units, when formal systems for the delivery of prevention services are implemented (Kottke et al., 1993).
Systems of care may reduce institutional or organizational barriers to the use of prevention services with strategies that facilitate a usual source of care or a “regular doctor,” the centralization of services, or the provision of an integrated structure (e.g., a centralized screening program [Thompson et al., 1995]), a requirement for minimal patient copayments for members, or reduction of clinicians’ financial disincentives (Gordon et al., 1998; Weinick and Beauregard, 1997). Financial incentives, management strategies, the physical plant, and normative influences of colleagues can all interact to facilitate or hinder the provision of preventive services (Malin et al., 2000).
Organizational characteristics of HMOs might contribute to the relatively high rates of use of prevention services, for example, dedicated behav-
ioral health programs, innovative use of personnel including nurse practitioners and health educators (Mullen and Zapka, 1982; Palitz et al., 1997), consumer expectation (Jordan et al., 1995; Trnka and Henderson, 1997), and systems of accountability (Box 4.3.). Although the model program described in Box 4.3. focuses on tobacco, its key elements are readily generalizable to other health behaviors. The most prominent effort to define and measure plan performance has been the National Committee for Quality Assurance’s Health Plan Employer and Data Information Set (HEDIS®) (http://www.ncqa.org/programs/hedis/index.htm; Corrigan and Nielsen, 1993). This set of standardized performance measures helps purchasers and consumers reliably compare the performance of managed health care plans. In 2000, 273 organizations (health maintenance organizations, point-of-service plans, and other managed care plans) that collectively cover 63 million individuals voluntarily submitted performance data. In 2000, the median rate of advising smokers to quit reported by plans was 66 percent (National Committee for Quality Assurance, 2001). Expansion of measures to include obesity prevention and treatment and the promotion of physical activity could be considered.
A disincentive for providers to provide preventive services is a lack of, or inadequate, reimbursement. The Medicare program, for example, does not provide reimbursement for smoking cessation services. Other barriers to the provision of prevention services are more subtle. The benefits of effective prevention interventions may be viewed by physicians and health care systems as abstract because the costs in terms of time and finances are incurred up front, but the benefits may not be seen for years or decades (Ockene and Ockene, 1992).
SUMMARY AND CONCLUSIONS
Interventions to modify tobacco use, diet, and physical activity have substantial similarities in terms of their effectiveness. Separate educational, psychological, and behavioral models for interventions for each behavior are not needed. Rather, behavioral change efforts need to focus on common models that emphasize the skills needed for behavioral change, diverse and sustained interventions, and social and other forms of support for the maintenance of behavioral changes.
Two levels of intervention are generally found to be effective for all three preventive behaviors reviewed in this chapter. One level entails well-defined interventions delivered to individuals, such as counseling and prescription drugs for smoking cessation. The second level entails comprehensive, multicomponent, multichannel programs directed to large groups, for example, the statewide tobacco control programs that have emerged in the last decade. This finding is consistent with that of IOM’s Committee on Health and Behavior: Research, Practice and Policy. They concluded that “health and
|
BOX 4.3 A Model Tobacco Control Program in an HMO Group Health Cooperative (GHC) of Puget Sound is a large group model health maintenance organization established in 1947. The GHC program for smoking cessation targets interventions at three levels (Curry, 1998). On the practice setting level, interventions include self-help booklets, outreach telephone counseling, and group sessions. Several other interventions were prompted by the development and implementation of an evidence-based smoking cessation guideline. Training and ongoing consultation, patient questionnaires, education materials, chart stickers, vital sign stamps, patient flow sheets, and chart audit protocols are used. Staffing for guideline implementation includes full-time employee support for physicians, health educators, and an implementation coordinator who works in the primary care clinics to assess staff readiness to implement the guideline, arrange appropriate education and training and follow-up for staff, facilitate ownership for the guideline, and encourage progress in tracking through the use of chart audits and feedback reports. On the systems level, GHC tracks the percentage of audited charts with documentation of tobacco use status. GHC’s benefits committee in 1992 approved a tobacco services benefit that went into effect in 1993. The benefit included access to the Free and Clear behavioral program with a 50 percent copayment and with nicotine replacement therapy fully covered for smokers who participate in the Free and Clear program (there is no coverage for nonparticipants). Implementation of this benefit resulted in a 10-fold increase in program attendance. GHC experimented with benefit design and learned that even with full coverage and the use of multiple strategies to enhance use of the benefit, the annual rate of use of the benefit among smokers was about 11 percent (Curry, 1998). The following strategies to increase the reach of their tobacco cessation services are being implemented:
On the community and external environment levels, GHC has been involved in the formation of community coalitions, educational appearances on radio and television and in the print media, and community policy development (Thompson et al., 1995). Along with other health organizations, voluntary and state agencies, and tobacco control groups, GHC created the Washington Alliance for Tobacco and Children’s Health to conduct lobbying and media advocacy. These actions led to plans for a tobacco trust account in Washington State with Tobacco Master Settlement Agreement funds (McAfee, 2000). The GHC program has evolved over a period of about 15 years, demonstrating that development of multilevel programs takes considerable time, planning, and resources (Curry, 1998). |
behavior are influenced by factors at multiple levels, including biological, psychological, and social. Interventions that involve only the person—for example, using self-control or willpower—are unlikely to change long-term behavior unless other factors, such as family relationships, work situation, or social norms, happen to be aligned to support a change” (IOM, 2001a).
A striking finding is the recurrent demonstration of the importance of interventions that combine several different channels of information or types of influence, are sustained, and address self-management or behavioral skills for the identification and attainment of personal goals and for the avoidance of temptations that would undermine those efforts.
A number of effective behavioral interventions exist, but no “magic bullet” or particular intervention is remarkably more effective than others. Additionally, different interventions may be effective in achieving similar goals. Thus, counseling as part of the delivery of primary heath care, mass media campaigns, and messages tailored to those not yet ready to change their behaviors may each be effective in reaching individuals and helping motivate change. Individual counseling, group programs, or self-help materials may each be effective in helping people plan their lifestyle changes and master behavioral self-management skills to avoid relapse. Follow-up from professionals, from trained volunteers, or through print or other media may help those who have changed their behavior maintain the healthy behavior.
To be successful, behavioral health interventions delivered in health care settings must overcome the principle barriers that confront providers and health care systems. The greatest barriers to providers’ delivery of smoking cessation counseling are lack of education and training, limitations of time and practice setting systems, poor reimbursement levels, and a perceived lack of success with patients who smoke. For diet and physical activity, an additional critical barrier is the lack of clear guidelines regarding recommendations for cancer control.
The potential for combinations of effects and the importance of the use of multiple approaches underscore the need for the use of comprehensive approaches. There are many different effective interventions, and their aggregate effects may not be captured by the evaluation of each one in isolation. Comprehensive programs that combine different intervention methods and channels have appreciable effects on all key behaviors for the prevention of cancer (CDC, 1999a; Rimer, 1997). Within such comprehensive programs, no single intervention method or channel is necessary or sufficient, but several different sets of strategies and methods may achieve comparable results. What is important is the overall strategy of combining multiple methods and channels.


