
5
Project Reporting and Oversight
INTRODUCTION
The Phase II report (NRC, 1999) concluded that DOE has no acceptable financial and project reporting system and recommended that DOE establish such a system to provide the data necessary for each level of management to track the cost, schedule, and scope of all projects and to support the statistical analyses necessary for process improvement. Each PSO has its own active project reporting system, and OECM has completed a specification for a department-wide project analysis and reporting system (PARS). A beta version of PARS was released in June 2000 and is being reviewed and improved. The committee supports this initial step but is concerned that the system does not include analysis or automatic data collection tools. The committee believes that the PARS should be designed so that it supports the data analysis needed by project managers to evaluate project performance as well as the oversight needs of the PSOs, OECM, CFO, and the deputy secretary. The database should also provide the information needed for benchmarking future projects.
Effective oversight of project performance is dependent on the systematic and realistic reporting of project performance data. The committee has observed some resistance in the field to changing or adding reporting practices to conform to a uniform system. Clearly, organizations within DOE have become accustomed to different types of reports that satisfy their needs, and these legacy systems should be taken into consideration when designing a new reporting system. Successful implementation of any management information system requires knowledge and consideration of the needs and preferences of the users. A critical
factor in the success of a reporting system is that those who are burdened with the input of data should also receive some benefits from doing so in an accurate and timely manner. For quality and consistency, it is necessary that each data element be input only once, as close to the source as possible. A schedule to phase in reporting requirements in a manner that does not disrupt ongoing projects or cause unnecessary costs may be needed. Reporting cost data on an accrual accounting basis, rather than a cash basis, is critical for tracking and managing planned and actual cost information in any management information system. At present, accrued cost information is not generally available throughout DOE.
ANALYSIS OF EARNED VALUE MANAGEMENT SYSTEM DATA
OECM has reported that PARS will display earned value management system (EVMS) data on projects, but the accrued cost accounting system to support EVMS reporting must first be implemented. The OECM presentation indicated that project oversight is to be accomplished by plotting the budgeted cost of work scheduled (BCWS), the budgeted cost of work performed (BCWP), and the actual cost of work performed (ACWP) versus time. The example used in the OECM briefing is for the Tritium Extraction Facility (TEF) at the Savannah River site. The plot of BCWS, BCWP, and ACWP versus time for this project is reproduced here as Figure 5–1. These conventional forms of data presentation
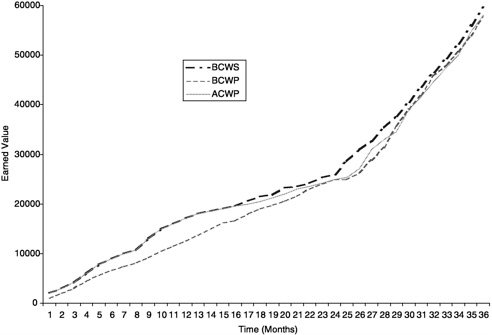
FIGURE 5–1 Cumulative earned value data for the Tritium Extraction Facility.
show the cumulative BCWP and ACWP, which tend to obscure the magnitude of current changes. For all but the very early phases of a project, the cumulative BCWP and ACWP numbers are largely determined by project history and very little by current events. It would take a substantial change in any single reporting period to have any visible effect on the cumulative BCWP and ACWP. Moreover, any differences from period to period are shown only as changes in slope, which are difficult to see. The plots serve to show whether the ACWP curve is consistently over or under the BCWP curve, and the BCWP curve over or under the BCWS curve, but little else. The plot in Figure 5–1 shows that it is easy to discern long-term trends after they have happened (for example, the BCWP is well below the BCWS in the first year or so) but very difficult to discern what is happening currently, owing to the necessary scale of the plot and the inertial effect of past history.
Two nondimensional indexes, the schedule performance index (SPI=BCWP/ BCWS) and the cost performance index (CPI=BCWP/ACWP), can also be readily plotted. Current performance, as gauged by these indexes, is also obscured by the inertia of past history. Examination of the SPI and CPI values for a number of DOE projects indicates that almost all of them habitually fall between 0.95 and 1.05. In many cases, it seems that these results are due to continual rebaselining of the project budgets, so that the reports can show CPIs of approximately 1.0. As one example, the SPI and CPI values for the National Ignition Facility (NIF) project were reported to the committee in February 2001 as very close to 1.0. This shows that as long as there is rebaselining, through properly processed change control actions, the reported SPIs and CPIs provide little information and in fact may be misleading. The contingency utilization index, discussed below, would reflect the change as a debit to the contingency.
PROJECT OVERSIGHT
DOE management needs to be able to detect potentially adverse trends in project progress and to distinguish them from mere random fluctuations in reporting. Senior management needs data to decide when intervention is necessary to correct an adverse trend and when no intervention is needed.
One approach to meeting these two needs is to extract more useful and up-to-date information from the EVMS data and to analyze it using the well-known methods for statistical process control (SPC) charts. SPC (or SQC, statistical quality control) has been used in the manufacturing industries for at least 70 years (Shewhart, 1931) and was the driving force behind the rebuilding of the Japanese manufacturing industry in the 1960s. The use of control charts for the analysis of EVMS data is discussed briefly in Appendix E.
CONTINGENCY UTILIZATION INDEX
Because many DOE projects involve first-of-a-kind or one-of-a-kind applications of technologies and/or project teams not necessarily accustomed to the management of complex projects or R&D programs, it is recommended that DOE incorporate an additional index into its EVMS reporting system. This is the contingency utilization index (GUI). The GUI is defined as the contingency remaining at any point in time divided by the estimated cost to complete at that time. At the start of the project, before any work is done, this index reduces to the assigned project contingency, or risk-adjusted cost estimate (RACE) less the budget at completion (B AC) divided by the budget at completion. A formula that can be used at any time t and that reduces to CUI=(RACE-BAC)/BAC at the start, when t=0, is the following:
CUI=[RACE–BAC+BCWP(t)–ACWP(t)]/[BAC/CPI(t)–ACWP(t)]
where RACE–BAC=the original contingency; ACWP(t)–BCWP(t)=excess (if any) of actual cost over budgeted cost (i.e., contingency used up); BAC/CPI(t) –ACWP(t)=estimate to complete; CPI(0)=1; and ACWP(0)=BCWP(0)=0.
As the work progresses, the CUI is adjusted to reflect the status at each period, and it can be plotted to compare the planned CUI over the period of the project with the actual values reported. In addition to stating the current CUI, each period report should state the purposes for which the contingency has been utilized. If the project accounting is done on an accrual basis, as recommended, this can be timely information, even preceding the completion of pending change procedures. If the information is not timely it delays recognition of important project budget and contingency utilization data and skews project performance information being reported.
The CUI should be reported in addition to the more standard measures CPI and SPI, as it is quite possible, for example, that the CUI is increasing (and therefore the contingency looks good) at the same time that the CPI is decreasing (costs are exceeding budget). Likewise, when the BCWS is adjusted through a change control action, the CUI will reflect the debiting of the contingency, thus alerting managers. The depletion of contingency might be missed if only CPI and SPI are reported.
BENCHMARKING
The Phase II report (NRC, 1999) included the recommendation that DOE should undertake project performance studies of all major construction projects and use this information to benchmark project performance and measure progress in project management. The committee had great difficulty in locating any documentation of project decisions, project management processes, and project per-
formance. The PSOs have quarterly project reporting systems in place, but they provide only summary information that is insufficient for benchmarking. The committee supports the DP initiative to participate in the annual CII project management benchmarking survey and to use the CII database to identify best practices within DOE and to compare DOE performance with that of private industry. However, all DOE projects should be benchmarked, and this benchmarking should be consistent across the department. It may not be efficient for every PSO to repeat this process independently.
MEASURING IMPROVEMENT IN PROJECT MANAGEMENT
The committee has been seeking metrics for measuring DOE improvement in project management and the efficacy of committee recommendations. The evaluation of project outcomes is an obvious metric, but this can be done only after projects are complete. Moreover, as noted elsewhere, this evaluation is made difficult because DOE often rebaselines projects. That is, one might look at the actual dates and costs at project completion, assuming the data are not adjusted by rebaselining, but virtually any project that completes during the committee’s tenure will have been started before the Phase II report. Conversely, projects that start after the date of this report will not finish until long after the committee’s term expires. Therefore, some short-term metrics are needed.
One possible metric is to examine the means and variances in the schedule performance index for a given reporting period (SPI(t)) and the cost performance index for a given reporting period (CPI(t)) for all DOE projects (see Appendix E). Because SPI(t) and CPI(t) are normalized dimensionless ratios, they are not influenced by project size or duration. Therefore, all projects can be compared on the same basis. The band between the upper and lower process limits can be considered a measure of the quality of DOE project management. If this band becomes smaller over time, then DOE project management is improving. If reasonable specification limits are set and the six-sigma process limits lie inside the specification limits, then one could say that DOE project management has achieved six-sigma quality.
OTHER METRICS
One advantage of the SPI(t) and CPI(t) run plots, as discussed above, is that the data should be readily available through the EVMS project reporting systems; no new data sources are required. Many other metrics are possible. One area that the committee specifically recommends for measurement is that of changes: engineering change requests, disposition forms, and other documentation should be standardized and reporting metrics defined so that change can be quantified. As previously discussed, the measurements should include performance and practice use metrics. Additional metrics should be identified and defined.
FINDINGS AND RECOMMENDATIONS
Finding. The committee has observed some objections to changing or adding reporting practices to conform to a uniform system. Clearly, each organization in DOE has become accustomed to its own reporting system, and these legacy systems should be taken into consideration when designing a new department-wide reporting system. Successful implementation of a management information system requires a knowledge and consideration of the needs and preferences of the users. A critical factor in the success of a reporting system is that those who are burdened with the input of data should also receive some benefits from doing so in an accurate and timely manner. For quality and consistency, it is necessary that each data element be input only once, as close to the source as possible. A schedule to phase in reporting requirements in a manner that does not disrupt ongoing projects or cause unnecessary costs may be needed.
Recommendation. DOE and its contractors should adopt full accrual cost accounting systems in order to provide EVMS and PARS with appropriate data.
Recommendation. The PARS information system for collecting data from projects department-wide should be designed so that it supports the data needs of project managers to evaluate project performance as well as the oversight needs of the PSOs, the OECM, the CFO, and the deputy secretary. The database should also provide information for benchmarking future projects.
Finding. DOE management needs to be able to detect potentially adverse trends in project progress and distinguish them from mere random fluctuations in progress reporting. EVMS data provide some very valuable insights into the health of a project and can predict the probable outcome. They can also shed light on the conduct of the work, particularly when it is reported and analyzed to evaluate period-to-period trends.
Recommendation. DOE should utilize EVMS data to calculate the incremental and cumulative cost performance index (CPI), schedule performance index (SPI), and contingency utilization index (CUI) for each reporting period to analyze and improve project performance.
Finding. The committee had great difficulty in locating information documenting project decisions, the project management process, and project performance. DP is planning to participate in the CII benchmarking survey, but there is generally not enough consistent information to allow benchmarking project management performance within DOE or between DOE and other federal agencies and private industry.
Recommendation. All DOE projects should be benchmarked within DOE and between DOE and other federal agencies and private industry, and this benchmarking should be consistent across the department.
REFERENCES
NRC (National Research Council). 1999. Improving Project Management in the Department of Energy. Washington, D.C.: National Academy Press.
Shewhart, W.A. 1931. Economic Control of Quality Manufactured Product. New York, N.Y.: Van Nostrand.


