
is predictable from what is not, and to be aware of the nonlinear effects that can upset even the most informed predictions.
SEMICONDUCTORS: THE ARRIVAL OF THE NEW ECONOMY
Bill Spencer
International SEMATECH
Dr. Spencer began with the “modest proposal” that the nation’s recent surge of economic growth was due principally to semiconductors. He invited his audience to critique that serious hypothesis and point out any errors in reasoning. He also said he would address the impact of semiconductors on other major components of information technology hardware and software. Finally, he said he would raise some questions about what might happen if the growth in technology slows.
Rapid Growth of the Industry
Dr. Spencer began by illustrating the rapid growth of the semiconductor industry from 1975 to 1995, a period when worldwide sales rose from about $4.4 billion to a peak of about $141 billion. In 1996 there was a significant drop in sales. He said he would be talking about projections out to the year 2015, which is the end of the roadmap created for the semiconductor industry.
He described a major change that had occurred in the semiconductor business over the last few decades. When he first worked in the industry, in the early 1960s, the ingots grown by his company were cut into wafers 30 millimeters in diameter; today’s commercial wafers have grown to 300 millimeters in diameter. Early semiconductor manufacturers polished the wafers and then processed them on vacuum equipment they bought and adapted themselves. Today the semiconductor equipment business alone is about a $50 billion business and the materials business is worth a little less than half of that. Much of the new technology for semiconductors in the future is going to come from those same equipment and materials suppliers. New techniques of exposing and etching finer lines or designing more transistors on a circuit will come from suppliers and not from the semiconductor industry itself.
Lower Costs and Higher Productivity
The primary reason for the growth in the industry is the drop in cost and simultaneous rise in productivity that Dr. Jorgenson discussed. He said that the growth in productivity had increased steadily by 25 or 30 percent per year since the early 1960s—and cited the saying around Silicon Valley that “every integrated circuit ultimately costs $5—except for those that cost less.”
The most important factor in productivity growth has been reduction in
feature size, made possible by lithography equipment that can produce ever-finer lines. Size reduction has accounted for nearly half of productivity growth. Yield improvement, too, has contributed a sizeable fraction, growing at 4 to 5 percent annually for a long time. Yields on integrated circuits are now above 90 percent, however, and these are achieved six to nine months after opening a new factory. Therefore, yield improvement will not be able to contribute much more to productivity growth. Wafer size will improve further, he said. Wafer diameter has risen by a factor of 10 in the last 30 years. Engineers in Japan are experimenting with 450-mm wafers, “which is the size of a large pizza.” It is a challenge to hold 1-micron uniformity on a wafer that large. The rest of the productivity gains result from other equipment changes and better processes.
Costs of DRAMs
The interesting questions, said Dr. Spencer, are what will happen if that productivity growth begins to taper off and what can be done to perpetuate the growth. He showed a graph, used by the Dell Company, of cumulative DRAM production versus cost—DRAM prices per bit—in real dollars (Figure 6). It
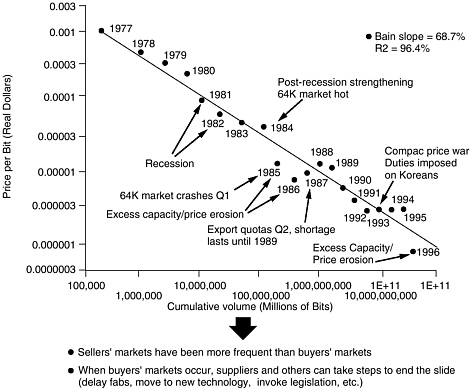
FIGURE 6 DRAM Price Per Bit.
showed that DRAM prices declined steadily from 1977 to 1992, with a flattening from 1992 to 1995. During these four years of flat prices, semiconductor sales in dollars approximately tripled, he said, and people in the memory business were making handsome profits. Then the industry entered a period of overcapacity; prices dropped precipitously between 1995 and 1996, and total sales fell about 10 percent. Dr. Spencer also attributed some of this drop to legal and international trade policies that handicapped the industry.
Costs of Microprocessors and Memory
A similar phenomenon can be seen in microprocessors, he said. A curve adapted from the semiconductor roadmap showed a drop in price per million instructions per second (MIPS) between 1980 and 1995 of 24 percent per year. The 1997 NTR Roadmap “Affordable Cost” Model predicted that for each DRAM generation of three years, cost would continue to drop steadily by half. Also illustrated was a pronounced decline in price of each new processor from the time of introduction to maturity.
A similar curve can be used to illustrate the dropping price of magnetic memories, said Dr. Spencer. In fact, the price per megabyte of magnetic memory on hard disk drives has dropped by 50 percent a year, a higher rate than semiconductors, while hard-drive density has increased at 60 percent a year.11 He said that in his opinion the drop in magnetic memory prices is largely a function of price pressure from semiconductor memory. These gains in productivity have also pushed down the prices of LCDs, keyboards, batteries, and other personal computer components. The progress in these technologies is remarkable at a time when military procurement is a minor factor and the automobile industry is growing only slowly.
A Roadmap for Semiconductors
Dr. Spencer then traced the history of the roadmap for semiconductors. The first such roadmap was designed by the National Advisory Committee on Semiconductors (NACS). This group of distinguished business and university representatives assembled by President Reagan formulated a national policy on semiconductors in the mid-1980s. At that time the U.S. semiconductor business was at its nadir and many people predicted that the industry would follow the U.S. television and consumer electronics businesses into near extinction.
NACS organized Microtech 2000, and one of their boldest proposals was to leap one whole level of technology to move directly to 1-gigabit memories by the year 2000. The semiconductor industry disliked that idea. Instead, noted Dr. Spencer,
we have reached 1-gigabit memory today—not by jumping a generation but by speeding up the generations. The first roadmap of the semiconductor industry was done in 1992, mostly by a group from SEMATECH that was chaired by Bill Howard, then at Motorola. A second roadmap was created in 1994.
The Acceleration of Moore’s Law
When the roadmap began in 1992, a technology generation had, since the 1960s, been three years in length. In 1992 the minimum feature size of a device was 500 nanometers. In 1995 the minimum was 350 nm and the roadmap predicted that it would drop to 250 in 1998. Instead, after the roadmap was created, the size dropped to 250 nm in two years instead of the customary three years. The roadmap then accelerated in 1997 and again in 1999 when 180-nanometer technology began. Thus, in a decade the industry moved from doubling the number of transistors in a given area every 18 months to doubling it every 12 months. It had raised, in effect, the pace of Moore’s Law even faster. The international roadmap predicts that this pace will continue to the year 2003 and then perhaps return to its previous three-year pace (Figure 7).
The Question of Physical Limits for Semiconductors
The plan for International SEMATECH, whose members represent 50-60 percent of the semiconductor business worldwide, is to try to stay on the two-year cycle. That goal, said Dr. Spencer, raises two interesting questions. One, are we
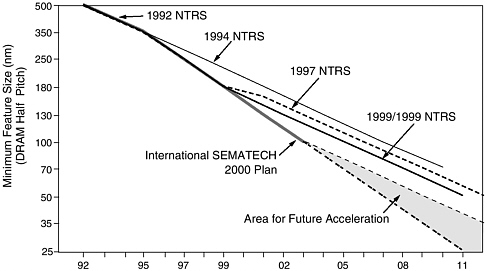
FIGURE 7 Semiconductor Roadmap Acceleration.
accelerating improvements in technology at about the same time we approach a wall of physical limits? Oxide layers on semiconductors are now only about 4 or 5 atoms in thickness, which means that atomic flatness is required over the width of the gate or the yields begin to drop. Other dielectrics may make further progress possible.
Another problem has to do with lithography, where empiricism has won out. An equation that relates resolution in lithography to the wavelength and numerical aperture of the optics has an empirical constant. Nobody knows what makes up that empirical constant, but engineers have been able to change it by a factor of two from 1995 to the present. Lithography has gained additional capability to make finer lines by using the same wavelength, something thought impossible previously, so there are still tricks that can make the hardware more efficient. No one knows how many more such tricks can be found. In addition, the software challenge of designing a billion transistors on a chip constitutes another kind of wall. Without new technology it seems only a matter of a few years before these engineering walls form an impassable barrier.
Dr. Spencer raised the question of why the semiconductor industry had decided on a two-year cycle instead of a three-year cycle. The answer to this question is not obvious other than a sense that a group of companies had discussed the matter and decided it was possible and therefore desirable. This change has put great pressure on equipment suppliers, who must now produce a new generation of equipment every two years instead of every three years.
The Rapid Market Penetration of Computers and Internet Access
Dr. Spencer showed a graph that compared the growth rates of homes in the United States that had access to electricity, television, telephones, cars, and radio with the growth rates of homes that had access to computers and the Internet (Figure 8). Both computers and the Internet are growing at approximately the same rapid rate as radio during the 1920s and 1930s and television during the 1950s and 1960s. He noted that only telephone and automobile growth slowed (temporarily) during the Great Depression of the 1930s, while electricity and radio continued to grow during those years. Television, radio, and electricity all peaked at over 99 percent of penetration. For the Internet about 55 percent of U.S. homes will be connected by 2005.
He closed his talk by revisiting—but declining to answer—the thorny question of when we will reach physical limits that begin to restrain semiconductor growth. Silicon CMOS, the dominant semiconductor technology today, should support traditional productivity growth in the industry for the next five to ten years. The factors slowing productivity growth are as likely to be economic (e.g., cost of manufacturing) as reaching the physical limits of transistors in silicon. There are emerging technologies, such as quantum computing, that may extend the life of digital processing and storage.
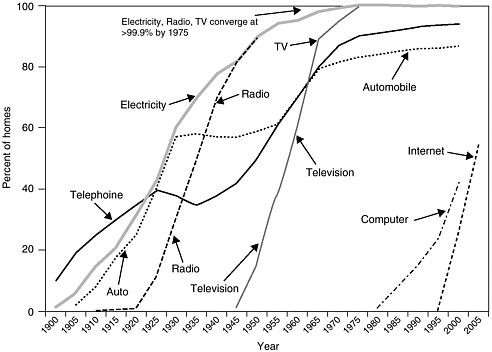
FIGURE 8 Penetration of New Technologies in U.S. Homes, 1900-2005.
DISCUSSION
A History of Forward Leaps in Technology
Dr. Jorgenson asked Dr. Spencer whether he thought the risks to the semiconductor industry are greater “on the downside or the upside.” He cited Dr. Spencer’s statement that some technologies are progressing more rapidly than semiconductors. One example is the communications technology of wave division multiplexing, which by doubling every six months, is propelling the growth of the Internet. He asked whether prospects could be even better than the most optimistic view of the Semiconductor 2000 plan.
Dr. Spencer replied that there are always times when technology makes tremendous leaps forward. This happened in semiconductors with the advent of CMOS technology. The industry had believed for a long time that it could not build MOS devices, and when this was discovered to be possible, it enabled many techniques that could not be done with bipolar technology. He said that fiber optics was another example. He also mentioned software productivity: that increased computing power and low-cost memory allowed new, efficient ways to
write software. He compared this with the first Alto microcomputer built at the Xerox Palo Alto Research Center in the late 1970s. This feat required a great deal of microcoding, which is virtually obsolete today. Microcoding was the only way to operate the Alto, because systems then lacked sufficient processor speed and physical space for memory.
He also suggested that fiber optic technology might provide a powerful growth boost to communication technology, as long as it is possible to move from electronic to optical switching. The same might happen in computers, thanks to the RISC-based architecture that has increased the number of operations that can be done per cycle of clock speed. Thus, the future of information technology would depend not only on semiconductor productivity but also on major jumps in other technologies.
The Challenge of Finding Real Value in Technology
Bill Raduchel observed that the most interesting problem over the next decade rests not so much in creating new technology but in figuring out how to do something useful with it. New technologies are growing faster than consumers can absorb them. Virtually anything is possible, he said, and if it isn’t possible now, “give me one year or two years or three years of these growth rates and it will be.” The challenge is to find real value in all the new technology. It is useful to change outmoded business practices and to clean up software systems. The understanding at Sun Microsystems is that innovations have no value unless consumers see that value and use it. The upside may not be in the raw bits but in finding an application for the new technology. He mentioned having talked with people who spend large amounts of money for cellular licenses without having a plan for how to use them. He termed this development “scary”—a willingness to invest in expensive technologies without any ideas for using them.
Jon Baron asked whether the cost of semiconductors is becoming a larger or smaller share of computer costs. Dr. Spencer answered that a semiconductor’s share of the cost of a personal computer is about 40 percent today versus about half that a decade ago.
A Leap in Internet Access
Lee Price commented on a recent survey by the Commerce Department on home Internet access.12 He said that (although he did not have precise figures) the trend in access was climbing steeply. For home ownership of computers he


