TABLE 3–1 Fuel Comsumption Technology Matrix—Passenger Cars
|
|
Fuel Consumption Improvement % |
Retail Price Equivalent (RPE) ($) |
Subcompact |
Compact |
Midsize |
Large |
|||||||||
|
Baseline: overhead cams, 4-valve, fixed timing, roller finger follower. |
Low |
High |
1 |
2 |
3 |
1 |
2 |
3 |
1 |
2 |
3 |
1 |
2 |
3 |
|
|
Production-intent engine technology |
|||||||||||||||
|
Engine friction reduction |
1–5 |
35 |
140 |
x |
x |
x |
x |
x |
x |
x |
x |
x |
x |
x |
x |
|
Low-friction lubricants |
1 |
8 |
11 |
x |
x |
x |
x |
x |
x |
x |
x |
x |
x |
x |
x |
|
Multivalve, overhead camshaft (2-V vs. 4-V) |
2–5 |
105 |
140 |
|
|||||||||||
|
Variable valve timing |
2–3 |
35 |
140 |
x |
x |
x |
x |
x |
x |
x |
x |
x |
x |
x |
x |
|
Variable valve lift and timing |
1–2 |
70 |
210 |
|
x |
x |
|
x |
x |
|
x |
x |
|
x |
x |
|
Cylinder deactivation |
3–6 |
112 |
252 |
|
x |
|
|||||||||
|
Engine accessory improvement |
1–2 |
84 |
112 |
x |
x |
x |
x |
x |
x |
x |
x |
x |
x |
x |
x |
|
Engine supercharging and downsizing |
5–7 |
350 |
560 |
|
x |
|
x |
||||||||
|
Production-intent transmission technology |
|||||||||||||||
|
Five-speed automatic transmission |
2–3 |
70 |
154 |
|
x |
|
x |
|
x |
x |
x |
x |
|
||
|
Continuously variable transmission |
4–8 |
140 |
350 |
|
x |
x |
|
x |
|
x |
|
x |
|
x |
|
|
Automatic transmission w/aggressive shift logic |
1–3 |
— |
70 |
x |
|
x |
|
x |
|
x |
|
||||
|
Six-speed automatic transmission |
1–2 |
140 |
280 |
|
x |
|
x |
x |
|
||||||
|
Production-intent vehicle technology |
|||||||||||||||
|
Aero drag reduction |
1–2 |
— |
140 |
|
x |
x |
|
x |
x |
|
x |
x |
|||
|
Improved rolling resistance |
1–1.5 |
14 |
56 |
x |
x |
x |
x |
x |
x |
x |
x |
x |
x |
x |
x |
|
Safety technology |
|||||||||||||||
|
Safety weight increase |
-3 to -4 |
0 |
0 |
x |
x |
x |
x |
x |
x |
x |
x |
x |
x |
x |
x |
|
Emerging engine technology |
|||||||||||||||
|
Intake valve throttling |
3–6 |
210 |
420 |
|
x |
|
|
x |
|
|
x |
|
|
x |
|
|
Camless valve actuation |
5–10 |
280 |
560 |
|
|
x |
|
|
x |
|
|
x |
|
|
x |
|
Variable compression ratio |
2–6 |
210 |
490 |
|
|
x |
|
|
x |
|
|
x |
|
|
x |
|
Emerging transmission technology |
|||||||||||||||
|
Automatic shift/manual transmission (AST/AMT) |
3–5 |
70 |
280 |
|
x |
|
x |
|
|||||||
|
Advanced CVTs—allows high torque |
0–2 |
350 |
840 |
|
x |
|
x |
||||||||
|
Emerging vehicle technology |
|||||||||||||||
|
42-V electrical systems |
1–2 |
70 |
280 |
|
x |
|
x |
|
x |
x |
|
x |
x |
||
|
Integrated starter/generator (idle off-restart) |
4–7 |
210 |
350 |
x |
x |
|
x |
|
x |
||||||
|
Electric power steering |
1.5–2.5 |
105 |
150 |
x |
x |
x |
x |
x |
x |
||||||
|
Vehicle weight reduction (5%) |
3–4 |
210 |
350 |
|
x |
||||||||||
TABLE 3–2 Fuel Consumption Technology Matrix—SUVs and Minivans
|
Baseline (small SUV): overhead cams, 4- valve, fixed timing, roller finger follower. |
Fuel Consumption Improvemen (%) |
Retail Price Equivalent (RPE) ($) |
Small SUV |
Mid SUV |
Large SUV |
Minivan |
|||||||||
|
Baseline (others): 2- valve, fixed timing, roller finger follower. |
Low |
High |
1 |
2 |
3 |
1 |
2 |
3 |
1 |
2 |
3 |
1 |
2 |
3 |
|
|
Production-intent engine technology |
|||||||||||||||
|
Engine friction reduction |
1–5 |
35 |
140 |
x |
x |
x |
x |
x |
x |
x |
x |
x |
x |
x |
x |
|
Low-friction lubricants |
1 |
8 |
11 |
x |
x |
x |
x |
x |
x |
x |
x |
x |
x |
x |
x |
|
Multi valve, overhead camshaft (2-V vs. 4-V) |
2–5 |
105 |
140 |
x |
x |
x |
x |
x |
x |
x |
x |
x |
x |
x |
x |
|
Variable valve timing |
2–3 |
35 |
140 |
x |
x |
x |
x |
x |
x |
x |
x |
x |
x |
x |
x |
|
Variable valve lift and timing |
1–2 |
70 |
210 |
|
x |
x |
|
x |
x |
|
x |
x |
|
x |
x |
|
Cylinder deactivation |
3–6 |
112 |
252 |
|
x |
x |
|
x |
x |
|
x |
|
|||
|
Engine accessory improvement |
1–2 |
84 |
112 |
x |
x |
x |
x |
x |
x |
x |
x |
x |
x |
x |
x |
|
Engine supercharging and downsizing |
5–7 |
350 |
560 |
|
|
x |
|
|
x |
|
|
x |
|
|
x |
|
Production-intent transmission technology |
|||||||||||||||
|
Five-speed automatic transmission |
2–3 |
70 |
154 |
x |
|
x |
x |
|
x |
x |
x |
x |
x |
x |
|
|
Continuously variable transmission |
4–8 |
140 |
350 |
|
x |
x |
|
|
x |
|
|||||
|
Automatic transmission w/aggressive shift logic |
1–3 |
0 |
70 |
x |
|
|
x |
|
|
x |
x |
|
x |
|
|
|
Six-speed automatic transmission |
1–2 |
140 |
280 |
|
|
|
|
x |
|
|
x |
x |
|
x |
x |
|
Production-intent vehicle technology |
|||||||||||||||
|
Aero drag reduction |
1–2 |
0 |
140 |
|
x |
x |
|
x |
x |
|
x |
x |
|
x |
x |
|
Improved rolling resistance |
1–1.5 |
14 |
56 |
x |
x |
x |
x |
x |
x |
x |
x |
x |
x |
x |
x |
|
Safety technology |
|||||||||||||||
|
Safety weight increase |
-3 to -4 |
0 |
0 |
x |
x |
x |
x |
x |
x |
x |
x |
x |
x |
x |
x |
|
Emerging engine technology |
|||||||||||||||
|
Intake valve throttling |
3–6 |
210 |
420 |
|
x |
|
|
x |
|
|
x |
|
|
x |
|
|
Camless valve actuation |
5–10 |
280 |
560 |
|
x |
|
x |
|
x |
|
x |
||||
|
Variable compression ratio |
2–6 |
210 |
490 |
|
|
x |
|
|
x |
|
|
x |
|
|
x |
|
Emerging transmission technology |
|||||||||||||||
|
Automatic shift/manual transmission (AST/AMT) |
3–5 |
70 |
280 |
|
x |
|
x |
|
x |
x |
|||||
|
Advanced CVTs—allows higher torque |
0–2 |
350 |
840 |
|
x |
|
|||||||||
|
Emerging vehicle technology |
|||||||||||||||
|
42-V electrical systems |
1–2 |
70 |
280 |
|
x |
x |
|
x |
x |
|
x |
x |
|
x |
x |
|
Integrated starter/generator (idle off-restart) |
4–7 |
210 |
350 |
|
x |
x |
|
x |
x |
|
x |
x |
|
x |
x |
|
Electric power steering |
1.5–2.5 |
105 |
150 |
|
|
x |
|
x |
x |
|
x |
x |
|
x |
x |
|
Vehicle weight reduction (5%) |
3–4 |
210 |
350 |
|
x |
|
x |
|
|||||||
TABLE 3–3 Fuel Consumption Technology Matrix—Pickup Trucks
|
Baseline: 2-valve, fixed timing, roller finger follower. |
Fuel Consumption Improvement (%) |
Retail Price Equivalent (RPE) ($) |
Small Pickup |
Large Pickup |
|||||
|
Low |
High |
1 |
2 |
3 |
1 |
2 |
3 |
||
|
Production-intent engine technology |
|||||||||
|
Engine friction reduction |
1–5 |
35 |
140 |
x |
x |
x |
x |
x |
x |
|
Low-friction lubricants |
1 |
8 |
11 |
x |
x |
x |
x |
x |
x |
|
Multivalve, overhead camshaft (2-V vs. 4-V) |
2–5 |
105 |
140 |
x |
x |
x |
x |
x |
x |
|
Variable valve timing |
2–3 |
35 |
140 |
|
x |
x |
x |
x |
x |
|
Variable valve lift and timing |
1–2 |
70 |
210 |
|
x |
x |
|
x |
x |
|
Cylinder deactivation |
3–6 |
112 |
252 |
x |
x |
|
x |
|
|
|
Engine accessory improvement |
1–2 |
84 |
112 |
x |
x |
x |
x |
x |
x |
|
Engine supercharging and downsizing |
5–7 |
350 |
560 |
|
x |
|
x |
x |
|
|
Production-intent transmission technology |
|||||||||
|
Five-speed automatic transmission |
2–3 |
70 |
154 |
x |
x |
|
x |
x |
x |
|
Continuously variable transmission |
4-8 |
140 |
350 |
|
x |
|
|||
|
Automatic transmission w/aggressive shift logic |
1–3 |
0 |
70 |
x |
|
x |
x |
|
|
|
Six-speed automatic transmission |
1–2 |
140 |
280 |
|
x |
|
x |
x |
|
|
Production-intent vehicle technology |
|||||||||
|
Aero drag reduction |
1–2 |
0 |
140 |
|
x |
x |
|
x |
x |
|
Improved rolling resistance |
1–1.5 |
14 |
56 |
x |
x |
x |
x |
x |
x |
|
Safety technology |
|||||||||
|
5% safety weight increase |
-3 to -4 |
0 |
0 |
x |
x |
x |
x |
x |
x |
|
Emerging engine technology |
|||||||||
|
Intake valve throttling |
3–6 |
210 |
420 |
|
x |
|
x |
|
|
|
Camless valve actuation |
5–10 |
280 |
560 |
|
x |
|
x |
||
|
Variable compression ratio |
2–6 |
210 |
490 |
|
x |
|
x |
||
|
Emerging transmission technology |
|||||||||
|
Automatic shift/manual transmission (AST/AMT) |
3–5 |
70 |
280 |
|
x |
|
x |
||
|
Advanced CVTs |
0–2 |
350 |
840 |
|
x |
|
|||
|
Emerging vehicle technology |
|||||||||
|
42-V electrical systems |
1–2 |
70 |
280 |
|
x |
x |
|
x |
x |
|
Integrated starter/generator (idle off-restart) |
4–7 |
210 |
350 |
|
x |
x |
|
x |
x |
|
Electric power steering |
1.5–2.5 |
105 |
150 |
|
x |
x |
|
x |
x |
|
Vehicle weight reduction (5%) |
3–4 |
210 |
350 |
|
|||||
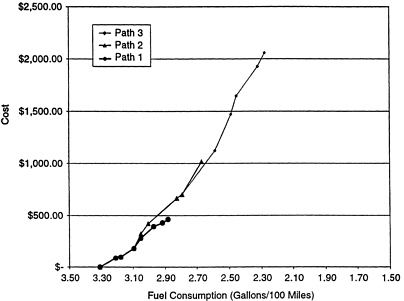
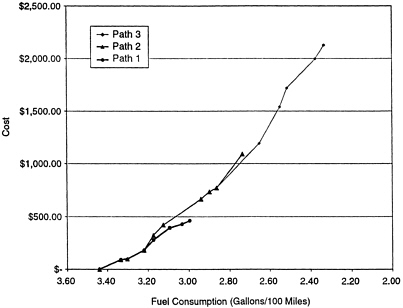
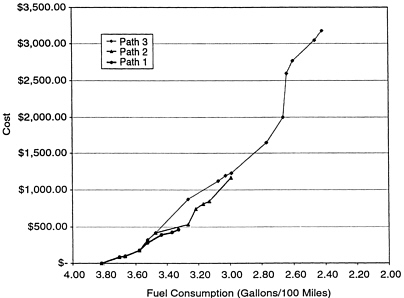
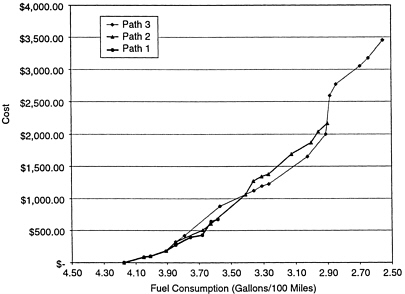
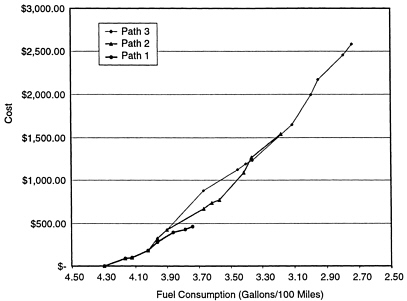
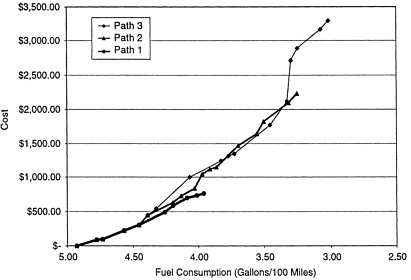
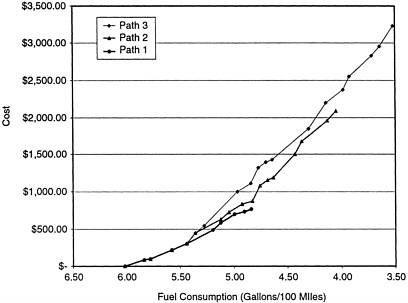
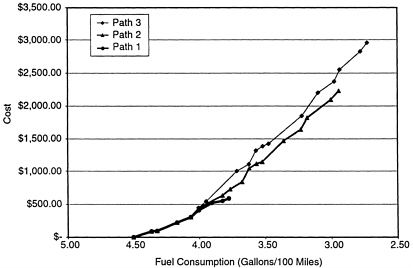
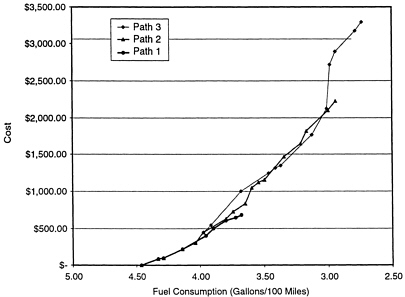
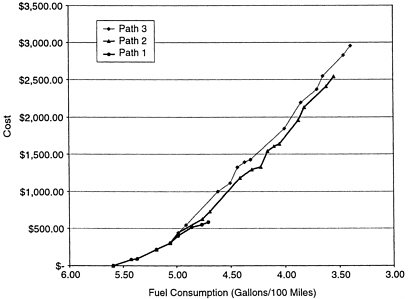
TABLE 3–4 Estimated Fuel Consumption (FC), Fuel Economy (FE), and Incremental Costs of Product Development
|
Weight Class |
Base FE |
Base FC |
Base FC w/Safety Weight |
Average Fuel Economy (mpg) |
Average Fuel Consumption (gal/100 mi) |
Average Cumulative Cost($) |
|
Path 1 |
||||||
|
Subcompact |
31.3 |
3.19 |
3.31 |
34.7 |
2.88 |
465 |
|
Compact |
30.1 |
3.32 |
3.44 |
33.4 |
2.99 |
465 |
|
Midsize |
27.1 |
3.69 |
3.82 |
30.0 |
333 |
465 |
|
Large |
24.8 |
4.03 |
4.17 |
27.9 |
358 |
675 |
|
Small SUV |
24.1 |
4.15 |
4.29 |
26.7 |
3.74 |
465 |
|
Mid SUV |
21.0 |
4.76 |
4.93 |
25.3 |
3.96 |
769 |
|
Large SUV |
17.2 |
5.81 |
6.02 |
20.7 |
4.84 |
769 |
|
Minivan |
23.0 |
4.35 |
4.50 |
26.5 |
3.78 |
587 |
|
Pickup—small |
23.2 |
4.31 |
4.46 |
27.2 |
3.68 |
682 |
|
Pickup—large |
18.5 |
5.41 |
5.59 |
21.2 |
4.71 |
587 |
|
Path 2 |
||||||
|
Subcompact |
31.3 |
3.19 |
3.31 |
37.5 |
2.67 |
1,018 |
|
Compact |
30.1 |
3.32 |
3.44 |
36.6 |
2.73 |
1,088 |
|
Midsize |
27.1 |
3.69 |
3.82 |
36.0 |
2.78 |
1,642 |
|
Large |
24.8 |
4.03 |
4.17 |
34.5 |
2.90 |
2,167 |
|
Small SUV |
24.1 |
4.15 |
4.29 |
31.4 |
3.18 |
1,543 |
|
Mid SUV |
21.0 |
4.76 |
4.93 |
30.8 |
3.25 |
2,227 |
|
Large SUV |
17.2 |
5.81 |
6.02 |
24.7 |
4.05 |
2,087 |
|
Minivan |
23.0 |
4.35 |
4.50 |
34.0 |
2.94 |
2,227 |
|
Pickup—small |
23.2 |
4.31 |
4.46 |
34.0 |
2.94 |
2,227 |
|
Pickup—large |
18.5 |
5.41 |
5.59 |
28.2 |
3.55 |
2,542 |
|
Path3 |
||||||
|
SubCompact |
31.3 |
3.19 |
3.31 |
43.9 |
2.28 |
2,055 |
|
Compact |
30.1 |
3.32 |
3.44 |
42.9 |
2.33 |
2,125 |
|
Midsize |
27.1 |
3.69 |
3.82 |
41.3 |
2.42 |
3,175 |
|
Large |
24.8 |
4.03 |
4.17 |
39.2 |
255 |
3,455 |
|
Small SUV |
24.1 |
4.15 |
4.29 |
36.5 |
2.74 |
2580 |
|
Mid SUV |
21.0 |
4.76 |
4.93 |
34.2 |
2.92 |
3578 |
|
Large SUV |
17.2 |
5.81 |
6.02 |
28.4 |
3.52 |
3,235 |
|
Minivan |
23.0 |
4.35 |
4.50 |
36.6 |
2.73 |
2,955 |
|
Pickup—small |
23.2 |
4.31 |
4.46 |
36.6 |
2.73 |
3,298 |
|
Pickup—large |
18.5 |
5.41 |
5.59 |
29.5 |
3.39 |
2,955 |