
5
Summary, Major Findings, and Recommendations for a Future Approach
The National Highway Traffic Safety Administration (NHTSA) has developed a five-star rating system for the rollover resistance of passenger cars, vans, pickup trucks, and sport utility vehicles (SUVs). The ratings for many 2001 and 2002 model year vehicles are available to the public as part of the agency’s New Car Assessment Program (NCAP). The cornerstone of this rollover resistance rating system is a vehicle’s static stability factor (SSF), defined as its track width, T, divided by twice its center of gravity height, H.
The congressional mandate for this study requested
-
A determination of “whether the static stability factor is a scientifically valid measurement that presents practical, useful information to the public”; and
-
A comparison of “the static stability factor test versus a test with rollover metrics based on dynamic driving conditions that may induce rollover events.”
The committee’s findings regarding SSF and NHTSA’s star ratings for rollover resistance are presented below, following some brief remarks designed to place this study in the broader context of road safety and automobile crashes in general. The chapter concludes with the committee’s recommendations to NHTSA for a future approach to the development of consumer information on motor vehicle rollover.
CONTEXT
Rollovers, like all automobile crashes, are complex events. Three main factors, and interactions among them, contribute to a crash: the driver, the driving environment, and the vehicle. Changes in all three of these factors have the potential to reduce the numbers of deaths and injuries resulting from rollover crashes. For example, NHTSA estimates that belted occupants are about 75 percent less likely than unbelted occupants to be killed in a rollover crash. Thus, a change in driver behavior leading to increased seat belt use could be effective in reducing rollover-related fatalities. Similarly, design improvements in both the roadside and roadside structures have the potential to reduce the likelihood of rollover when a vehicle leaves the roadway, particularly in a rural
environment. In accordance with its congressional mandate, this study focuses on the role of the vehicle in rollover crashes, and on the development and use of related consumer information.
Many complex risk trade-offs need to be considered in pursuing the ultimate goal of improved road safety, and the findings and recommendations of this report should be viewed in that broader context. The strategy of isolating and addressing specific safety problems can be effective in reducing the occurrence of associated deaths and injuries. This point is illustrated by the NCAP crashworthiness ratings: far fewer vehicles have exceeded the injury reference values since NHTSA began its frontal-crash NCAP program in 1979 (Ferguson 1999). At the same time, it is important to ensure that changes leading to a reduction in one contributor to overall vehicle risk, such as rollover, do not compromise other aspects of vehicle safety. Experience indicates that motor vehicle safety ratings give manufacturers a powerful incentive to design safer vehicles. Therefore, it is essential for NHTSA to avoid unintended—and detrimental—consequences in establishing rating system targets. Design changes that result in a higher rating for one vehicle feature, such as rollover resistance, should not be achieved at the expense of introducing other vehicle attributes that actually make the vehicle less safe overall. The many and complex trade-offs inherent in the vehicle design process make it particularly challenging to achieve overall vehicle safety improvements. Nevertheless, experience with crash ratings indicates that it is possible for vehicles to achieve uniformly good ratings across different categories.
STATIC STABILITY FACTOR
Relevance to Rollover
As noted, a vehicle’s SSF is directly determined by two vehicle parameters: the track width, T, and the center of gravity height, H. The SSF metric is based on a rigid-body model of a vehicle sliding laterally on a surface. For such a model, the point of incipient rollover occurs when the sum of the lateral forces divided by the weight of the vehicle, W, is greater than the SSF:
(1)
For a vehicle to roll over, the lateral forces must be sustained for a sufficient period of time.1
The mechanism of lateral force generation is sometimes categorized as either tripped or untripped. Relationship 1 does not distinguish between tripped rollover resulting from forces generated by a mechanical obstacle, such as a
curb or a furrow plowed during an off-road maneuver, and untripped rollover resulting from forces generated by the tire–road interface friction on a smooth roadway. The physics governing the motion of vehicles shows that it is the magnitude and duration of the lateral forces on the vehicle that determine whether rollover occurs. Therefore, the present report does not distinguish between tripped and untripped rollovers.
For a real vehicle—as opposed to a rigid-body model—the simple rollover scenario is modified by such effects as tire deflections and the vehicle’s rolling on its suspensions. As a consequence of these effects, vehicles roll over when the sum of the lateral forces is lower than predicted by the rigid-body model. Nevertheless, SSF is valuable in providing a clearly defined upper limit; if the sustained lateral forces on the tires exceed the limit derived from SSF for a sufficient time, rollover occurs.
An important question is whether the upper limit derived from SSF has significant meaning for vehicles in potential crash scenarios. A rollover crash can be described in terms of a sequence that passes from normal driving conditions, through a transitional loss-of-control region, and then to the out-of-control region and rollover. Current understanding of vehicle dynamics indicates that, following initiation of such a rollover sequence, vehicle behavior as the driver loses control is determined by many vehicle design parameters that affect handling (e.g., steering response, brake and suspension characteristics, track width, tire characteristics),2 as well as by driver control inputs (steering, throttle, braking). Once the vehicle has reached the point of incipient rollover, however, static metrics—such as SSF—and the terrain are the dominant factors in determining whether rollover will occur.
Finding 1: Through a rigid-body model, SSF relates a vehicle’s track width, T, and center of gravity height, H, to a clearly defined level of the sustained lateral acceleration that will result in the vehicle’s rolling over. The rigid-body model is based on the laws of physics and captures important vehicle characteristics related to rollover.
Correlation with Crash Data
Statistical analysis of crash data is a potentially useful method of identifying trends in motor vehicle crashes. A strong statistical correlation between two events, or parameters, does not necessarily imply the existence of a corresponding causal relationship. However, if an understanding of physics and vehicle dynamics indicates that SSF is an important factor in rollovers, investigation of the statistical relationship between SSF and the observed rollover
rate may be helpful in assessing the influence of SSF on the outcome of actual crashes.
Statistical relationships derived from crash data are useful in identifying trends. NHTSA has generated a rollover curve showing the variation in rollover probability in the event of a single-vehicle crash3 as a function of SSF for a number of vehicle makes and models. This curve portrays trends in the relationship between rollover probability and SSF. However, a specific data point representing the rollover risk of a particular vehicle may fall above or below the rollover curve, which represents the average of the data.
On the basis of its discussions with road safety experts and its review of the technical literature, the committee determined that scenarios—characterized in this report by particular combinations of driver and environmental variables—are important when considering rollover. The crash record of a particular vehicle model depends on driver behavior, the driving environments in which the vehicle is used, and the vehicle itself. In assessing the rollover propensity of a vehicle, scenario effects need to be considered when determining the influence of the factor under investigation—in this case, SSF.
In developing its rating system, NHTSA undertook statistical studies to investigate the relationship between measured values of SSF for a range of vehicles and corresponding rollover rates determined from crash data. The agency reviewed crash frequencies and rollover rates for several states; for modeling purposes, it used data from six states, selected as representative of national trends. At the request of the committee, NHTSA used a logit model to calculate additional rollover curves for individual crash scenarios. Each curve shows the probability of rollover in the event of a single-vehicle crash as a function of SSF for a specific scenario. Each scenario is defined by a unique combination of selected precrash and at-crash factors likely to affect the crash outcome. Data from single-vehicle crashes indicate that the following factors increase the risk of rollover: (1) male driver, (2) driver under 25 years of age, (3) drinking or illegal drug use by the driver, (4) speed limit 50 mph or greater, (5) crash occurs in a rural area, and (6) crash occurs on a curve.
The results of the NHTSA analyses indicate that the number of rollovers per single-vehicle crash decreases monotonically with increasing SSF for higher-risk scenarios, with some variations in the shape of the curve for different scenarios. The confidence bands for these curves are relatively narrow. Therefore, when known risk factors such as young male driver, driver drinking, excessive speed, and driving in a rural area are taken into account, the effect of SSF on the occurrence of rollover is statistically significant. The rollover curves for low-risk scenarios also show a decrease in rollover probability
with increasing SSF. Because of the small numbers of single-vehicle crashes for these scenarios, however, the confidence bands at lower SSF values are wide, indicating that the observed trends in rollover probability are not statistically significant.
Finding 2: Analysis of crash data reveals that, for higher-risk scenarios, SSF correlates significantly with a vehicle’s involvement in single-vehicle rollovers, although driver behavior and driving environment also contribute. For these scenarios, the statistical trends in crash data and the underlying physics of rollover provide consistent insight: an increase in SSF reduces the likelihood of rollover.
In developing its star ratings for rollover resistance, NHTSA used an average scenario that was assumed to apply to all drivers. Although this approach ignores the subtleties of different scenarios and associated risks, it enabled the agency to develop a relatively simple rating system. Without a better understanding of consumer beliefs about the causes of rollover and empirical data on consumers’ use of NHTSA’s current rollover information, the committee is not in a position to comment on the value (if any) of scenario-specific rollover information in reducing overall rollover rates.
Static Measures and Dynamic Testing
As part of its charge, the committee was asked to compare “the static stability factor test versus a test with rollover metrics based on dynamic driving conditions that may induce rollover events.” SSF provides important information on a vehicle’s rollover propensity in the final phase of a crash. A vehicle’s crash-avoidance characteristics are determined by more than 20 vehicle design parameters—including track width, T, and center of gravity height, H—that affect handling. It is these characteristics, together with driver inputs (steering, throttle, brake), that largely determine whether a driver can regain control of the vehicle after hitting a curb or making a rapid maneuver to avoid an obstacle. Thus static metrics—such as SSF—and dynamic tests are complementary, and both are needed to investigate a rollover crash in its entirety, from initiation to final outcome. Some manufacturers now offer electronic stability control systems that attempt to stabilize a vehicle in the early stages of loss of control. The merit of such systems lies in preventing a vehicle from entering into a situation that can lead to incipient rollover.
Finding 3: Metrics derived from dynamic testing are needed to complement static measures, such as SSF, by providing information about vehicle handling characteristics that are important in determining whether a driver can avoid conditions leading to rollover.
In response to the requirements of the Transportation Recall, Enhancement, Accountability, and Documentation (TREAD) Act of 2000 (Public Law 106-414), NHTSA is conducting research to develop a dynamic test relevant to the rollover of light motor vehicles for a consumer information program. Development of such a test is challenging because the relevant driving maneuvers involve testing near the limits of vehicle performance. Consequently, the results obtained may depend on the particular test scenario.
In summary, the committee found that SSF captures important vehicle characteristics related to rollover propensity and is strongly correlated with the outcome of actual crashes (rollover versus no rollover), as demonstrated by statistical analyses of crash data. Data from dynamic testing could provide important information on vehicle crash-avoidance metrics that would complement static measures.
NHTSA’s STAR RATINGS FOR ROLLOVER RESISTANCE
Derivation of the Rating System
NHTSA derived its star ratings for rollover resistance using an exponential statistical model4 and regression analysis correlating SSF with crash data. These crash data are binary; in other words, only two possible outcomes of a crash are of interest—the vehicle rolls over, or it does not. An exponential model is seldom used for analyzing binary data; regression analysis using a logit model is a more appropriate method. In response to a comment to this effect from the Alliance of Automobile Manufacturers, NHTSA recalculated the rollover curve using logistic regression, and found the rollover curves based on the exponential and logit models to be similar (Federal Register 2001a). The agency subsequently decided to base its rollover resistance ratings on its original exponential model. NHTSA did not investigate the relative usefulness and predictive capabilities of the two statistical models by calculating the associated confidence intervals.
At the committee’s request, NHTSA calculated the 95 percent confidence intervals for the exponential model used to derive the rating system.5,6 These confidence bands appear to indicate that the uncertainty associated with the estimates is too large to permit unambiguous allocation of a vehicle to a specific rating category. However, the committee’s investigations revealed
that these confidence intervals are based on a statistical analysis that does not appropriately consider the richness of the dataset. In this report, no attempt is made to rectify this situation, and the crash data used for the present analysis have been processed by NHTSA using a logit model. The results of the logit analysis, illustrated in Figure 5-1, show that the 95 percent confidence bands associated with the rollover curve are very narrow. Therefore, the logit model accurately estimates the average rollover curve.
NHTSA’s decision to develop a five-star rating system for rollover resistance was based in part on the desire to use a ranking system that was already familiar to consumers through the NCAP ratings for crashworthiness. The estimated rollover curve based on the exponential model was approximated by five discrete levels corresponding to the five rating categories. This is a coarse approximation that results in a substantial loss of information, particularly at lower SSF values, where the rollover curve is relatively steep. The choice of breakpoints for the rating system does not exploit the richness of the available crash data, and as a result the system is not as helpful as it could be for consumers.
It is possible, for example, for one vehicle to have a slightly higher SSF than another, but to receive two stars instead of one. With only five rating categories spread across the range of interest, this difference appears highly
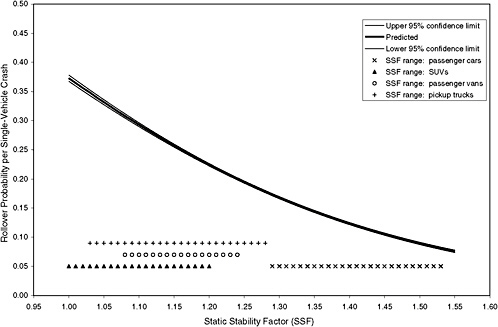
FIGURE 5-1 Estimated probability of rollover and 95 percent confidence intervals based on maximum-likelihood estimation of a logit model using the data from six states combined (n = 206,822).
significant. Furthermore, there can be an important difference in SSF—and associated rollover propensity—between two vehicles with the same star rating. Having more categories would provide greater resolution so that some of these problems could be avoided. Thus the difference between one and two stars would be smaller than it is with five categories. The result would be a more accurate representation of the underlying physics: on average, a vehicle with a slightly higher SSF than another has only a slightly higher rollover resistance. In addition, there would be less variation in SSF within a rating category than in the five-category case, so the grouping of vehicles would potentially be more useful to a consumer seeking to make meaningful distinctions among vehicles, particularly within a given vehicle class.7,8 Alternatively, the use of discrete rating categories could be avoided altogether by ranking the rollover propensity of vehicles on a continuous scale, for example, 0–100.
Finding 4: NHTSA’s implementation of an exponential statistical model lacks the confidence levels needed to permit discrimination among vehicles within a vehicle class with regard to differences in rollover risk.
Finding 5: The relationship between rollover risk and SSF can be estimated accurately with available crash data and software using a logit model. For the analysis of rollover crash data, this model is more appropriate than an exponential model.
Finding 6: The approximation of the average rollover curve with five discrete levels—corresponding to the five rating categories—is coarse and does not adequately convey the information provided by the available crash data, particularly at lower SSF values, where the rollover curve is relatively steep.
Presenting Information to the Consumer
Several recent studies have shown that vehicle safety is a significant consideration for consumers when buying a new car (see, for example, Insurance Research Council 1999). In response to this consumer focus on motor vehicle safety, NHTSA established its Consumer Automotive Safety Division in
1997, with the specific objectives of developing and disseminating consumer safety materials.
The rollover information on NHTSA’s website has attracted interest, as indicated by site use statistics. The site provides a list of the rollover resistance ratings for a range of vehicles, together with some brief explanatory material on how the ratings were derived. It also addresses the role of driver behavior in rollover crashes and highlights the importance of wearing a seat belt. The answers to frequently asked questions about the ratings note that even a five-star vehicle is not immune from rollover and also warn consumers that any load placed on the roof will be above the center of gravity of the vehicle, thereby increasing the likelihood of rolling over. The list of ratings indicates which vehicles are equipped with electronic stability control, and the accompanying text notes that this feature “may reduce the likelihood of a single vehicle crash, and thus, the risk of subsequent rollover.” One of the objectives of dynamic testing is to assess the effectiveness of electronic stability control systems in helping a driver avoid conditions leading to rollover.9
The rollover resistance ratings for individual vehicles represent an attempt to provide relevant information about a complex risk in a concise summary measure. It is no easy task to develop a good summary measure that is meaningful, easy to understand and interpret, and unambiguous, and that places the information in the appropriate context and conveys uncertainty. A conclusive assessment of the effectiveness of any such measure requires analysis of empirical data on consumers’ use of the information. The committee was unable to obtain any such data to inform its assessment of the practicality and usefulness of the rollover resistance ratings. Therefore, its findings in this area are based on extrapolation from research on other consumer products, judgment, and evaluation of the process used by NHTSA to develop the ratings.
Research on consumer information and decision making, risk communication, and hazard warnings and labels has resulted in recommended practices that are helpful in developing a range of consumer information. Following these practices does not guarantee that the resulting information will be effective, but it does provide some degree of confidence. NHTSA made only limited use of such practices in developing its rollover resistance rating system. The committee identified three areas of concern in NHTSA’s approach: (1) the use of a single research strategy—namely, focus groups—rather than a range of techniques, including one-on-one interviews, open-ended group interviews, and written questionnaires; (2) failure to use an iterative design process to test, refine, and retest the proposed consumer information; and (3) the lack of large-scale formal testing before dissemination to determine whether consumers are able to apply the information appropriately.
The deficiencies in NHTSA’s approach do not necessarily mean that the rollover resistance ratings are not an effective communication tool. Nevertheless, these deficiencies raise concerns that cannot be dismissed easily in the absence of relevant empirical data on consumer responses to the ratings. A further concern is the superficial resemblance between the rollover resistance ratings and the NCAP frontal and side crash ratings. Both use a star system, with five stars indicating the best vehicle performance and one the worst. However, the crash ratings are based on crash tests and provide information about a vehicle’s crashworthiness, whereas the rollover ratings relate to crash propensity given that the vehicle is already in a single-vehicle crash—a very different concept. Empirical data on consumers’ use of the NCAP information are needed to investigate this possible source of confusion, as well as use of the ratings in the context of other automotive safety information.
Finding 7: There is a gap between recommended practices for the development of safety information and NHTSA’s current process for identifying and meeting consumer needs for such information. In particular:
-
The focus group studies used to develop the star rating system were limited in scope.
-
The agency has not undertaken empirical studies to evaluate consumers’ use of the rollover resistance rating system in making vehicle safety judgments or purchase decisions.
In summary, the committee found that NHTSA’s star ratings for rollover resistance are likely to be of limited use in presenting practical information to the public because:
-
There were shortcomings in the statistical methodology used to derive the average rollover curve.
-
The approximation of the rollover curve by five discrete rating categories is coarse and does not adequately convey the degree of resolution among vehicles provided by available crash data.
-
The limited procedures used by NHTSA to develop and evaluate the star rating system do not demonstrate with reasonable confidence the likely effectiveness of the system.
RECOMMENDATIONS FOR A FUTURE APPROACH
The committee concludes that consumer information on motor vehicle rollover can assist the public in choosing safer cars and encourage manufacturers to in-
vestigate ways of making their vehicles less susceptible to rollover. To be comprehensive, such information needs to capture:
-
The results of dynamic tests that assess a vehicle’s control and handling characteristics, and
-
Information from static measures indicative of a vehicle’s rollover propensity.
In accordance with the requirements of the TREAD Act, NHTSA is investigating driving maneuver tests for rollover resistance and has reported progress in this activity (Federal Register 2001b). Challenges remain in developing the requisite dynamic tests, together with related consumer information that is technically accurate, as well as practical and useful to the public. Nevertheless, the committee has not identified any insurmountable engineering barriers to the development of a representative dynamic test (or tests) that would differentiate meaningfully among vehicles. Similarly, the development of consumer information based on static measures and dynamic tests appears feasible, particularly if NHTSA takes advantage of recommended development practices and proven techniques for communicating risk-based information to consumers.
Despite the absence of technical barriers to providing more comprehensive consumer information on rollover, the protracted history of NHTSA’s rule-making initiatives on rollover (see Chapter 1) suggests that the agency may encounter difficulties in obtaining support for its actions from all the major stakeholders. Furthermore, vehicle manufacturers, consumer groups, and others involved in vehicle testing are likely to incur additional costs when NHTSA introduces dynamic test(s) relating to rollover (see Chapter 2). For these reasons, the committee concludes that consumer information on rollover that captures both static measures and dynamic test results probably will not be available in the near future.
The current rollover resistance ratings are likely to be of limited use to the public because of the way in which information on SSF is delivered. However, SSF may form a reasonable initial basis for developing consumer information on rollover until additional measures based on both static metrics and dynamic testing10 become available.
Recommendation 1: NHTSA should vigorously pursue its ongoing research on driving maneuver tests for rollover resistance, mandated under the TREAD Act, with the objective of developing one or more dynamic tests that can be used to assess transient vehicle behavior leading to rollover.
Recommendation 2: In the longer term, NHTSA should develop revised consumer information on rollover that incorporates the results of one or more dynamic tests on transient vehicle behavior to complement the information from static measures, such as SSF.
Recommendation 3: NHTSA should investigate alternative options for communicating information to the public on SSF and its relationship to rollover. In developing revised consumer information, NHTSA should
-
Use a logit model as a starting point for analysis of the relationship between rollover risk and SSF.
-
Consider a higher-resolution representation of the relationship between rollover risk and SSF than is provided by the current five-star rating system.
-
Continue to investigate presentation metrics other than stars.
-
Provide consumers with more information placing rollover risk in the broader context of motor vehicle safety.
REFERENCES
Donelson, A.C., and R.M. Ray. 2001. Motor Vehicle Rollover Ratings: Toward a Resolution of Statistical Issues. Report prepared for the Alliance of Automobile Manufacturers by Exponent Failure Analysis Associates, Inc., Menlo Park, Calif.
Federal Register. 2001a. Consumer Information Regulations; Federal Motor Vehicle Safety Standards; Rollover Resistance; Final Rule. Vol. 66, No. 9, Jan. 12, pp. 3,388–3,437.
Federal Register. 2001b. Consumer Information Regulations; Federal Motor Vehicle Safety Standards; Rollover Prevention; Request for Comments. Vol. 66, No. 128, July 3, pp. 35,179–35,193.
Ferguson, S.A. 1999. Consumer Demand. Recovery, Vol. 10, pp. 11–13.
Hibbard, J.H., P. Slovic, E. Peters, and M.L. Finucane (in press). Strategies for Reporting Health Plan Performance Information to Consumers: Evidence from Controlled Studies. Health Services Research.
Insurance Research Council. 1999. Public Attitude Monitor 1999: Vehicle Safety Issues.
Kaufman, E., M. Lord, T. Reese, and J. Volkmann. 1949. The Discrimination of Visual Number. American Journal of Psychology, Vol. 62, pp. 498–525.
Peterson, S.A., and T.J. Simon. 2000. Computational Evidence for the Subitizing Phenomenon as an Emergent Property of the Human Cognitive Architecture. Cognitive Science, Vol. 24, No. 1, Jan.–Mar., pp. 93–122.


