
7
The Data Flood: Analysis of Massive and Complex Genomic Data Sets
One of the major themes brought out by the workshop was the interplay between theory and data, but the discussions in preceding chapters do not mention how much data must be dealt with. In fact, the data sets themselves are so massive that their analysis presents major challenges to statistical methodology.
As an example, Dan Roden, of Vanderbilt University, reported on research the original goal of which was to use genetics to predict individual responses to drugs. However, the research quickly evolved into the challenge of navigating through a massive data set. Pharmacologists are very interested in understanding why individuals have different responses to the same drugs, and how to predict those variations. The variability in drug response can correlate with a variety of factors, such as gender, age, disease type, concomitant drug therapies, and ethnicity.
Variability in drug response among different individuals may also be due to genetic factors. Each person has two strands of DNA in his or her genome, shown as two panels in Figure 7-1. At particular genome locations, the DNA sequences might differ between any two people. Such a difference, called a DNA polymorphism, might be associated with the occurrence of side effects in a given individual.
Mutation is one of the factors causing DNA polymorphisms, and which therefore contributes to disease onset. DNA polymorphisms may be due to the deletion, insertion, or substitution of a nucleotide, may occur at coding or noncoding regions of the DNA, and may or may not alter gene function. The occurrence of DNA polymorphism makes it possible to associate a person’s response to drugs with particular DNA regions, for example, by correlating the occurrence of the polymorphism with the response. This is the basis of current phamacogenetics, which is the study of the impact of individual genetic variants on drug response.
Roden’s research sought to evaluate the role of genetics in determining drug response in the case of a single nucleotide polymorphism (SNP) that is known to predispose individuals to drug-induced arrhythmias. He approached the problem with the following strategy:
-
Define the drug response (phenotype) of interest.
-
Test appropriate DNA samples, patients, or families.
-
Identify candidate genes that might explain significant response variations.
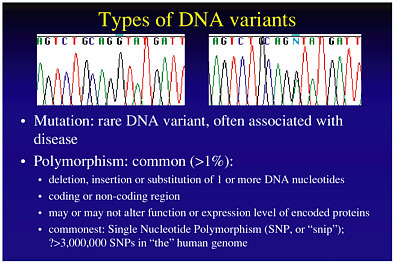
FIGURE 7-1 Types of DNA variants: mutation and polymorphisms. Figure courtesy of Dan Roden.
-
Identify polymorphisms in candidate genes.
-
Relate the identified polymorphism to the phenotype.
Such an analysis would produce a graph like that in Figure 7-2, where the χ2 statistic would be calculated at each SNP. However, such an analysis would be infeasible for both statistical and economic reasons, because of the flood of data. Suppose the research has considered 100,000 SNPs in 1,000 patients (500 affected, 500 not affected). The statistical problem is that the data will result in 100,000 χ2 statistics. With such a multiplicity of tests, there will be many false positives. How then does one set a sensible cutoff point for statistical significance?
Even if the statistical problem can be solved, basic economics makes this straightforward experiment infeasible because of the tremendous cost of recording 100,000 genotypes in each of a thousand people. (If the cost of determining a genotype were only 50 cents, the entire experiment would still cost $50 million.) Accordingly, there is a pressing need to solve the problem of handling the flood of bioinformatics data.
The data flood pointed out by Roden is only one example of the data handling challenges to be overcome. With the development of microarray experiments, the amount of data available today is enormous. At the April 2001 workshop, Terry Speed, of the University of California at Berkeley, gave an overview of microarray experiments, which provide a means of measuring expression levels of many genes in parallel.
In the so-called Stanford protocol, shown on the right side of Plate 3, genetic material from cells is apportioned into two samples, each of which is exposed to a different treatment. (One of the treatments might be the null treatment, in which case we are comparing a treated sample with a control.) The goal is to determine how the two samples differ in the way their genes are expressed—that is, how the genes cause proteins to be created in accordance with their embedded genetic information. One sample is labeled with a red dye and the other with a green dye. The two samples are distributed over a microarray slide (a “gene chip”), which typically has 5,000 to 6,000 different segments of complementary DNA (cDNA) arrayed on it. The two samples of red- and green-dye-tagged genetic material adhere to the
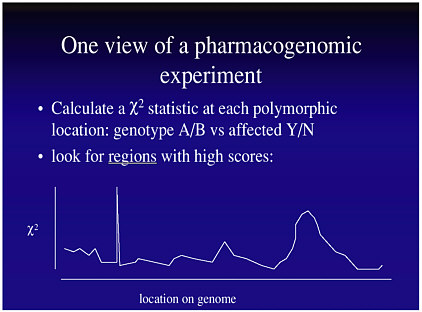
FIGURE 7-2 Data from a hypothetical pharmacogenomic experiment. Figure courtesy of Dan Roden.
slide in different patterns according to their chemical bonding to the cDNA. When the dyed genetic material is allowed to express proteins, the level of activity at each coordinate of the gene chip can be measured through the fluorescence of the dyes. From these measurements, one can develop an understanding of how the genetic material was affected by the treatment to which it was exposed. More complete background on this process, and a number of valuable other links, may be found at <http://www.stat.Berkeley.edu/users/terry/zarray/Html/index.html>.
Many statistical issues arise in the analysis of microarray data, including issues of experimental design, data preprocessing, and arriving at ultimate conclusions. For example, the typical range of expression (on a log2 scale) is about ±5, and the amount of background noise in the data could be substantial. Thus, at present, it is usually possible to identify (with some certainty) only those genes that express at a very high or very low level.
Although there are problems with expression levels, and also with bias, a plot of M versus A, where
M = log2 (red expression) - log2 (green expression)
A = log2 (red expression) + log2 (green expression),
can be extremely useful, as in the following experiment described by Speed, which identified genes with altered expression between two physiological zones (zone 1 and zone 4) of the olfactory epithelium in mice. Plate 4 shows the log ratios plotted against the average of the logs (which gives a measure of absolute expression). It illustrates the noise level in much of the data. It also shows that a number of genes have very high expression levels, and that these genes show differential expression.
Summarizing, Speed outlined some challenges to current research:
-
How to address the observed bias associated with whether a sample is treated with red or green dye (which suggests the need to run the complementary experiment of interchanging the red and green labels);
-
How to create better designs for microarray experiments, ones that go beyond merely comparing treatment with control;
-
How to carry out the experiments’ preprocessing so as to reduce the noise in the data; and
-
How to deal with the fact that, because a large number of genes are tested in microarray experiments, the large number of statistical tests carried out in parallel greatly increases the chance of finding a false positive. (One attempt to address this is exemplified in Tusher et al. (2001), which uses the false discovery rate method—an approach to the multiple comparisons problem that controls for the expected proportion of false positives rather than attempting to minimize the absolute chance of false positives— to set cutoff points for these errors.)


