
2
Modeling Processes Within the Cell
In the 20th century our ability to describe and categorize biological phenomena developed from the organismal level down to the gene level. The 21st century will see researchers working back up that scale, composing genetic information to eventually build up a first-principles understanding of physiology all the way to the level of the complex organism. Figure 2-1 shows this challenge schematically. The 21st century advances in bioinformatics, structural biology, and dynamical systems modeling will rely on computational biology, with its attendant mathematical sciences and information sciences research. As a first step, the huge amount of information coming from recent advances in genomics (e.g., microarray data and genetic engineering experiments) represents an opportunity to connect genotype and phenotype1 in a way that goes beyond the purely descriptive.
Workshop speaker James Weiss, of the University of California at Los Angeles, outlined a strategy for going in that direction by first considering a simple model that might relate the simple gene to the complex organism. His strategy begins by asking what the most generic features of a particular physiological process are and then goes on to build a simple model that could, in principle, relate the genomic input to those features. Through analysis, one identifies emergent properties implicit in the model and the global parameters that identify the model’s features. Physiological details are added later, as needed, to test experimental predictions. This strategy is counter to a more traditional approach in which all known biological components would be included in the model. Weiss’s strategy is necessary at this point in the field’s development because we do not know all the components and their functions, nor would we have the computational ability to model everything at once even if that information were available.
This principle of searching for a simple model was apparent throughout Weiss’s presentation, which showed how a combination of theoretical and experimental biology could be used to study a complex problem. He described research that modeled the causes of ventricular fibrillation. The first attempts at
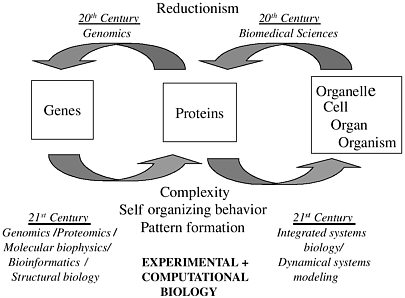
FIGURE 2-1 Directions of scientific investigation. Figure courtesy of James Weiss.
controlling fibrillation focused on controlling the triggering event, an initial phase of ventricular irregularity. However, it was found that a drug therapy that controlled this event did not decrease mortality from ventricular fibrillations. Thus, there was a need to understand better the chain of causality behind ventricular fibrillation.
Using the basic premise that cardiac tissue is an excitable medium, Weiss proposed a wave model. In his model, fibrillation is the result of a breaking wave, and the onset of fibrillation occurs when the wave first breaks; it escalates into full fibrillation as the wave oscillation increases. The cause of the wave breakage was thought to be connected to the occurrence of a premature beat. If the wave could not recover from this premature impulse (recovery is called “electric restitution”), oscillation would develop. This basic concept was modeled through the following simple equation:
Wavelength = APD × Conduction velocity
where APD is the action potential duration. Supercomputer simulations of wave patterns in two- and three-dimensional cardiac tissue, based on this simple equation, showed that the wave patterns undergo a qualitative shift in their characteristics (being either spiral or scroll waves) depending on whether the parameter APD is less than or greater than unity. When APD > 1, the impulses come too rapidly for the wave to recover (i.e., for electric restitution to take place), and fibrillation results. Thus the simulations suggested that holding APD below unity might result in tissue that can recover rather than fall into fibrillation mode. Because drugs are available that can lower APD, it was possible to verify the simulated results in real tissue (a pig ventricle). This suggests the possibility of an important drug intervention that was not of obvious importance before Weiss carried out his simulations. See Garfinkel et al. (2000) for more details.
The graph of DNA synthesis as a function of integrated ERK2 activity shown in Figure 1-1 is another example of how a simple model can sometimes capture the effective behavior of a complex process. The complex process here is one case of how a molecular regulating network governs cell functions. In general, protein signaling causes interconnected, complicated networks to form (see, e.g., Hanahan and Weinberg, 2000, or Figure 2-2 below). The protein signaling pathways include membrane receptors (sensors), intracellular signal cascades (actuators), and cell functional responses (outputs), and one obvious approach to modeling this network would view it as consisting of three parts:
Cues → Intracellular signals → Cell function
Douglas Lauffenburger of MIT adopted this approach to model the quantitative dynamics of the ERK2 signal as it responds to an external cue (fibronectin, a protein involved in many important cellular processes) and helps lead to the cell function of synthesizing DNA. After introduction of the external cue, ERK2 activity increases and peaks at 15 minutes, and then it drops. Amazingly, the DNA synthesis level appears to be linearly dependent on the integrated ERK2 activity, as shown in Figure 1-1. This striking result suggests that there is no need, at this level, to model the network of intracellular signals in detail. Instead, they can be replaced by the de facto linear relationship.
However, simple models are not always sufficient, and in the case of multiple external cues—e.g., insulin’s synergy with fibronectin (Fn) in the regulation of DNA synthesis—the insulin/Fn cue-response synergy is not explained by an integrated ERK2 signal. The more complex behavior in this case is shown in Figure 2-2. Multidimensional signal analysis is probably required for this scenario. More detail about this research may be found in Asthagiri et al. (2000) or at <http://web.mit.edu/cbe/dallab/research.html>.
The reason we seek the simplest models with the right functionality is, of course, that science needs to understand the biological process (ultimately to influence it in a positive way) in terms that are simple enough to develop a conceptual understanding, even an intuition, about the processes. Thus, there is a
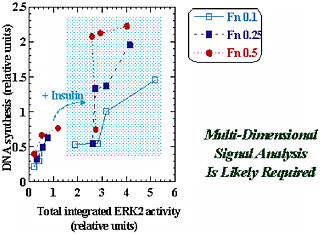
FIGURE 2-2 The insulin/fibronectin (Fn) cue-response synergy is not explained by the integrated ERK2 signal. Multidimensional signal analysis is probably required. Figure courtesy of Douglas Lauffenburger.
balance between simplicity and capturing the essentials of the underlying process. The definition of “essential” will vary according to the investigator’s needs.
Other workshop presentations, by John Tyson, of the Virginia Polytechnic Institute and State University, and Garrett Odell, also delved into the modeling of cellular networks. Tyson investigated the cell cycle, the sequence of events in which a growing cell replicates its components. The network (molecular interactions) of the cell cycle is very complex (see, e.g., Kohn, 1999), as shown in Figure 2-3. Using a compartment model approach, Tyson models the cell cycle with a system of differential equations that represent the molecular interactions. His goal is to produce a model that is tailored to the properties of yeast: that is, having parameter values for which the output of the model agrees with representative experimental data for yeast.
The network diagram shown in Figure 2-3 leads to a system of differential equations with more than 50 rate constants. This mathematical model was fit to data and then tested by looking at its predictions in approximately 100 mutant strains of yeast. The agreement was very good.
Figure 2-4 shows the modeling process that Tyson went through. Neither intuition nor direct experimental data could explain some aspects of the yeast cell’s physiology, but there was enough understanding to hypothesize a molecular signaling network. That network could be described by a system of differential equations, and the output of that system (seen through tools of dynamical system theory) sheds light on the physiology of the cells. Finally, the proposed physiology was verified experimentally.
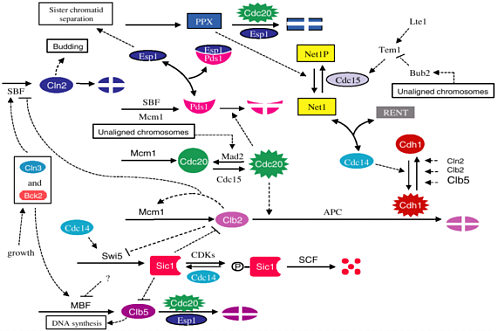
FIGURE 2-3 Network diagram of the yeast cell cycle. Figure courtesy of John Tyson.
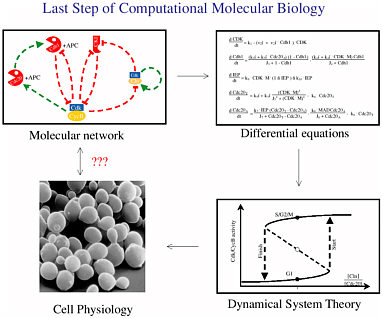
FIGURE 2-4 The modeling process. Figure courtesy of John Tyson.
To construct his very complex model, Tyson did the work in segments. The model was split into simple pieces, and each piece was provisionally fit to data. Then the pieces were joined together and refit as a complete unit. As was the case with the other modeling efforts described in this summary, Tyson’s process began with simple models that didn’t necessarily emulate every known aspect of cellular physiology or biochemistry, and additional complexity was added only as needed to produce output that captures important features observed experimentally.
Garrett Odell used a similar approach to uncover what cellular mechanism controls the formation of stripes in arthropods (see Nagy, 1998, and von Dassow et al., 2000). To model the cell-signaling network, Odell needed 33 differential equations with 48 free parameters. The model was fit using nonlinear optimization with an objective function that was “crafted” so that, at its minimum, the desired genetic pattern would be observed.
Figure 2-5 shows the connection between the network diagram and the mathematical model, where the model parameters νENhh and κENhh need to be estimated. A parametric form is specified for the rate of exchange between the components of a network diagram such as that in Figure 2-3, and the resulting model equations, the solutions to the differential equations, are then estimated. The model was fit using nonlinear optimization with an objective function that was “crafted” so that, at its minimum, the desired genetic pattern would be observed.
A quote that resurfaced at times throughout the conference was the following one, attributed to Stanislaw Ulam: “Give me 15 parameters and I can make an elephant; give me 16 and I can make it dance.” Odell noted, “I cannot make four lousy stripes with 48 parameters”—his first model did not work, and it was found later that the network it was modeling was not correct. (The evidence in the literature was ambiguous about the exact details of the network.)
In fact, this failure demonstrated that the network, as originally conceived, lacked some necessary connections. The process of representing the network with a differential equations model made the
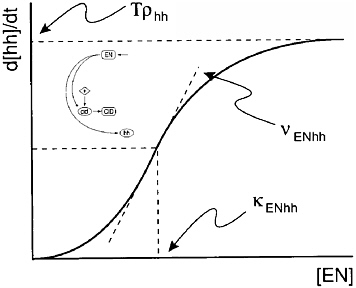
FIGURE 2-5 Parameters control the shape of the typical connection in the network. Figure courtesy of Garrett Odell.
absence of these connections more apparent because the erroneous set of equations did not have the mathematical capacity to create the stripes that are known to occur in nature. After recognizing the missing network links and representing them in the differential equations, the resulting set of equations not only produced the proper pattern, but the choice of parameters also turned out to be extremely robust. That is, the same pattern of stripes occurs over a wide range of parameter values, and it was no longer necessary to use optimization to tune the parameter set. In what was now a 50-dimensional parameter space, choosing the parameters at random (within reasonable bounds) still gave a 1/200 chance of achieving the desired pattern. Further study of the robustness confirmed that the function represented by the differential equations—and, accordingly, the molecular network implied—was extremely stable. Compare this to a radio wiring-diagram, where a change in one connection will render the network inoperable. Here, the robustness of the network is similar to replacing a blown capacitor with whatever is handy and still having an operable radio.
The search for a simple model, indeed for any model, is the search for an underlying structure that will help us to understand the mechanism of the biological process, and—if we are successful—to lead us to new science. The solutions to the yeast differential equations led to understanding a bifurcation phenomenon, and the model also predicts an observed steady-state oscillation. So the mathematical model not only shed new understanding on a previously observed phenomenon, but also opened the door to seeing behavior that had not been explained by biology.


