
Sorting and directed transport of membrane proteins during development of hippocampal neurons in culture
M.A.Silverman*, S.Kaech*, M.Jareb†, M.A.Burack*, L.Vogt‡, P.Sonderegger‡, and G.Banker*§
*Center for Research on Occupational and Environmental Toxicology, Oregon Health Sciences University, Portland, OR 97201; †Center for Neurobiology and Behavior, Columbia University, New York, NY 10027; and ‡Institute of Biochemistry, University of Zurich, Zurich, Switzerland CH-8057
Hippocampal neurons in culture develop morphological polarity in a sequential pattern; axons form before dendrites. Molecular differences, particularly those of membrane proteins, underlie the functional polarity of these domains, yet little is known about the temporal relationship between membrane protein polarization and morphological polarization. We took advantage of viral expression systems to determine when during development the polarization of membrane proteins arises. All markers were unpolarized in neurons before axonogenesis. In neurons with a morphologically distinguishable axon, even on the first day in culture, both axonal and dendritic proteins were polarized. The degree of polarization at these early stages was somewhat less than in mature cells and varied from cell to cell. The cellular mechanism responsible for the polarization of the dendritic marker protein transferrin receptor (TfR) in mature cells centers on directed transport to the dendritic domain. To examine the relationship between cell surface polarization and transport, we assessed the selectivity of transport by live cell imaging. TfR-green fluorescent protein-containing vesicles were already preferentially transported into dendrites at 2 days, the earliest time point we could measure. The selectivity of transport also varied somewhat among cells, and the amount of TfR-green fluorescent protein fluorescence on intracellular structures within the axon correlated with the amount of cell surface expression. This observation implies that selective microtubule-based transport is the primary mechanism that underlies the polarization of TfR on the cell surface. By 5 days in culture, the extent of polarization on the cell surface and the selectivity of transport reached mature levels.
Neurons are composed of two morphologically and molecularly distinct domains, axons and dendrites. The accurate localization of proteins to these domains is critical for neuronal function. The biosynthetic pathway by which membrane proteins acquire their polarized distribution is thought to begin when proteins destined for different cellular domains are packaged into different populations of carrier vesicles, a step that probably occurs in the trans-Golgi network. Once formed, carrier vesicles are conveyed to the axon or dendrite by microtubule-based transport. In a previous report (1), we demonstrated that neurons utilize two different mechanisms for the targeting of polarized membrane proteins, one based on selective transport, the other based on a selectivity filter that occurs downstream of transport. We found that cargo vesicles containing a dendritic protein, transferrin receptor (TfR), are transported directly to the dendritic domain and excluded from the axon. In contrast, cargo vesicles containing the axonal protein neuron-glia cell adhesion molecule (NgCAM) enter both axons and dendrites, even though NgCAM is polarized to the axonal plasma membrane.
When embryonic hippocampal neurons are placed into culture, they acquire their characteristic polarized morphology in a series of well-defined developmental stages (2, 3). Initially, the cells form several short neurites that cannot be distinguished as axons or dendrites (developmental stage 2). After 12–36 h in culture, one of these neurites enters a prolonged period of growth and acquires axonal characteristics, thus defining the cell’s polarity (stage 3). Over the next few days, the remaining neurites acquire dendritic characteristics (stage 4).
The molecular events that underlie the development of neuronal polarity are not well understood (for review, see ref. 4). Neurons at stage 2 of development are molecularly and morphologically unpolarized. Previous work has shown that axonal proteins, such as the cell adhesion molecule LI and the synaptic vesicle proteins synaptophysin and synapsin I, become selectively polarized to the axon at stage 3 of development (5–7). The situation for dendritic proteins is less clear. The polarization of some dendritic proteins appears to lag behind the polarization of axonal proteins (8, 9), whereas other dendritic proteins are excluded from axons at developmental stage 3 (10, 11). Bradke and Dotti (4) have hypothesized that the transition from stage 2 to 3 is also marked by a redirection of organelle transport into the nascent axon.
One limitation in examining the development of molecular compartmentalization in nerve cells is that many of the relevant endogenous proteins are expressed at very low levels early in development, making it difficult to accurately assess their distribution. In the present study, we have used a different approach: virally mediated expression of axonal and dendritic marker proteins at levels that make it easy to assess their distribution, even early in development. We have also expressed green fluorescent protein (GFP)-tagged versions of these proteins to visualize their transport into axons and dendrites. We show that both dendritic and axonal marker proteins are significantly polarized by developmental stage 3; the selective transport of dendritic proteins is also evident at this stage of development. Both selective transport and the polarized distribution of proteins at the cell surface reach mature levels by 5 days in culture.
Methods
Reagents. We thank the following people who generously provided cDNA, virus, and/or antibodies: James Casanova, Massachusetts General Hospital, Boston, mutant polyimmunoglobulin receptor (plgR) cDNA and plgR sheep antisera (12); Robert Gerard, University of Texas-Southwest Medical Center, Dallas; low-density lipoprotein receptor (LDLR) AdV (13); Joseph Goldstein, Texas-Southwest Medical Center, LDLR rab-
|
§ |
To whom reprint requests should be addressed at: CROET/L-606, Oregon Health Sciences University, 3181 S.W.Sam Jackson Park Road, Portland, OR 97201. E-mail: bankerg@ohsu.edu. |
bit antisera (14); Vance Lemmon, Case Western Reserve University, Cleveland, NgCAM chick-specific monoclonal (15); and Ian Trowbridge, Salk Institute, La Jolla, CA, TfR cDNA (16) and TfR human-specific monoclonal (17). Monoclonal antibodies against LDLR (RPN537) were purchased from Amersham Pharmacia; monoclonal antibodies against TfR (B3/25) were obtained from Boehringer Mannheim.
Cell Culture and Viral Infection. Primary cultures of dissociated neurons from embryonic day 18 rat hippocampi were prepared essentially as described (18). Replication-defective herpes simplex viruses and adenoviruses were used to express exogenous proteins (1, 19). Viruses were titered to infect 1–10% of the neurons in culture.
Immunostaining. To detect virally expressed proteins present on the cell surface, living cultures were incubated with the primary antibody diluted in culture medium for 5–7 min at 37°C, quickly rinsed in phosphate-buffered saline, and then fixed. Primary antibodies bound to antigen were detected with the appropriate fluorescently labeled secondary antibodies after permeabilization and blocking of nonspecific background. For quantitation of the fluorescence signal, images of labeled cells (specimen images) were acquired by using either a Photometries (Tucson, AZ) CH250 camera (12 bit; 1,315×1,017 pixels) and a Zeiss Axiophot [25×Plan Apo objective; numerical aperture (N.A.) 1.2] or a Princeton Instruments (Monmouth Junction, NJ) Micromax (12 bit, 1,300×1,030 pixels) and a Leica DM-RXA (20×Plan Apo, N.A. 0.5). Infected cells were chosen by examining random fields at approximately 2-mm intervals across the coverslip. A labeled cell whose processes traversed the field was selected for analysis, so long as its processes did not overlap those of other labeled cells; cells with fewer than three identifiable dendrites were excluded. To limit possible photobleaching during the process of cell selection, total exposure time was kept to less than 10 sec. In control experiments, this level of exposure was found to cause less than a 3% reduction in fluorescence intensity. Exposure time was adjusted so that maximum pixel value was at least half saturation. After acquiring the specimen image, a dark current image generated by an equivalent exposure with the camera shutter closed was subtracted, and a shading correction based on an image of a uniformly fluorescent field was applied to compensate for uneven illumination of the field. Finally, a threshold was set to eliminate nonspecific background staining of axons and dendrites of uninfected cells respectively, and the total fluorescence in the axonal and dendritic domain was determined. A process was considered an axon if it was at least twice the length of any of its other processes. The other processes were considered dendrites. Fluorescence in the cell body was excluded from the analysis.
Live Imaging. Cells on coverslips were sealed into a heated chamber (Warner Instruments, Hamden, CT) in phenol red-free Hanks’ balanced salt solution buffered with 10 mM Hepes (pH 7.4) and supplemented with 0.6% glucose. Vesicle transport was imaged by capturing frames continuously for 30 sec (600-msec exposures) with a Micromax cooled charge-coupled device camera and a 63×Plan Apo, N.A. 1.32 objective on a Leica DM-RXA. For quantitative analysis, transport events were detected by first extracting difference images of sequential frames followed by analysis by using the kymograph drop-in function of the METAMORPH IMAGING SOFTWARE (Universal Imaging, Downingtown, PA). Briefly, lines were drawn along the axis of individual neurites, and the kymograph function was used to find the brightest pixel along a 10-pixel line perpendicular to the axis of the neurite. These values were then plotted for each frame, with time on the x axis and position along the neurite on the y axis. Thus, moving vesicles appeared as diagonal lines whose slopes were a measure of rate and direction of transport (with positive slope corresponding to anterograde transport). The number of transport events in the axon and at least three of the dendrites were determined for 3–12 cells at each time point.
Results
Changes in the Polarization of Membrane Proteins During Development. To assess when during development membrane proteins acquire their characteristic polarized distribution, we expressed representative axonal and dendritic membrane proteins at times ranging from 1 to 14 days in culture and assessed their polarization on the cell surface by live-cell immunostaining. We selected the TfR and the LDLR as dendritic markers and NgCAM as an axonal marker. The sorting of these proteins in mature hippocampal neurons has been well characterized (19, 20). As an example of an unsorted protein, we chose a construct of the pIgR whose dendritic sorting signal had been deleted [pIgR665–668 (19, 20)]. We also assessed the polarization of L1, an endogenous axonal protein.
We first examined cells at stage 2 of development, before neurites have been specified as axons or dendrites. If the polarization of membrane proteins preceded axonal specification, one might expect axonal markers to be concentrated in a single neurite, whereas dendritic markers might be present in all of the neurites except one. When the distribution of these proteins was assessed in stage 2 neurites, we often found that some neurites exhibited more staining than others, but we never observed a cell with only a single neurite that excluded dendritic markers or that had a high concentration of axonal markers. This lack of polarity was particularly evident when cells were simultaneously infected with viruses expressing axonal and dendritic markers (Fig. 1 a). The staining for LDLR and NgCAM was most intense in the growth cones, with some growth cones staining more brightly than others. However, rather than exhibiting the complementary distribution one would expect for proteins polarized to opposite domains, the two markers tended to have a similar distribution in stage 2 cells: growth cones that were brightly stained with the dendritic marker were often brightly stained with the axonal marker as well. Differences in the intensity of staining among different growth cones may reflect the dynamics of their growth; at this stage of development, neurites undergo alternating periods of extension and retraction (21).
At stage 3 of development, both axonal and dendritic markers were polarized, although not to the extent seen in mature neurons. For example, Fig. 1 b illustrates a stage 3 neuron expressing both LDLR and NgCAM. NgCAM was present throughout the cell body and axon, with particularly intense staining in the distal axon. Little staining was present in the dendrites. LDLR was present in the dendrites and proximal axon, but little or no staining was present in the distal axon. On average, we found that 90% of the neuritic cell surface staining for NgCAM was axonal, whereas 81% of the LDLR staining was dendritic. In contrast, staining for the unpolarized protein, pIgR665–668, was about equally divided between dendrites and axon (46% dendritic).
Fig. 1 c summarizes the changes in the distribution of axonal and dendritic marker proteins that occur during the first 2 weeks in culture. The polarity of both axonal and dendritic markers increased during the first few days in culture, reaching mature levels by about day 5. Over time, a slightly greater percentage of the unpolarized protein, pIgR665–668, became associated with the axon, presumably reflecting a relative increase in the size of the axonal arbor.
The Distribution of Cell Surface and Intracellular TfR-GFP and NgCAM-GFP. During the first 2 days in culture, there were significant differences among stage 3 cells in the extent to which dendritic
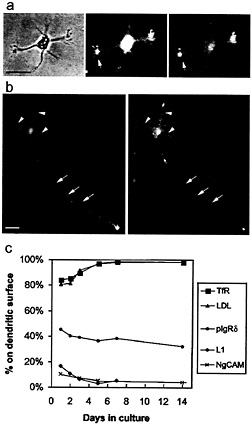
Fig. 1. Changes in the degree of polarization of axonal and dendritic markers during development, (a) In stage 2 neurons, axonal and dendritic markers are not segregated into different neurites. The micrographs illustrate a cell (phase, Left) from a 1-day-old culture 18 h after coinfection with adenoviruses encoding untagged versions of NgCAM (an axonal marker) and LDLR (a dendritic marker). At this stage, labeling of cell surface NgCAM (Center) and LDLR (Right) was primarily observed in the growth cones (arrow). Although the extent of staining varied among different neurites, both the axonal and dendritic markers tended to be concentrated in the same neurites. (Bar, 25 µm.) (b) In stage 3 neurons, axonal and dendritic markers have a complementary distribution, indicating their polarization to different neurites. The micrographs illustrate a stage 3 cell from a 1-day-old culture 18 h after coinfection with NgCAM- and LDLR-encoding adenoviruses. Labeling of cell surface NgCAM (Left) showed a strong polarization to the axon (arrows), including its growth cone, whereas staining of the short dendritic processes (arrowheads) was largely absent. In contrast, cell surface staining of LDLR (Right) was prominent in cell body and dendrites but nearly absent from the axon. (Bar, 25 µm.) (c) As a measure of polarization, we quantified the percentage of staining for each marker protein that was associated with the dendritic arbor. The dendritic proteins TfR and LDLR were already preferentially localized to the dendritic arbor on day 1, and their polarization increased to mature levels by day 5. Likewise, the axonal proteins NgCAM and L1 were preferentially excluded from the dendrites on day 1; their polarization was essentially complete by day 5. A pIgR construct whose sorting signal had been mutated (pIgR665–668) served to illustrate the distribution of an unsorted protein. The percentage of this protein associated with the dendritic membrane decreased slightly during development, paralleling the relative increase in size of the axonal arbor. TfR and pIgR685–668 were expressed with replication defective herpesviruses and LDLR and NgCAM with replication defective adenoviruses. L1 is an endogenous protein. Each point represents data from 10–20 cells examined 12–18 h after infection.
markers were polarized. To investigate this finding in more detail, we expressed a GFP construct of TfR that allowed us to compare the distribution of cell surface TfR-GFP (which could be selectively visualized by antibody staining of living cells) and TfR associated with intracellular organelles, including carrier vesicles and endosomes (which, along with cell surface TfR, could be visualized on the basis of GFP fluorescence).
In stage 2 cells expressing TfR-GFP, GFP-labeled vesicular structures were found in all processes. In stage 3 cells, vesicular GFP-tagged structures could be visualized in the dendrites and the axon, but the number and fluorescence intensity of these organelles was often lower in the axon than in the dendrite. There was a strong correlation between the presence of significant axonal surface labeling and the presence of GFP-tagged intracellular vesicles in the axon. In cells whose surface TfR was highly polarized to the dendrites, GFP-labeled vesicles were absent from the axon (Fig. 2 a). In cells that exhibited significant staining on the cell surface, GFP-labeled organelles were obvious, and the proximodistal distribution of the two was quite similar (Fig. 2 b). In the cell illustrated in Fig. 2 b, for example, the intensity of TfR staining in the distal axon (Fig. 2 b, right, arrows) was similar to that observed on the dendritic cell surface (Fig. 2 b, arrowheads). The staining for TfR and the fluorescence of GFP declined in the proximal axon. We measured the fraction of GFP label and cell surface staining associated with the dendritic compartment for 18 stage 3 cells after 2 days in culture (Fig. 2 c). The two measures were very tightly correlated. These results suggest that when TfR is present in intracellular compartments within the axon, the TfR is delivered to the cell surface.
In contrast to the situation for TfR, the polarized distribution of NgCAM in mature neurons depends on a selectivity mechanism downstream of transport (1). NgCAM carrier vesicles are plentiful in dendrites but seem incompetent to fuse with the dendritic plasma membrane. To determine whether a similar mechanism is responsible for the polarized distribution of NgCAM to the axonal cell surface in stage 3 cells, we examined the cell surface and intracellular distribution of a GFP-tagged version of NgCAM. As for untagged NgCAM (Fig. 1 b Left), we found that cell surface NgCAM-GFP was already polarized to the axonal plasma membrane in stage 3 neurons (Fig. 3). However, vesicular structures labeled with NgCAM-GFP were prominent in both the axon and the dendrites, as observed in mature neurons (1). It is thus tempting to speculate that the same mechanisms are at work to polarize axonal and dendritic membrane proteins throughout development.
Developmental Changes in the Transport of Carrier Vesicles Labeled with TfR-GFP and NgCAM-GFP. To visualize the transport of carrier vesicles, we made time-lapse recordings of neurons expressing TfR-GFP or NgCAM-GFP at times ranging from 2 days to 1 week in culture. For each recording, high-magnification images were acquired continuously over a recording period of 30 sec (600-msec exposures). An example of such a recording from a cell expressing TfR-GFP is illustrated in Fig. 4, along with the method used for data analysis (also see Fig. 6 and Movies 1–4, which are published as supplemental data on the PNAS web site, www.pnas.org). Throughout development, the basic parameters of vesicle transport were essentially the same. The transport of vesicles labeled with either construct was always bidirectional. This observation was true for stage 2 neurites before specification, as well as for axons and dendrites of older cells. The average rate of transport was about 1 µm/sec (range 0.2–2.8 µm/sec). We did not detect differences in the rate of transport between vesicles labeled with TfR and NgCAM, between transport in axons and dendrites, or between transport in the anterograde and retrograde directions.
In stage 2 cells, the transport behavior of NgCAM- and TfR-labeled vesicles was essentially the same. Most neurites exhibited
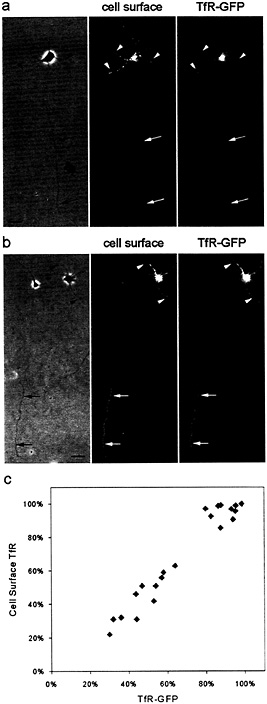
Fig. 2. The polarization of TfR to the dendritic plasma membrane parallels the exclusion of TfR-containing carrier vesicles from the axon. TfR-GFP was expressed by using a defective herpesvirus. Cell surface TfR was assessed by staining living cells with an anti-TfR antibody, whereas GFP fluorescence served as a measure of all expressed TfR, including that associated with intracellular vesicles, (a and b) On day 2, the polarization of TfR varied somewhat from cell to cell. In some cells (a), surface staining for TfR (Center) was absent from the axon (arrows), which was paralleled by the absence of axonal TfR-GFP fluorescence associated with intracellular vesicles (Right). Staining in dendritic processes (arrowheads) was readily observed with both labels. In other cells (b), surface staining and TfR-GFP fluorescence were present in the distal axon (arrows) at a level comparable to that in the dendrites (arrowheads). The GFP fluorescence illustrates all TfR present in cells, including carrier vesicles in dendritic and axonal processes. (Bar, 20 µm.) (c) On the basis of a cell-by-cell comparison, there was a close correlation between the degree of polarization of cell surface TfR and TfR-GFP fluorescence. The total fluorescence in all dendritic processes was expressed as a percentage of the total fluorescence in all neurites including the axon. Cells in culture for 1 day were infected with replication-defective herpesvirus encoding TfR-GFP. After 18 h, living cells were stained with antibody to detect protein expression on the cell surface.
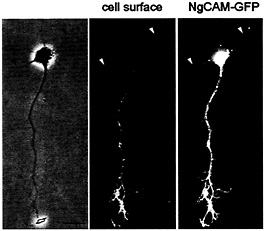
Fig. 3. In stage 3 neurons, cell surface staining for NgCAM was restricted to the axon, whereas vesicles containing NgCAM-GFP were present in all processes (Left, phase contrast; Center, cell surface staining; Right, GFP; arrowheads denote dendrites). Cells in culture for 1 day were infected with replication-defective herpesvirus encoding NgCAM-GFP. After 18 h, living cells were stained with antibody to detect protein expression on the cell surface. (Bar, 20 µm.)
robust bidirectional transport of both types of vesicles. By developmental stage 3, when one of the neurites had grown distinctly longer than the others, the pattern of transport of TfR-containing vesicles had changed dramatically (Fig. 4), whereas there was no change in the transport of NgCAM. In stage 3 neurons, few TfR-labeled vesicles were present in the axon, and the amount of transport was significantly diminished compared to stage 2 neurites and the dendrites of the same cell. Over a 40-µm length of the axon (Fig. 4 b Upper), we could detect only two vesicles that moved in the anterograde direction. In contrast, we detected eight anterograde movements in a 20-µm length of one of the dendrites of this cell (Fig. 4 b Lower). To quantify the amount of transport in each neurite, we generated kymographs (Fig. 4 c), which track vesicle position (shown of the y axis) as a function of time (shown on the x axis; see Methods for details). The marked difference in the number of transport events between axon and dendrites is apparent (Fig. 4 c). Far fewer diagonal lines, corresponding to moving vesicles, are seen in the axon compared to all of the different dendrites. Analysis of the flux of TfR-GFP carrier vesicles in and
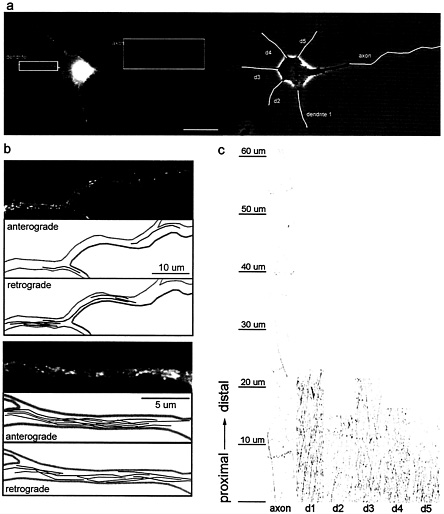
Fig. 4. Comparison of the transport of TfR-GFP carrier vesicles in axons and dendrites of stage 3 cells, (a) A stage 3 neuron expressing TfR-GFP (Right, phase contrast; Left, GFP fluorescence); note the higher level of TfR-GFP fluorescence in the dendrites compared to the faint fluorescence in the proximal axon. Vesicle transport in this cell was recorded over a period of 30 sec, capturing images every 600 msec. Movies 1–4 of these data are published as supplemental data on the PNAS web site, www.pnas.org. (Bar, 20 µm.) (b) Vesicle transport in the proximal axon (Upper) and a representative dendrite (Lower). The topmost panel shows an enlarged view of the axonal segment (boxed in a). The path of each vesicle that moved in the anterograde direction or the retrograde direction during the 30-sec recording is shown in the two succeeding panels. Lower shows an enlarged view of one dendrite (boxed in a), followed by the path of each vesicle that moved in the anterograde and retrograde directions. Many more vesicles travel into the dendrite than the axon. To enable the visualization of faint vesicles in the axon, contrast was enhanced relative to the dendrite. (c) To quantify transport, recordings from TfR-GFP-expressing cells were analyzed by using kymographs, which show anterogradely moving vesicles as diagonal lines with positive slope, whereas retrogradely moving vesicles are represented by lines with negative slopes. This analysis revealed that there is extensive anterograde vesicle traffic into each dendrite but few transport events in the axon.
out of the axon (i.e., the summed translocation of all moving vesicles) revealed a slight bias of transport in the retrograde direction. This finding is consistent with the idea that some of the TfR present in immature axons may be cleared by transport back to the cell body. In dendrites, the transport of TfR shows an anterograde bias. In the case of NgCAM, there was no difference in the number of anterograde transport events in the axon compared to the dendrites.
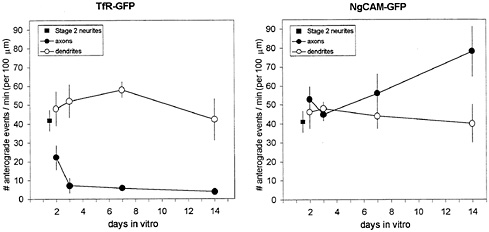
Fig. 5. Changes in the amount of transport of TfR and NgCAM during development in culture. In the case of carrier vesicles labeled with TfR-GFP, the number of anterograde transport events in stage 2 cells (square), which lack an axon, is roughly comparable to the number of events seen in dendrites throughout development (open circles). In contrast, the number of TfR-GFP-containing vesicles entering the developing axon drops abruptly when the cells enter developmental stage 3 (filled circles). In the case of NgCAM, the number of anterograde transport events in dendrites remains constant during development, whereas the number of NgCAM-GFP-containing vesicles entering the axon increases gradually during development. Anterograde transport events were quantified by using kymograph analysis and normalized for the duration of the recording and the length of the neurite included in the image. The data for mature cells (>14 days in culture) were taken from ref. 1.
We used kymograph analyses to assess changes in the amount of vesicle transport in axons and dendrites during development in culture, focusing on the delivery of vesicles carrying these marker proteins to the axonal and dendritic domains. These data are summarized in Fig. 5. Interestingly, the number of transport events in the undifferentiated neurites of stage 2 cells was comparable for both marker proteins. Moreover, the amount of transport found in stage 2 neurites was maintained in the immature dendrites of stage 3 cells. This observation was true for both TfR and NgCAM, even though NgCAM does not appear on the dendritic surface. Even in mature dendrites, whose arbors are many times longer than those of stage 3 cells, the amount of dendritic transport was unchanged. In contrast to the sustained levels of transport in the developing dendrites, we observed a marked decrease in the amount of TfR entering the axon of stage 3 cells. By 2 days, the frequency of anterograde transport into axons had already declined to half that seen in stage 2 neurites. By day 3, the selectivity of TfR transport, measured as the ratio of TfR vesicles entering the axon compared with the dendrites of the same cell, already approached mature levels (1).
Although there was a profound change in the axonal transport of TfR that occurred at developmental stage 3, no change was seen in the axonal transport of NgCAM. The number of NgCAM anterograde transport events in the axons of stage 3 cells was not significantly different from that in the unspecified neurites of stage 2 cells. Instead, the amount of NgCAM transported into the axon increased gradually after day 2, eventually doubling by day 14.
Discussion
To determine the time course of polarization of dendritic and axonal proteins, we used replication-defective herpesviruses and adenoviruses to express two dendritic proteins (TfR and LDLR) and an axonal protein (NgCAM) in hippocampal neurons at different times after plating. We found that TfR, LDLR, NgCAM, and its endogenous homolog, L1, were differentially distributed in neurons at stage 3 of development, as soon as the axon could be unambiguously identified. Polarization reached mature levels by day 5 in culture. These results are consistent with previous studies examining the polarization of the endogenous axonal membrane proteins synapsin I, synaptophysin, and L1 (6, 7), and the endogenous dendritic proteins TfR and telencephalin (10, 11). In contrast, studies examining the distribution of other dendritic membrane proteins, including GluR1, GluR2/3, GABAA receptors, and the LDLR-related protein, have concluded that these proteins are not detectably concentrated in dendrites until stage 4 (8, 9, 22). There are several possible explanations for this discrepancy. It could reflect real differences among the mechanisms that underlie the sorting of different classes of dendritic proteins. Alternatively, it could reflect the difficulty of accurately assessing the polarity of endogenous proteins early in development, when their expression levels are quite low and the extent of their polarization may be lower than in mature neurons. The situation is further complicated because some previous studies examined cells after fixation, thereby revealing intracellular as well as cell surface labeling. We believe that the method used here, based on expression of marker proteins at levels that makes their distribution easy to measure, offers a more accurate method to assess protein polarization in young neurons. One drawback of our approach is that overexpressing exogenous proteins could perturb the sorting machinery, resulting in an underestimate of protein polarization. It is difficult to imagine, however, that overexpression could lead to an overestimate of polarization. Using this approach, we obtained clear quantitative evidence that TfR and LDLR are preferentially concentrated in the dendritic membrane compared with the unpolarized marker pIgR665–668, and that this difference is evident by 1 day in culture.
We also examined changes in the transport behavior of axonal and dendritic carrier vesicles. In stage 2 cells, the transport behavior of NgCAM- and TfR-labeled vesicles was essentially the same. This result is consistent with previous studies, which indicated that stage 2 neurites have not yet been specified as either axons or dendrites (3, 4). The transition from stage 2 to 3 is marked by the rapid and prolonged extension of a single
neurite, which becomes specified as the axon. In discussing mechanisms that might regulate the delivery of new membrane needed for growth, Futerman and Banker (23) raised the possibility that the transport of carrier vesicles may be regulated in accordance with the rate of neurite elongation. According to this view, one might expect the transition from stage 2 to 3 to be accompanied by an increase in the number of axonal carrier vesicles entering the axon. Bradke and Dotti (4) have proposed that the transition from stage 2 to 3 is accompanied by a reorganization of intracellular transport, from multidirectional (into all neurites) to unidirectional (into the emerging axon). According to their model, this concerted change in transport affects a broad variety of organelles, including carrier vesicles conveying both axonal and dendritic proteins, as well as mitochondria and peroxisomes. Our analysis did not reveal the changes in transport predicted by either of these models. In the case of carrier vesicles containing the axonal protein NgCAM, we found no significant increase in the amount of transport into stage 3 axons compared with unspecified stage 2 neurites, nor was the amount of transport into the axon of stage 3 cells greater than into their dendrites. In the case of carrier vesicles conveying the dendritic protein TfR, we did not observe the increase in its axonal trafficking predicted by the Bradke and Dotti model. Instead, far fewer TfR carrier vesicles entered the nascent axon than entered the neurites of stage 2 cells; in stage 3 cells, TfR vesicles were preferentially transported to the dendrites, not to the axon. One important limitation in the current study is that the methods we used for expressing GFP constructs do not yield high levels of expression in very young neurons. Thus we were unable to assess transport before 2 days in culture. It is possible that there are changes in transport that occur concomitantly with axonal specification, but that these changes are not maintained throughout developmental stage 3. Alternative methods will be required to address this possibility.
We have previously shown that in mature neurons, the polarization of NgCAM to the axonal plasma membrane does not depend on directed transport but instead involves events at the plasma membrane, most likely the preferential fusion of NgCAM carrier vesicles with the axonal membrane (ref. 1 and unpublished observations). Because cell surface NgCAM is polarized by stage 3, whereas NgCAM carrier vesicles are transported into both dendrites and axons at this stage, it is tempting to speculate that the same mechanism used in mature cells is responsible for the polarization of NgCAM early in development.
What changes occur in neurons between developmental stages 2 and 3 that might initiate the polarization of cell surface proteins? In the case of dendritic proteins like TfR, it is highly likely that these changes involve the establishment of selective microtubule-based transport. We have shown that carrier vesicles containing TfR are preferentially transported into the dendrites at developmental stage 3, although the selectivity of this process is not as great as in mature cells. Moreover, our results show that at the early stages when TfR-containing vesicles are not fully excluded from the axon, TfR is expressed on the axonal surface. This finding indicates that there is no additional quality control mechanism downstream of transport to prevent TfR-containing vesicles from fusing with the axonal membrane. It is thought that the selective microtubule-based transport that prevents the movement of dendritic carrier vesicles into the axon depends on regional biochemical differences within the neuron (1). These differences might take the form of biochemical differences among microtubules in different regions of the cell or of local differences in the regulation of components of the motor protein-carrier vesicle complex. Of the biochemical characteristics that distinguish axonal from dendritic microtubules in mature neurons, some have been shown to arise early in development. For example, although the microtubule-associated protein t is uniformly distributed in stage 3 neurons, it is differentially phosphorylated in dendrites (24). Similarly, phosphorylated MAP1B is expressed in a proximodistal gradient in axons of cortical and sensory neurons (25, 26). These data suggest that a unique complement of kinase and phosphatase activities is present in developing axons. In addition to producing posttranslational differences in microtubule proteins, local differences in kinase or phosphatase activity could also regulate motor activity or the interaction of motor proteins with cargo vesicles, thereby inhibiting the delivery of dendritic carrier vesicles to the axon (27–29). Similarly, local posttranslational modifications could selectively regulate the vesicle fusion machinery, potentially inhibiting the fusion of NgCAM carrier vesicle in the dendritic domain (30).
We thank Hannelore Asmussen, Jon Muyskens, and Barbara Smoody for the preparation of neuronal cultures, and Silvia LaRue, Julie Harp, and Sarah Godsey for excellent technical assistance. This work was supported by National Institutes of Health Grant NS17112.
1. Burack, M.A., Silverman, M.A. & Banker, G. (2000) Neuron 26, 465–472.
2. Dotti, C.G., Sullivan, C.A. & Banker, G.A. (1988) J. Neurosci. 8, 1454–1468.
3. Craig, A.M. & Banker, G. (1994) Annu. Rev. Neurosci. 17, 267–310.
4. Bradke, F. & Dotti, C.G. (2000) Curr. Opin. Neurobiol. 10, 574–581.
5. Esch, T., Lemmon, V. & Banker, G. (2000) J. Neurocytol. 29, 215–223.
6. van den Pol, A.N. & Kim, W.T. (1993) J. Comp. Neurol. 332, 237–257.
7. Fletcher, T.L., Cameron, P., De Camilli, P. & Banker, G. (1991) J. Neurosci. 11, 1617–1626.
8. Brown, M.D., Banker, G.A., Hussaini, I.M., Gonias, S.L. & VandenBerg, S.R. (1997) Brain Res. 747, 313–317.
9. Killisch, I., Dotti, C.G., Laurie, D.J., Luddens, H. & Seeburg, P.H. (1991) Neuron 7, 927–936.
10. Mundigl, O., Matteoli, M., Daniell, L., Thomas-Reetz, A., Metcalf, A., Jahn, R. & De Camilli, P. (1993) J. Cell Biol. 122, 1207–1221.
11. Benson, D.L., Yoshihara, Y. & Mori, K. (1998) J. Neurosci. Res. 52, 43–53.
12. Casanova, J.E., Apodaca, G. & Mostov, K.E. (1991) Cell 66, 65–75.
13. Herz, J. & Gerard, R.D. (1993) Proc. Natl. Acad. Sci. USA 90, 2812–2816.
14. Kowal, R.C., Herz, J., Goldstein, J.L., Esser, V. & Brown, M.S. (1989) Proc. Natl. Acad. Sci. USA 86, 5810–5814.
15. Lemmon, V. & McLoon, S.C. (1986) J. Neurosci. 6, 2987–2994.
16. Jing, S.Q., Spencer, T., Miller, K., Hopkins, C. & Trowbridge, I.S. (1990) J. Cell Biol. 110, 283–294.
17. Omary, M.B. & Trowbridge, I.S. (1981) J. Biol. Chem. 256, 12888–12892.
18. Goslin, K., Asmussen, H. & Banker, G. (1998) in Culturing Nerve Cells, eds. Banker, G. & Goslin, K. (MIT Press, Cambridge, MA), pp. 339–370.
19. Jareb, M. & Banker, G. (1998) Neuron 20, 855–867.
20. West, A.E., Neve, R.L. & Buckley, K.M. (1997) J. Neurosci. 17, 6038–6047.
21. Goslin, K., Schreyer, D.J., Skene, J.H. & Banker, G. (1990) J. Neurosci. 10, 588–602.
22. Craig, A.M., Blackstone, C.D., Huganir, R.L. & Banker, G. (1993) Neuron 10, 1055–1068.
23. Futerman, A.H. & Banker, G.A. (1996) Trends Neurosci. 19, 144–149.
24. Mandell, J.W. & Banker, G.A. (1996) J. Neurosci. 16, 5727–5740.
25. Mansfield, S.G., Diaz-Nido, J., Gordon-Weeks, P.R. & Avila, J. (1991) J. Neurocytol. 20, 1007–1022.
26. Bush, M.S., Goold, R.G., Moya, F. & Gordon-Weeks, P.R. (1996) Eur. J. Neurosci. 8, 235–248.
27. Thaler, C.D. & Haimo, L.T. (1996) Int. Rev. Cytol. 164, 269–327.
28. Sato-Harada, R., Okabe, S., Umeyama, T., Kanai, Y. & Hirokawa, N. (1996) Cell Struct. Funct. 21, 283–295.
29. Reese, E.L. & Haimo, L.T. (2000) J. Cell Biol. 151, 155–166.
30. Hsu, S.C., Hazuka, C.D., Foletti, D.L. & Scheller, R.H. (1999) Trends Cell Biol. 9, 150–153.


