
I
Estimating Land-based Sources of Oil in the Sea
Because of the scarcity of available data for estimating land-based loads of oil to the sea from individual sources (i.e., municipal wastewaters, nonrefinery industrial discharge, refinery discharges, urban runoff, river discharges, and ocean dumping), loading estimates presented in this analysis were based on loading from all land-based sources per unit of urban land area. These calculations assumed that most of the contributions of petroleum hydrocarbons to the sea from land-based sources were from urban areas. This approach accounted for loading from all of the sources in the United States and Canada, with the exception of Gulf coast loadings from coastal refineries, which was calculated separately. The overall calculations of hydrocarbon loadings from all land-based sources for the United States and Canada were then extrapolated to other regions of the world to form a world estimate.
METHODOLOGY AND SOURCES OF THE DATA
A review of the U. S. Environmental Protection Agency’s STORET data base revealed oil and grease data for only nine major rivers in the United States, and several of these consisted of very few observations. Even fewer rivers (i.e., Brazos, Delaware, and Trinity) had hydrocarbon data. The dominance of oil and grease data measured using either the Soxhlet extraction method (tot-sxlt) or liquid-liquid extraction (freon-gr) methods in the available STORET data led to the use of measured oil and grease concentrations as the basis for estimates presented in this analysis.
Quantified estimates of oil and grease and petroleum hydrocarbon loadings were made for the United States and Canada. These estimates were made using unit loadings per urban land area. The annual loadings were calculated according to the coastal zones defined in this study, and the overall loadings for the United States and Canada were extrapolated to the world.
For the calculations in the United States and Canada, the land-based sources were divided into two categories: inland basins and coastal basins. It was assumed that inland basins discharged into one of the following major river basins that outlet to the sea along the coast of the United States and Canada (coastal basins were assumed to discharge directly to the sea):
-
Alabama-Tombigbee
-
Altamaha
-
Apalachicola
-
Brazos
-
Colorado (Texas)
-
Columbia
-
Copper (Arkansas)
-
Delaware
-
Hudson
-
James
-
Mississippi
-
Neuse
-
Potomac
-
Rio Grande
-
Roanoke
-
Sabine
-
Sacramento
-
St. Lawrence
-
Santee
-
San Joaquin
-
Saskatchewan
-
Savannah
-
Susitna
-
Susquehanna
-
Trinity
-
Yukon
Calculations for the Inland Rivers of the United States and Canada
The following methodology was used to estimate the loading of oil and grease to the sea from inland river basins in the United States and Canada:
-
The location of the mouth of each river was determined on a map. These locations were then expanded into regions of interest (generally defined by the latitude and longitude of the lowest U.S. Geological Survey (USGS) gauging station and a radius around that point; see Table I-1) for which water quality data were requested from STORET. Searches were made for all surface water quality data collected within these regions.
Data for the following parameter codes were then requested from STORET if they were included in the data summaries for the regions:
-
Parameter code 00550: oil-grse tot-sxlt (mg L−1)
-
Parameter code 00552: oil-grse tot-hexn (mg L−1)
-
Parameter code 00556: oil-grse freon-gr (mg L−1)
-
Parameter code 00560: oil-grse freon-ir (mg L−1)
-
Parameter code 03582: oil and grease tot wtr (mg L−1)
-
Parameter code 45501: hydrocarbon ir (mg L−1)
-
-
Averages of all reported values in STORET for the parameter codes listed were compiled for each river (Table I-2) with the following assumptions (rivers not shown in Table I-2 did not have any usable oil and grease data):
-
Only ‘ambient’ readings in freshwater rivers were included; this means that values reported for industrial or municipal effluents, nonambient conditions, sediment, and/or ocean/estuary locations were not included in the average.
-
Some values were reported to be ‘off-scale low,’ which meant that the actual value was not known, but was known to be less than the value shown. To calculate our averages, we set these values to one-half their reported value.
-
For those rivers with data in the 1990s, average concentrations for that period were calculated.
-
-
An average annual load in tonne yr−1 was calculated for those rivers with reported oil and grease data by using the following formula:
TABLE I-1 Regions Searched for Oil and Grease and Hydrocarbon Data from STORET
|
River |
Latitude |
Longitude |
Radius (mi) |
|
Alabama-Tombigbee |
32º00′00″, 30º00′00″ |
−87º15′00″, −88º15′00″ |
See notea |
|
Altamaha |
32º31′30″ |
−81º15′45″ |
50 |
|
Apalachicola |
See note b |
|
|
|
Brazos |
29º34′56″ |
−95º45′27″ |
50 |
|
Colorado (TX) |
28º58′26″ |
−96º00′44″ |
30 |
|
Columbia |
46º10′55″ |
−123º10′50″ |
50 |
|
Copper (AK) |
61º00′00″ |
−144º45′00″ |
50 |
|
Delaware |
39º30′03″ |
−75º34′07″ |
30 |
|
Hudson |
41º43′18″ |
−73º56′28″ |
40 |
|
James |
37º24′00″ |
−77º18′00″ |
50 |
|
Mississippi |
29º16′26″ |
−89º21′00″ |
50 |
|
Neuse |
35º06′33″ |
−77º01′59″ |
50 |
|
Potomac |
38º55′46″ |
−77º07′02″ |
75 |
|
Rio Grande |
25º52′35″ |
−97º27′15″ |
30 |
|
Roanoke |
35º54′54″ |
−76º43′22″ |
70 |
|
Sabine |
30º18′13″ |
−93º44′37″ |
50 |
|
Sacramento |
37º30′00″, 38º30′00″ |
−121º00′00″, −123º00′00″ |
See notea |
|
St. Lawrence |
45º00′22″ |
−74º47′43″ |
50 |
|
Santee |
33º14′00″ |
−79º30′00″ |
40 |
|
San Joaquin |
37º30′00″, 38º30′00″ |
−121º00′00″, −123º00′00″ |
See notea |
|
Saskatchewan |
See noteb |
|
|
|
Savannah |
32º31′30″ |
−81º15′45″ |
50 |
|
Susitna |
61º35′00″ |
−150º22′00″ |
40 |
|
Susquehanna |
39º42′00″ |
−76º15′00″ |
50 |
|
Trinity |
29º50′10″ |
−94º44′57″ |
30 |
|
Yukon |
62º45′00″ |
−164º30′00″ |
30 |
|
NOTES: aRectangular polygons formed by the latitudinal and longitudinal coordinates shown were requested for these rivers; bNo data were requested for the Appalachicola and Saskatchewan Rivers. |
|||
TABLE I-2 STORET Data Used to Calculate Average Oil and Grease Concentrations in Major Inland Rivers
|
River |
Station name |
Parameter code |
# of observations |
Date(s) of observations |
Average concentration (mg L−1) |
|
Columbia |
Columbia River at Bradwood, OR |
00550 |
27 |
4/24/74−10/17/78 |
1.80 |
|
Delaware |
Delaware Rvr-2000 yds up buoy R6M-Marcus Hook |
00556 |
107 |
5/23/88−12/29/98 |
6.00 |
|
Delaware (1990s) |
Delaware Rvr-2000 yds up buoy R6M-Marcus Hook |
00556 |
99 |
1/22/90−12/29/98 |
5.80 |
|
Hudson |
Hudson River below Poughkeepsie, NY |
00550 |
2 |
6/4/70−9/7/71 |
60.50 |
|
James |
Buoy 8 (City of Hopewell) |
00556 |
1 |
7/20/92 |
19.30 |
|
Mississippi |
Mississippi River at Venice, LA |
00556 |
229 |
10/4/73−11/19/96 |
1.74 |
|
Mississippi (1990s) |
Mississippi River at Venice, LA |
00556 |
46 |
1/11/90−11/19/96 |
0.84 |
|
Neuse |
Neuse River at 3 locations |
00550 |
7 |
6/6/73−6/7/73 |
0.00 |
|
Sabine |
Sabine River at Ruliff, TX |
00556 |
45 |
3/27/74−5/9/78 |
2.50 |
|
Sacramento |
Sacramento River at Freeport, CA |
00550 |
4 |
10/25/91−2/2/92 |
0.83 |
|
Susquehanna |
Susquehanna R at Rte 40 bridge |
00500 |
2 |
8/3/78 |
0.00 |
|
Trinity |
Trinity River at Liberty, TX |
00550 |
11 |
5/4/71−8/31/72 |
8.18 |
-
Equation I-1
Li=ciQi,
where Li= average annual load for river i (tonne yr−1),
ci= average oil and grease concentration for river i (mg L−1),
Qi= average annual flow for river i (m3 yr−1),
tonne= 106 g.
The average annual flow (per calendar year) was determined from USGS daily flow data available for each of the rivers at the nearest nontidally influenced station to that of the reported oil and grease data (Table I-3). For calculations of loads using average concentrations in the 1990s only, average annual flows for those rivers were calculated using only daily flow data from the 1990s.
-
Using data obtained from the U.S. Bureau of the Census (1998), unit loads per urban land area were calculated as follows:
Equation I-2
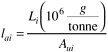
where lai= unit load per urban land area for river i (g m−2 yr),
Aui= 1996 urban land area for river i (m2).
The 1996 urban land area in each river basin was determined by using Table I-1 in U.S. Bureau of the Census (1998), which contained land area data for metropolitan areas defined as of June 30, 1996. Metropolitan areas in this table were partitioned into the major river basins identified in Table I-1, coastal areas, the Great Lakes, or areas not discharging to the coast of the United States or Canada (e.g., Great Salt Lake basin). Metropolitan areas contributing urban runoff to the Great Lakes or areas not discharging to the coast of the United States or Canada were not included further in the analysis. It was assumed that oil and grease dis
TABLE I-3 USGS Gages Used to Calculate Average Annual Flows for Major Inland Rivers
|
River |
Station name |
Period of record used |
Average annual flow (m3 yr−1) |
|
Columbia |
14246900: Columbia R at Beaver Army Terminal nr Quincy, Ore |
1969, 1992-1997 |
220,892,000,000 |
|
Delaware |
01463500: Delaware River at Trenton, NJ |
1913-1997 |
10,441,000,000 |
|
Delaware (1990s) |
01463500: Delaware River at Trenton, NJ |
1990-1997 |
10,712,000,000 |
|
Hudson |
01358000: Hudson River at Green Island, NY |
1947-1996 |
12,365,000,000 |
|
James |
02037500: James River near Richmond, VA |
1938-1997 |
6,209,000,000 |
|
Mississippi |
07289000: Mississippi River at Vicksburg, MS |
1932-1997 |
537,114,500,000 |
|
Mississippi (1990s) |
07289000: Mississippi River at Vicksburg, MS |
1990-1997 |
625,760,000,000 |
|
Neusea |
02089500: Neuse River at Kinston, NC |
1983-1997 |
3,524,394,745 |
|
Sabine |
08030500: Sabine River nr Ruliff, TX |
1960-1997 |
7,043,181,292 |
|
Sacramento |
11447650: Sacramento River at Freeport, CA |
1949-1997 |
21,000,000,000 |
|
Susquehanna |
01578310: Susquehanna River at Conowingo, MD |
1968-1997 |
36,779,000,000 |
|
Trinityb |
08067000: Trinity River at Liberty, TX |
1977, 1979-1986 |
8,944,000,000 |
|
NOTES: aadjusted to Station 02091814 using 1997 data; bmissing flows regressed with Station 08066500: Trinity River at Romayor, TX (y = 0.8559x + 4047.8). |
|||
-
charged to the Great Lakes would be biochemically reduced, or would attach to solids and settle out during the extended residence time in the lakes and would therefore not make it to the ocean. Likewise, closed inland basins such as the Great Salt Lake would not discharge to the sea. (Contact NRC staff to obtain information describing how specific metropolitan areas were classified as contributing to major river basins.)
-
For the majority of the inland river basins, no usable oil and grease data were available in STORET. In addition, the number of observations for the Hudson, James, Neuse, Sacramento, and Susquehanna rivers was very small (2, 1, 7, 4 and 2, respectively). It was therefore decided to use an alternative procedure based on the unit loads of oil and grease per urban land area and per capita calculated from Steps 1-4 to estimate the contributions of oil and grease from these other river basins. The procedure was as follows:
-
The unit loads of oil and grease per urban land area calculated from Steps 1-4 were used for the other river basins with the following assumptions:
-
The Hudson and James rivers were assumed to have unit loads of oil and grease per urban land area of 12.22 g m−2 yr−1, the values calculated from 99 observations in the 1990s on the Delaware River. The high unit loadings on the Delaware River are likely due to the highly industrialized nature of the waterway, and the Hudson and James rivers are also very industrialized.
-
It was assumed that Alaskan rivers (i.e., Copper, Susitna, and Yukon rivers) did not contribute significant loads of oil and grease to the ocean.
-
All other rivers for which measured data were not adequate or were unavailable were assumed to have unit loads of oil and grease per urban land area of 1.25 g m−2 yr−1. This value was based on the average annual loading for 1990s data from the Mississippi and Delaware rivers together divided by the urban areas in both basins. Rivers for which this value applied included the Alabama-Tombigbee, Altamaha, Apalachicola, Brazos, Colorado (Texas), Columbia, Neuse, Potomac, Rio Grande, Roanoke, Sabine, Sacramento, St. Lawrence, Santee, San Joaquin, Saskatchewan, Savannah, Susquehanna, and Trinity rivers.
-
-
Using data obtained from the U.S. Bureau of the Census (1998) and Statistics Canada (2000), the annual loads per unit land area (Lai) were calculated as follows:
Equation I-3
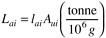
where lai was the unit load for river i as described in Step 5.a. The urban land area, Aui, was calculated in the same manner as described in Step 4 for metropolitan areas in the United States. For metropolitan areas in Canada, Aui was calculated using data from Statistics Canada (2000).
-
Calculations for the Coastal Zones of the United States and Canada
For the United States, metropolitan areas in U.S. Bureau of the Census (1998) were classified as contributing to coastal basins if they fell within one of the 451 coastal counties defined by Culliton et al. (1990). The individual coastal basin metropolitan areas were then aggregated into the appropriate coastal zones in Figure 1-7. The data for 1997 urban land area for metropolitan areas as of June 30, 1996 (U.S. Bureau of the Census, 1998) were then compiled for each coastal zone. Similarly, data from Statistics Canada (2000) for Canadian metropolitan areas along the coast were grouped into the appropriate coastal zones.
The annual load Lai was calculated for urban areas in each coastal zone i in the United States and Canada using Equation I-3. The unit load per urban land area for coastal zone i, lai, was 12.22 g m−2 yr−1 for coastal zone D, and 1.25 g m−2 yr−1 for all other coastal zones. The unit loads were set at higher values for Coastal Zone D because that is the coastal zone to which the Delaware River discharges. (Contact NRC staff to obtain information describing how specific metropolitan areas were classified as contributing to various coastal zones.)
Because almost one-fourth of the crude oil distillation capacity of the United States is located along the Gulf coast (Radler, 1999), the petroleum refining industry discharges a substantial amount of additional oil and grease to coastal waters in that area. To estimate this contribution, data for oil refineries in Louisiana and Texas (from Radler, 1999) were used to estimate the operating capacity of coastal refineries in these states (Table I-4). The petroleum hydrocarbon discharge was determined by multiplying the operating capacity by an assumed rate of hydrocarbon loss that corresponded to effluent guidelines for these discharges (American Petroleum Institute, National Ocean Industries Association, and Offshore Operators Committee, 2001):
|
Daily maximum: |
6.0 lbs per 1000 barrels of crude produced |
|
Monthly average: |
3.2 lbs per 1000 barrels of crude produced |
Calculations using each of these guidelines were made, and the average of the two calculations was used as a best estimate of the loadings. This discharge was added to the coastal discharge for coastal zone G.
TABLE I-4 Estimated Petroleum Hydrocarbon Discharge to Gulf Coast from Petroleum Refining Industry
|
State |
No. of Operable Refineries on Coasta |
Crude Distillation Capacitya (bbl d−1) |
Crude Distillation Capacityb (106 tonne yr−1) |
Oil and Grease Discharge—Lowc (tonne yr−1) |
Oil and Grease Discharge—Highd (tonne yr−1) |
Oil and Grease Discharge—Averagee (tonne yr−1) |
|
Texas |
14 |
2,836,100 |
125466.7 |
1,503 |
2,160 |
2,817 |
|
Louisiana |
7 |
948,105 |
124210.5 |
502 |
722 |
942 |
|
TOTAL |
21 |
3,784,205 |
|
2,005 |
2,882 |
3,759 |
|
NOTES: aSOURCE: Radler (1999); b106 tonne yr−1 = 19,000 bbl d−1; cassuming 3.2 lbs of oil and grease are produced per 1000 bbl produced; dassuming 6.0 lbs of oil and grease are produced per 1000 bbl produced; eaverage of low and high estimates. |
||||||
The total oil and grease loading was determined by adding discharges from inland rivers, urban coastal areas, and the petroleum refinery discharges in the Gulf of Mexico to the appropriate coastal zones.
World Estimates of Oil and Grease
The data used for the calculations of oil and grease loading for North America were not available for other regions of the world. Therefore, a method was needed to extrapolate the North American calculations to the rest of the world. It is widely thought that land-based contributions of oil and grease are due primarily to vehicle operation and maintenance (Bomboi and Hernández, 1991; Fam et al., 1987; Hoffman and Quinn, 1987a, 1987b; Latimer et al., 1990; Latimer and Quinn, 1998; Zeng and Vista, 1997). Thus, oil and grease loading estimates for the world were based on the number of motor vehicles in different regions of the world as reported by World Resources Institute (1998). Oil and grease loading per vehicle in North America (the United States and Canada) was estimated by using Equations I-4 and I-5.
Equation I-4
VEHNA=PNAvehNA=304,078,000×0.72
=218.936,160veh
|
where VEHNA = |
number of vehicles in North America, |
|
PNA = |
population of North America (World Resources Institute, 1998), |
|
vehNA = |
number of vehicles per capita in North America (World Resources Institute,1998). |
Equation I-5
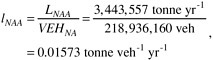
|
where lNAA = |
loading per vehicle in North America based on urban area calculations of total annual load, |
|
LNAA = |
annual load of land-based contributions of oil and grease in North America based on urban area calculations (from previous calculations; see Table F-9). |
The numbers of vehicles in regions of the world were determined by applying Equation I-4 to regional data in World Resources Institute (1998). These numbers of vehicles were then multiplied by the loading per vehicle in North America obtained from Equation I-5 to obtain a world estimate of loading of oil and grease to the sea via land-based contributions. Because data on actual vehicle usage and maintenance in other countries were unavailable, it was assumed that the loadings of oil and grease per vehicle in North America were representative of oil and grease loadings per vehicle in other parts of the world. This assumption was considered reasonable because, while motor vehicles in other countries of the world are not as well maintained as vehicles in North America and therefore would likely contribute more oil and grease per vehicle while running, motor vehicles are less frequently used in other regions of the world.
Calculations for the Coastal Basins of Mexico
Because of a lack of data regarding urban land area for metropolitan areas in Mexico, the following method was used to calculate the land-based contributions of oil and grease to coastal zones H and I:
-
Oil and grease loading from Mexico was estimated using Equation I-4 with population and per capita motor vehicle data from World Resources Institute (1998), and then multiplying by the estimated loading per vehicle for the United States and Canada. These calculations yielded a total oil and grease loading from Mexico of 165,801 tonne yr−1.
-
Metropolitan areas in Mexico with populations of more than 100,000 inhabitants as of 1990 (United Nations, 1998) were partitioned into either coastal zone H or I depending on whether urban drainage from those areas drained to the Gulf of Mexico (zone H) or the Pacific Ocean (zone I). Mexico City and urban areas to the north and east drain to the Grand
-
Drainage Canal, eventually flowing to the Gulf of Mexico (National Research Council, 1995b), and were therefore included in coastal zone H. (Contact NRC staff to obtain a listing of the urban areas and corresponding 1990 populations in each coastal zone.)
-
The oil and grease loading calculated in Step 1 was allocated to each coastal zone according to the percentage of the Mexican urban population allocated to that coastal zone. Thus, 65 percent of the total oil and grease loading from Mexico was allocated to coastal zone H, and the rest was allocated to coastal zone I.
Estimates of Petroleum Hydrocarbons and Polycyclic Aromatic Hydrocarbons
The land-based loading calculations of oil and grease described thus far were based on available data from the STORET database that was measured using either the Soxhlet extraction method or liquid-liquid extraction method. These methods determine groups of substances with similar physical characteristics on the basis of their common solubility in a specified solvent (American Society for Testing and Materials, 1999). Thus, “oil and grease” as measured by these methods includes not only petroleum hydrocarbons but also other substances, such as lipid material (American Society for Testing and Materials, 1999; Hoffman and Quinn, 1987a). An investigation was done of published literature to determine if quantifications have been made of the amount of petroleum hydrocarbons or polycyclic aromatic hydrocarbons (PAH) in oil and grease. The literature search revealed a scattering of studies that were generally focused on oil and grease data or specific hydrocarbons, but seldom on total hydrocarbons in oil and grease (Table I-5).
Eganhouse and Kaplan’s (1982) study of effluents from wastewater treatment plants in southern California remains the principal study that estimated the proportion of total hydrocarbons in oil and grease. The factor of 0.38 that was applied to oil and grease estimates in the previous National Research Council (1985) report to estimate petroleum hydrocarbon contributions from municipal wastewaters was obtained from the Eganhouse and Kaplan (1982) study. However, wastewater effluent in southern California is not representative of the petroleum hydrocarbon fraction in oil and grease in river water because there are many sources of petroleum hydrocarbons and oil and grease besides municipal wastewaters, the composition of petroleum-derived hydrocarbons varies widely from place to place, and there could be other sources of hydrocarbons such as those produced naturally by aquatic organisms that could be included in oil and grease measurements (Laws, 1993).
New studies were not available that compared concentrations of PAH or total hydrocarbons to oil and grease in water, but Michel (2001) provided data of measured total PAH on the lower Mississippi River in December 2000. These measurements were taken as a result of a spill on the river, but the background measurements of total PAH at three river stations varied from 100 to 156 ng L−1, with an average of 128.3 ng L−1. Using the average oil and grease concentration for the Mississippi River of 0.84 mg L−1 from the STORET data (see Table I-2), the estimated percentage of PAH in oil and grease in the Mississippi River would be about 0.015% based on the average total PAH concentration.
PAH typically constitute 0.1-1% of total petroleum hydrocarbons in oil (Wang et al., 1999b). However, since PAH are fairly soluble in water, they likely constitute a larger portion of total petroleum hydrocarbons in oil in water, so the range was expanded to 0.1-10% of total petroleum hydrocarbons, which was verified with comparisons of relative amounts of measured PAH and total hydrocarbons in water in studies in the literature (Table I-6). Thus, estimates of total petroleum hydrocarbons in the Mississippi River based on the December 2000 average PAH data of Michel (2001) would be from 1280 to 128,000 ng L−1. These estimates, when compared to the measured average oil and grease concentrations in the Mississippi River, are 0.15% to 15% of oil and grease, with a best estimate of 1.5%. The best estimate of total hydrocarbon loading from land-based sources was therefore calculated as 1.5% of the best estimate of oil and grease loading.
RESULTS
The average annual loads of oil and grease discharged to the sea were calculated for those rivers with reported oil and grease data in STORET (Table I-7). These total loads were then normalized to unit loads per urban land area. The final estimates of land-based contributions of oil and grease to the sea via all major inland river basins in the United States and Canada were then determined using the 1990s oil and grease data for the Delaware and Mississippi Rivers (Table I-8) with urban land area data from U.S. Bureau of Census (1998) and Statistics Canada (2000). About two-fifths of the estimated loading in North America was determined from actual measured data in STORET, with the remainder determined using the unit load approach.
The estimates of land-based contributions of oil and grease to the sea from both major inland rivers and coastal areas in the United States and Canada were totaled by coastal basin (Table I-9). Table F-9 also shows calculated values for coastal zones in Mexico, but these loads were not included in the totals for North America (i.e., the United States and Canada). The total loading for North America (3.4 million tonne yr−1) was used to obtain a world estimate of land-based oil and grease loading (9.4 million tonne yr−1; Table I-10). The regional distribution of this loading shows that North America and Europe contribute the majority of land-based oil and grease to the sea.
A factor of 0.015 was applied to the total oil and grease loading to estimate the fraction of hydrocarbons in oil and grease. The estimated worldwide loading of hydrocarbons to
TABLE I-5 Summary of Literature Review for Oil and Grease, Hydrocarbon, and Polycyclic Aromatic Hydrocarbon (PAH) Data Due to Land-based Discharges
|
Citation |
Description |
|
Abdullah et al. (1994) |
Hydrocarbons (in oil equivalents) in ocean in Peninsular Malaysia |
|
Abdullah et al. (1996) |
Oil and grease and hydrocarbons (in oil equivalents) in ocean in Peninsular Malaysia |
|
Baker (1983) |
Synthesis of world hydrocarbon inputs |
|
Bamford et al. (1999a) |
PAH in the Patapsco River, an urbanized subestuary of the Chesapeake Bay |
|
Bidleman et al. (1990) |
Hydrocarbons in South Carolina estuaries |
|
Bomboi and Hernández (1991) |
PAH and hydrocarbons in urban runoff in Madrid, Spain |
|
Burns and Saliot (1986) |
Synthesis of hydrocarbon budget for Mediterranean Sea |
|
Carey et al. (1990) |
Hydrocarbons and PAH in the Mackenzie River, Canada |
|
Cole et al. (1984) |
PAH in urban runoff |
|
Connell (1982) |
Hydrocarbon budget for estuary near New York, NY |
|
Cross et al. (1987) |
PAH and hydrocarbons in coastal Los Angeles, CA |
|
Crunkilton and DeVita (1997) |
PAH in Lincoln Creek, WI |
|
DeLeon et al. (1986) |
PAH and hydrocarbons in the Mississippi River |
|
Eganhouse and Kaplan (1981) |
Hydrocarbons in urban runoff in southern California |
|
Eganhouse et al. (1981) |
Hydrocarbons in urban runoff in southern California |
|
Fam et al. (1987) |
PAH and hydrocarbons in urban runoff from watersheds in San Francisco Bay, CA |
|
Frankel (1995) |
Synthesis of world oil and grease in industrial discharges |
|
Freedman (1989) |
Synthesis of hydrocarbon inputs to world’s oceans |
|
Fulton et al. (1993) |
PAH in South Carolina estuaries |
|
Gleick (1993) |
Synthesis of oil and grease in industrial discharges |
|
Gupta et al. (1981) |
Oil and grease in highway runoff at several locations in US; FHWA report |
|
Hall and Anderson (1988) |
Hydrocarbons in urban runoff in Burnaby, British Columbia, Canada |
|
Hoffman et al. (1983) |
Hydrocarbons in urban runoff in Narragansett Bay, RI |
|
Hoffman et al. (1984) |
PAH in urban runoff in RI |
|
Hoffman et al. (1985) |
PAH and hydrocarbons in highway runoff in RI |
|
Hoffman and Quinn (1987a, 1987b) |
Oil and grease, PAH and hydrocarbons in wastewater treatment plant effluent and urban runoff in combined sewer overflows in RI |
|
Horsfall et al. (1994) |
Hydrocarbons in New Calabar River, Nigeria |
|
Hunter et al. (1979) |
Hydrocarbons in urban runoff for Philadelphia, PA |
|
Ishaq (1992) |
Oil and grease in urban runoff in Riyadh, Saudi Arabia |
|
Ishaq and Alassar (1999) |
Oil and grease in urban runoff in Dharan City, Saudi Arabia |
|
Jensen and Jørgensen (1984) |
Synthesis of oil and grease and hydrocarbon inputs to the Baltic Sea |
|
Kneip et al. (1982) |
Synthesis of oil and grease and hydrocarbons in nonpoint source pollution to New York Bight |
|
Latimer et al. (1990) |
PAH and hydrocarbons in urban runoff in Rhode Island |
|
Latimer and Quinn (1998) |
Hydrocarbons in dry weather inputs to Narragansett Bay, RI |
|
Laws (1993) |
Synthesis of world hydrocarbon inputs |
|
Levins et al. (1979) |
Oil and grease in sewage treatment plant effluents at locations in US; EPA report |
|
Lopes and Dionne (1998) |
Synthesis of oil and grease, PAH, and hydrocarbons in highway runoff and urban stormwater |
|
MacKenzie and Hunter (1979) |
PAH and hydrocarbons in urban runoff for Philadelphia, PA |
|
Makepeace et al. (1995) |
Synthesis of oil and grease and hydrocarbons in urban runoff |
|
Mastran et al. (1994) |
PAH in Occoquan Reservoir, VA due to boating activity |
|
McCarthy et al. (1997) |
PAH in Slave River, Canada |
|
McFall et al. (1985) |
PAH in water column of Lake Pontchartrain, LA |
|
Michael (1982) |
Synthesis of oil and grease and hydrocarbon inputs to New York Bight |
|
NOAA (1987) |
Oil and grease, PAH and hydrocarbon inputs to Narragansett Bay, RI |
|
NRC (1985) |
Synthesis of world oil and grease and hydrocarbon inputs to the ocean |
|
Odokuma and Okpokwasili (1997) |
Oil and grease in New Calabar River, Nigeria |
|
OTA (1987) |
Synthesis of oil and grease contributions to coastal waters in US |
|
Owe et al. (1982) |
Hydrocarbons in urban runoff for Syracuse, NY |
|
Perry and McIntyre (1986) |
Oil and grease and PAH in highway runoff near London, UK |
|
Perry and McIntyre (1987) |
Oil and grease and PAH in highway runoff near London, UK |
|
Petty et al. (1998) |
PAH in Missouri River following flood of 1993 |
|
Pham and Proulx (1997) |
PAH in Montreal wastewater and St. Lawrence River |
|
Pham et al. (1999) |
PAH in Montreal wastewater and St. Lawrence River |
|
Rifai et al. (1993) |
Oil and grease inputs to Galveston Bay, TX |
|
Roesner (1982) |
Synthesis of oil and grease in urban runoff at various locations in US |
|
Rogers (1994) |
Synthesis of oil and grease in combined sewer overflows and urban runoff |
|
Schiff and Stevenson (1996) |
Oil and grease in urban runoff in San Diego, CA |
TABLE I-6 Comparisons of PAH and Total Hydrocarbon Concentrations in Water in Literature
|
Reference |
Description |
Total PAH or Aromatics (ng L−1) |
Total Hydrocarbons (TH) (ng L−1) |
Ratio of PAH:TH |
|
Bomboi and Hernández (1991) |
Urban runoff in Madrid, Spain |
27,800 |
1,181,800 |
0.0235 |
|
DeLeon et al. (1986) |
Mississippi River |
79 |
435 |
0.1816 |
|
Eganhouse and Kaplan (1981) |
Los Angeles River storm runoff (est.) |
1,600,000 |
13,100,000 |
0.1221 |
|
Hunter et al. (1979) |
Philadelphia urban runoff |
1,120,000 |
3,690,000 |
0.3035 |
|
Maldonado et al. (1999) |
Black Sea |
0.045−2.219 |
1.61−100 |
0.00045−0.0279 |
TABLE I-7 Calculated Annual and Unit Loads of Oil and Grease for Major Inland Rivers in North America with STORET Data
|
River |
Land Areaa (m2) |
Populationb |
Average Annual Load (tonne yr−1) |
Unit Load per Urban Land Area (g m−2 yr−1) |
|
Columbia |
30,466,548,140 |
1,263,460 |
397,606 |
13.05 |
|
Delaware |
5,082,592,668 |
967,893 |
62,646 |
12.33 |
|
Delaware (1990s) |
5,082,592,668 |
967,893 |
62,130 |
12.22 |
|
Hudson |
21,972,423,133 |
1,432,124 |
748,083 |
34.05 |
|
James |
7,686,825,713 |
354,043 |
119,834 |
15.59 |
|
Mississippi |
463,617,454,706 |
40,383,189 |
934,579 |
2.02 |
|
Mississippi (1990s) |
463,617,454,706 |
40,383,189 |
525,638 |
1.13 |
|
Neuse |
10,472,875,923 |
1,162,035 |
0 |
0 |
|
Sabine |
6,964,737,028 |
374,973 |
17,608 |
2.53 |
|
Sacramento |
30,438,835,267 |
2,152,519 |
17,430 |
0.57 |
|
Susquehanna |
27,400,261,216 |
2,788,354 |
0 |
0 |
|
Trinity |
23,581,064,748 |
4,683,013 |
73,162 |
3.10 |
|
NOTES: aSource: U.S. Bureau of the Census (1998), Table B-1; includes dry land and land temporarily or partially covered by water; bSource: U.S. Bureau of the Census (1998), Table B-1; based on areas defined as of June 30, 1996. |
||||
the sea from land-based sources was therefore 141,000 tonne yr−1 (Table I-11).
A factor of 0.00015 was applied to the total oil and grease loading to estimate the fraction of PAH in oil and grease. The estimated worldwide loading of PAH to the sea from land-based sources was therefore 1,400 tonne yr−1 (Table I-11).
Discussion
The method used to estimate land-based oil and grease, hydrocarbon, and PAH contributions to the sea involved a large degree of uncertainty due to a number of factors, including (but not limited to):
TABLE I-8 Final Estimates of Land-based Contributions of Oil and Grease to the Sea via Major Inland River Basins in North America
|
River |
No. of Observations |
Avg. Conc. Oil & Grease, Ci (mg L−1) |
Average Annual Flow, Qi (m3 yr−1) |
Urban Land Area in Watershed, Aui (m2) |
Annual Load, Lai (tonne yr−1) Unit Load per |
Urban Land Area, Lai (g m−2 yr−1)a |
|
Calculated from STORET data |
||||||
|
Delaware (1990s) |
99 |
5.80b |
10.7×10⁹ |
5.1×10⁹ |
62,130 |
12.22 |
|
Mississippi (1990s) |
46 |
0.84b |
625.8×10⁹ |
463.6×10⁹ |
525,638 |
1.13 |
|
Subtotal |
|
|
|
468.7×10⁹ |
587,768 |
|
|
Calculated using alternative method |
||||||
|
Alabama-Tombigbee |
|
|
|
19.8×10⁹ |
24,890 |
1.25 |
|
Altamaha |
|
|
|
5.5×10⁹ |
6,896 |
1.25 |
|
Apalachicola |
|
|
|
21.7×10⁹ |
27,223 |
1.25 |
|
Brazos |
|
|
|
14.4×10⁹ |
18,039 |
1.25 |
|
Colorado (TX) |
|
|
|
14.9×10⁹ |
18,670 |
1.25 |
|
Columbia |
|
|
|
30.5×10⁹ |
38,206 |
1.25 |
|
Copper |
|
|
|
0 |
0 |
0 |
|
Hudson |
|
|
|
22.0×10⁹ |
268,593 |
12.22 |
|
James |
|
|
|
7.7×10⁹ |
93,964 |
12.22 |
|
Neuse |
|
|
|
10.5×10⁹ |
13,133 |
1.25 |
|
Potomac |
|
|
|
2.0×10⁹ |
2,446 |
1.25 |
|
Rio Grande |
|
|
|
43.8×10⁹ |
54,982 |
1.25 |
|
Roanoke |
|
|
|
4.8×10⁹ |
6,057 |
1.25 |
|
Sabine |
|
|
|
7.0×10⁹ |
8,734 |
1.25 |
|
Sacramento |
|
|
|
30.4×10⁹ |
38,171 |
1.25 |
|
St. Lawrence |
|
|
|
19.7×10⁹ |
24,699 |
1.25 |
|
San Joaquin |
|
|
|
46.0×10⁹ |
57,647 |
1.25 |
|
Santee |
|
|
|
26.8×10⁹ |
33,573 |
1.25 |
|
Saskatchewan |
|
|
|
34.7×10⁹ |
43,542 |
1.25 |
|
Savannah |
|
|
|
6.3×10⁹ |
7,954 |
1.25 |
|
Susitna |
|
|
|
0 |
0 |
0 |
|
Susquehanna |
|
|
|
27.4×10⁹ |
34,361 |
1.25 |
|
Trinity |
|
|
|
23.6×10⁹ |
29,572 |
1.25 |
|
Yukon |
|
|
|
0 |
0 |
0 |
|
Subtotal |
|
|
|
419.4×10⁹ |
851,352 |
|
|
Average |
|
|
|
|
|
2.68 |
|
Total |
|
|
|
888.1×10⁹ |
1,439,352 |
|
|
NOTES: aUnit loads shown for alternate method rivers are those used to calculate annual load; bfreon-gr method used to measure oil and grease concentrations. |
||||||
TABLE I-9 Final Estimates of Land-based Contributions of Oil and Grease to the Sea by Coastal Zones in North America and Mexico
|
Coastal Zone |
Description |
Urban Population in Watershed, Pi (1997) |
Urban Land Area in Watershed, Aui (m2) |
Annual Load, Lai (tonne yr−1) |
Unit Load per Urban Land Area, Lai (g m−2 yr−1)a |
|
A |
No urban areas |
0 |
0 |
0 |
0 |
|
B |
Coastal |
0 |
0 |
0 |
0 |
|
Saskatchewan |
293.1×10³ |
34.7×10⁹ |
43,542 |
1.25 |
|
|
Subtotal |
293.1×10³ |
34.7×10⁹ |
43,542 |
|
|
|
C |
Coastal |
632.3×10³ |
6.8×10⁹ |
8,529 |
1.25 |
|
St. Lawrence |
5,647.8×103 |
19.7×10⁹ |
24,699 |
1.25 |
|
|
Subtotal |
6,280.1×103 |
26.5×10⁹ |
33,228 |
|
|
|
D |
Coastal 44, |
843.3×10³ |
121.7×10⁹ |
1,487,571 |
12.22 |
|
Delaware |
967.9×10³ |
5.1×10⁹ |
62,130 |
12.22 |
|
|
Hudson |
1,432.1×103 |
22.0×10⁹ |
268,593 |
12.22 |
|
|
James |
354.0×10³ |
7.7×10⁹ |
93,964 |
12.22 |
|
|
Potomac |
99.1×10³ |
2.0×10⁹ |
2,446 |
1.25 |
|
|
Susquehanna |
2,788.4×103 |
27.4×10⁹ |
34,361 |
1.25 |
|
|
Subtotal |
50,484.8×103 |
185.8×10⁹ |
1,949,065 |
|
|
Coastal Zone |
Description |
Urban Population in Watershed, Pi (1997) |
Urban Land Area in Watershed, Aui (m2) |
Annual Load, Lai (tonne yr−1) |
Unit Load per Urban Land Area, Lai (g m−2 yr−1)a |
|
E |
Coastal |
11,839.8×103 |
79.8×10⁹ |
100,104 |
1.25 |
|
Altamaha |
454.6×10³ |
5.5×10⁹ |
6,896 |
1.25 |
|
|
Neuse |
1,162.0×103 |
10.5×10⁹ |
13,133 |
1.25 |
|
|
Roanoke |
337.1×10³ |
4.8×10⁹ |
6,057 |
1.25 |
|
|
Santee |
3,198.3×103 |
26.8×10⁹ |
33,573 |
1.25 |
|
|
Savannah |
457.2×10³ |
6.3×10⁹ |
7,954 |
1.25 |
|
|
Subtotal |
17,449.2×103 |
133.7×10⁹ |
167,717 |
|
|
|
F |
Coastal |
5,355.1×103 |
42.3×10⁹ |
53,108 |
1.25 |
|
Alabama-Tombigbee |
1,601.4×103 |
19.8×10⁹ |
24,890 |
1.25 |
|
|
Apalachicola |
4,016.9×103 |
21.7×10⁹ |
27,223 |
1.25 |
|
|
Subtotal |
10,973.3×103 |
83.9×10⁹ |
105,222 |
|
|
|
G |
Coastal |
10,127.3×103 |
75.3×10⁹ |
94,398 |
1.25 |
|
Gulf coast refineriesb |
— |
— |
2,882 |
— |
|
|
Brazos |
987.8×10³ |
14.4×10⁹ |
18,039 |
1.25 |
|
|
Colorado (TX) |
1,173.7×103 |
14.9×10⁹ |
18,670 |
1.25 |
|
|
Mississippi |
40,383.2×103 |
463.6×10⁹ |
525,638 |
1.13 |
|
|
Rio Grande |
1,410.0×103 |
43.8×10⁹ |
54,982 |
1.25 |
|
|
Sabine |
375.0×10³ |
7.0×10⁹ |
8,734 |
1.25 |
|
|
Trinity |
4,683.0×103 |
23.6×10⁹ |
29,572 |
1.25 |
|
|
Subtotal |
59,139.9×103 |
642.6×10⁹ |
752,913 |
|
|
|
Hc |
Coastal and inland rivers |
30,159.2×103 |
|
108,189 |
|
|
I |
No urban areas |
0 |
0 |
0 |
0 |
|
Jc |
Coastal and inland rivers |
16,060.2×103 |
57,612 |
|
|
|
K |
Coastal |
18,331.5×103 |
98.9×10⁹ |
123,976 |
1.25 |
|
L |
Coastal |
7,686.2×103 |
43.3×10⁹ |
54,349 |
1.25 |
|
Sacramento |
2,152.5×103 |
30.4×10⁹ |
38,171 |
1.25 |
|
|
San Joaquin |
2,382.3×103 |
46.0×10⁹ |
57,647 |
1.25 |
|
|
Subtotal |
12,221.1×103 |
119.7×10⁹ |
150,168 |
|
|
|
M |
Coastal |
5,946.3×103 |
54.0×10⁹ |
67,725 |
1.25 |
|
Columbia |
1,263.5×103 |
30.5×10⁹ |
38,206 |
1.25 |
|
|
Subtotal |
7,209.7×103 |
84.5×10⁹ |
105,931 |
|
|
|
N |
Coastal |
2,136.0×103 |
3.5×10⁹ |
4,332 |
1.25 |
|
O |
Coastal |
869.9×10³ |
1.6×10⁹ |
1,949 |
1.25 |
|
P |
Coastal |
251.0×10³ |
4.4×10⁹ |
5,514 |
1.25 |
|
Copper |
0 |
0 |
0 |
0 |
|
|
Susitna |
0 |
0 |
0 |
0 |
|
|
Subtotal |
251.0×10³ |
4.4×10⁹ |
5,514 |
|
|
|
Q |
Coastal |
0 |
0 |
0 |
0 |
|
Yukon |
0 |
0 |
0 |
0 |
|
|
Totalc |
188,277.0×103 |
1,419.7×109 |
3,443,557 |
|
|
|
NOTES: aUnit loads shown are those used to calculate corresponding annual load; bSee Table I-4 for calculation of refinery loading; cTotal does not include Coastal Zones in Mexico. |
|||||
TABLE I-10 World Estimates of Land-based Sources of Oil and Grease to the Sea
|
Region |
Population (WRI 1998) |
Motor Vehicles Per Capita (WRI 1998) |
Number of Vehicles |
Loading per Vehicle (tonne veh−1) |
Loading (tonne yr−1) |
|
Africa |
778,484,000 |
0.02 |
15,569,680 |
0.01573 |
244,889 |
|
Europe |
729,406,000 |
0.27 |
196,939,620 |
0.01573 |
3,097,582 |
|
North America |
304,078,000 |
0.72 |
218,936,160 |
0.01573 |
3,443,557 |
|
Central America |
130,710,000 |
0.11 |
14,378,100 |
0.01573 |
226,147 |
|
South America |
331,889,000 |
0.09 |
29,870,010 |
0.01573 |
469,813 |
|
Asia |
3,588,877,000 |
0.03 |
107,666,310 |
0.01573 |
1,693,439 |
|
Oceania |
29,460,000 |
0.43 |
12,667,800 |
0.01573 |
199,247 |
|
Total |
|
|
|
|
9,374,674 |
TABLE I-11 Final Estimates of Worldwide Land-based Contributions of Hydrocarbons and Polycyclic Aromatic Hydrocarbons (PAH) to the Sea
|
World Region |
Coastal Zone |
Description |
Hydrocarbons (tonne yr−1) |
PAH (tonne yr−1) |
|
North Americaa |
A |
No urban areas |
0 |
0 |
|
B |
Coastal |
0 |
0 |
|
|
Saskatchewan |
653 |
7 |
||
|
Subtotal |
653 |
7 |
||
|
C |
Coastal |
128 |
1 |
|
|
St. Lawrence |
370 |
4 |
||
|
Subtotal |
498 |
5 |
||
|
D |
Coastal |
22,314 |
223 |
|
|
Delaware |
932 |
9 |
||
|
Hudson |
4,029 |
40 |
||
|
James |
1,409 |
14 |
||
|
Potomac |
37 |
0 |
||
|
Susquehanna |
515 |
5 |
||
|
Subtotal |
29,236 |
292 |
||
|
E |
Coastal |
1,502 |
15 |
|
|
Altamaha |
103 |
1 |
||
|
Neuse |
197 |
2 |
||
|
Roanoke |
91 |
1 |
||
|
Santee |
504 |
5 |
||
|
Savannah |
119 |
1 |
||
|
Subtotal |
2,516 |
25 |
||
|
F |
Coastal |
797 |
8 |
|
|
Alabama-Tombigbee |
373 |
4 |
||
|
Apalachicola |
408 |
4 |
||
|
Subtotal |
1,578 |
16 |
||
|
G |
Coastal |
1,416 |
14 |
|
|
Gulf coast refineriesb |
43 |
0 |
||
|
Brazos |
271 |
3 |
||
|
Colorado (TX) |
280 |
3 |
||
|
Mississippi |
7,885 |
79 |
||
|
Rio Grande |
825 |
8 |
||
|
Sabine |
131 |
1 |
||
|
Trinity |
444 |
4 |
||
|
Subtotal |
11,294 |
113 |
||
|
Ha |
Coastal and inland rivers |
1,623 |
16 |
|
|
Ia |
No urban areas |
0 |
0 |
|
|
J |
Coastal and inland rivers |
864 |
9 |
|
|
K |
Coastal |
1,860 |
19 |
|
|
L |
Coastal |
815 |
8 |
|
|
Sacramento |
573 |
6 |
||
|
San Joaquin |
865 |
9 |
||
|
Subtotal |
2,253 |
23 |
||
|
M |
Coastal |
1,016 |
10 |
|
|
Columbia |
573 |
6 |
||
|
Subtotal |
1,589 |
16 |
||
|
N |
Coastal |
65 |
1 |
|
|
O |
Coastal |
29 |
0 |
|
|
P |
Coastal |
83 |
1 |
|
|
Copper |
0 |
0 |
||
|
Susitna |
0 |
0 |
||
|
Subtotal |
83 |
1 |
||
|
Q |
Coastal |
0 |
0 |
|
|
Yukon |
0 |
0 |
||
|
Subtotala |
51,653 |
517 |
||
|
Africa |
|
|
3,673 |
37 |
|
Europe |
|
|
46,464 |
465 |
|
Central America |
|
|
3,392 |
34 |
|
South America |
|
|
7,047 |
70 |
|
Asia |
|
|
25,402 |
254 |
|
Oceania |
|
|
2,989 |
30 |
|
TOTAL |
|
|
140,620 |
1,406 |
|
NOTES: aSubtotal for North America does not include Coastal Zones in Mexico; bSee Table I-4 for calculation of refinery loading. |
||||
-
Lack of data; only nine major rivers in the United States had oil and grease data in the U.S. Environmental Protection Agency’s STORET data base, and several of these consisted of very few observations.
-
Differences in measuring and reporting data; most of the available oil and grease data in STORET was gathered using either the Soxhlet extraction method or the liquid-liquid extraction method. The minimum detection limit (denoted off-scale low in the STORET records) and approach for reporting values measured below the detection limit varied with location and time. For example, the minimum detection limit on the Delaware River was 2 mg L−1 for data reported from 1988-1994, and 5 mg L−1 for data reported after 1994. By comparison, the minimum detection limit on the Mississippi River was 1 mg L−1 for the entire period of record (1973-1996).
-
Adjustment of off-scale low measurements; these values were set to half their reported value even though the actual value was unknown.
-
Estimating the proportion of petroleum-related hydrocarbons and PAH in oil and grease measurements
Quantifying the uncertainty in the estimates presented in this analysis was not possible, but a reasonable estimate of the low and high ranges of the calculated oil and grease values was made by assuming that the data available from the 1990s for the Mississippi and Delaware rivers, respectively, represented the low and high bounds of oil and grease unit loading for the rivers for which STORET data were unavailable in the 1990s, and for coastal zones in North America and the world (Table I-12). Based on these assumptions, the range of worldwide loadings of land-based sources of oil and grease to the sea was 4.5 million−33.3 million tonne yr−1, with a best estimate of 9.4 million tonne yr−1. The values shown in Table I-12 also reflect low, best, and high estimates of oil and grease loadings from Gulf coast refineries. Calculations of oil and grease discharges using daily maximum guidelines (6.0 lbs per 1000 barrels of crude produced) were used as a high estimate of these loadings, while calculations using the monthly average guidelines (3.2 lbs per 1000 barrels of crude produced) were used as a low estimate. The average of the two calculations was used as a best estimate of the loadings.
Estimates of total petroleum hydrocarbons in the Mississippi River were based on the December 2000 average PAH data of Michel (2001), the assumption that PAH constitute 0.1%−10% of total petroleum hydrocarbons, and the 1990s’ measured average oil and grease concentration of 0.84 mg L−1. Thus, using the lower bound of PAH fraction in total hydrocarbons, a lower bound for estimated hydrocarbons in oil and grease was 0.15%, while an upper bound of hydrocarbons as 15% of oil and grease was determined assuming PAH constitute 10% of total petroleum hydrocarbons. The final range of estimates of total hydrocarbons were therefore made by assuming that the low estimate corresponded with the low percentage of total hydrocarbons (i.e., 0.15%) in the low estimate of oil and grease loading, the best estimate corresponded with 1.5% of total hydrocarbons in the best estimate of oil and grease loading, and the high estimate corresponded with the high percentage of total hydrocarbons (i.e., 15%) in the high estimate of oil and grease loading (Table I-13). Thus, the range of land-based petroleum hydrocarbon loading to the sea was 6,800−5,000,000 tonne yr−1, with a best estimate of 141,000 tonne yr−1.
The application of the PAH data of Michel (2001) on the Mississippi River involved uncertainties regarding the degree to which that data were representative of distributions of PAH in land-based discharges to the sea via rivers and coastal discharges. Part of this uncertainty arises from the lack of consistent PAH measurements in the water column. A review of STORET and the USGS’ National Water Information Service (NWIS) data revealed less than a dozen measurements of PAH above detection limits on rivers in the United States. Furthermore, reported water column PAH concentrations in the literature were not consistent with respect to the constituents reported, did not use the same measurement methods, and/or did not include particulate and dissolved concentrations of PAH. Nonetheless, literature-reported data and data provided by Baker (2001) on the Susquehanna River indicated that the Michel (2001) data were within a reasonable range for river total PAH concentrations. Thus, the range of the background measurements of total PAH on the Mississippi River by Michel (2001) (i.e., 100 to 156 ng L−1, with an average of 128.3 ng L−1) were compared with the average oil and grease concentration for the Mississippi River of 0.84 mg L−1 to determine the estimated range of PAH in oil and grease as 0.012% to 0.019%, with a best estimate of 0.015%. The low estimate of PAH loading to the sea from land-based sources was therefore estimated as 0.012% of the low estimate of oil and grease loading, and the high PAH loading estimate was calculated as 0.019% of the high estimate of oil and grease loading. The best estimate of PAH loading from land-based sources was calculated using 0.015% of the best estimate of oil and grease loading (Table I-13). The range of PAH loading to the sea from land-based sources was 500−6,300 tonne yr−1, with a best estimate of 1,400 tonne yr−1.
Comparison of Estimates of Land-Based Loading with Other Estimates
The average oil and grease loading of 2.68 g m−2 yr−1 estimated in this study (see Table I-8) was comparable to oil and grease loadings estimated for urban areas in other studies (Table I-14). The range of estimates presented in the current analysis (1.13−12.22 g m−2 yr−1) encompassed the estimates of the previous studies. Perry and McIntyre’s (1986) estimate was actually an event-based calculation that should be higher than an annual load. In addition, the estimates by
TABLE I-12 Ranges of Worldwide Land-based Contributions of Oil and Grease to the Sea
|
|
|
|
Unit Load Based on Urban Area (g m−2 yr−1) |
Annual Load (tonne yr−1) |
||||
|
World Region |
Coastal Zone |
Description |
Low |
Best Est. |
High |
Low |
Best Est. |
High |
|
North Americaa |
A |
No urban areas |
0 |
0 |
0 |
0 |
0 |
0 |
|
B |
Coastal |
0 |
0 |
0 |
0 |
0 |
0 |
|
|
Saskatchewan |
1.13 |
1.25 |
12.22 |
39,367 |
43,542 |
424,440 |
||
|
Subtotal |
|
|
|
39,367 |
43,542 |
424,440 |
||
|
C |
Coastal |
1.13 |
1.25 |
12.22 |
7,711 |
8,529 |
82,137 |
|
|
St. Lawrence |
1.13 |
1.25 |
12.22 |
22,330 |
24,699 |
240,759 |
||
|
Subtotal |
|
|
|
30,041 |
33,228 |
323,896 |
||
|
D |
Coastal |
1.13 |
12.22 |
12.22 |
137,971 |
1,487,571 |
1,487,571 |
|
|
Delaware |
12.22 |
12.22 |
12.22 |
62,130 |
62,130 |
62,130 |
||
|
Hudson |
1.13 |
12.22 |
12.22 |
24,912 |
268,593 |
268,593 |
||
|
James |
1.13 |
12.22 |
12.22 |
8,715 |
93,964 |
93,964 |
||
|
Potomac |
1.13 |
1.25 |
12.22 |
2,211 |
2,446 |
23,843 |
||
|
Susquehanna |
1.13 |
1.25 |
12.22 |
31,066 |
34,361 |
334,943 |
||
|
Subtotal |
|
|
|
267,005 |
1,949,065 |
2,271,044 |
||
|
E |
Coastal |
1.13 |
1.25 |
12.22 |
90,504 |
100,104 |
975,790 |
|
|
Altamaha |
1.13 |
1.25 |
12.22 |
6,234 |
6,896 |
67,218 |
||
|
Neuse |
1.13 |
1.25 |
12.22 |
11,874 |
13,133 |
128,021 |
||
|
Roanoke |
1.13 |
1.25 |
12.22 |
5,476 |
6,057 |
59,043 |
||
|
Santee |
1.13 |
1.25 |
12.22 |
30,353 |
33,573 |
327,262 |
||
|
Savannah |
1.13 |
1.25 |
12.22 |
7,191 |
7,954 |
77,533 |
||
|
Subtotal |
|
|
|
151,633 |
167,717 |
1,634,867 |
||
|
F |
Coastal |
1.13 |
1.25 |
12.22 |
48,015 |
53,108 |
517,689 |
|
|
Alabama-Tombigbee |
1.13 |
1.25 |
12.22 |
22,503 |
24,890 |
242,625 |
||
|
Apalachicola |
1.13 |
1.25 |
12.22 |
24,613 |
27,223 |
265,366 |
||
|
Subtotal |
|
|
|
95,131 |
105,222 |
1,025,680 |
||
|
G |
Coastal |
1.13 |
1.25 |
12.22 |
85,345 |
94,398 |
920,166 |
|
|
Gulf coast refineries |
— |
— |
— |
2,005 |
2,882 |
3,759 |
||
|
Brazos |
1.13 |
1.25 |
12.22 |
16,309 |
18,039 |
175,838 |
||
|
Colorado (TX) |
1.13 |
1.25 |
12.22 |
16,879 |
18,670 |
181,989 |
||
|
Mississippi |
1.13 |
1.13 |
1.13 |
525,638 |
525,638 |
525,638 |
||
|
Rio Grande |
1.13 |
1.25 |
12.22 |
49,709 |
54,982 |
535,947 |
||
|
Sabine |
1.13 |
1.25 |
12.22 |
7,896 |
8,734 |
85,137 |
||
|
Trinity |
1.13 |
1.25 |
12.22 |
26,736 |
29,572 |
288,257 |
||
|
Subtotal |
|
|
|
730,517 |
752,913 |
2,716,731 |
||
|
Ha |
Coastal and inland rivers |
|
|
|
52,405 |
108,189 |
383,817 |
|
|
I |
No urban areas |
0 |
0 |
0 |
0 |
0 |
0 |
|
|
Ja |
Coastal and inland rivers |
|
|
|
27,906 |
57,612 |
204,387 |
|
|
K |
Coastal |
1.13 |
1.25 |
12.22 |
112,086 |
123,976 |
1,208,486 |
|
|
L |
Coastal |
1.13 |
1.25 |
12.22 |
49,137 |
54,349 |
529,786 |
|
|
Sacramento |
1.13 |
1.25 |
12.22 |
34,511 |
38,171 |
372,087 |
||
|
San Joaquin |
1.13 |
1.25 |
12.22 |
52,118 |
57,647 |
561,928 |
||
|
Subtotal |
|
|
|
135,767 |
150,168 |
1,463,800 |
||
|
M |
Coastal |
1.13 |
1.25 |
12.22 |
61,230 |
67,725 |
660,166 |
|
|
Columbia |
1.13 |
1.25 |
12.22 |
34,542 |
38,206 |
372,425 |
||
|
Subtotal |
|
|
|
95,772 |
105,931 |
1,032,591 |
||
|
N |
Coastal |
1.13 |
1.25 |
12.22 |
3,916 |
4,332 |
42,223 |
|
|
O |
Coastal |
1.13 |
1.25 |
12.22 |
1,762 |
1,949 |
19,002 |
|
|
P |
Coastal |
1.13 |
1.25 |
12.22 |
4,985 |
5,514 |
53,746 |
|
|
Copper |
0 |
0 |
0 |
0 |
0 |
0 |
||
|
Susitna |
0 |
0 |
0 |
0 |
0 |
0 |
||
|
Subtotal |
|
|
|
4,985 |
5,514 |
53,746 |
||
|
Q |
Coastal |
0 |
0 |
0 |
0 |
0 |
0 |
|
|
Yukon |
0 |
0 |
0 |
0 |
0 |
0 |
||
|
Subtotala |
|
|
|
1,667,983 |
3,443,557 |
12,216,509 |
||
|
Africa |
|
|
|
|
|
118,619 |
244,889 |
868,779 |
|
Europe |
|
|
|
|
|
1,500,400 |
3,097,582 |
10,989,115 |
|
Central America |
|
|
|
|
|
109,541 |
226,147 |
802,290 |
|
South America |
|
|
|
|
|
227,567 |
469,813 |
1,666,729 |
|
Asia |
|
|
|
|
|
820,264 |
1,693,439 |
6,007,717 |
|
Oceania |
|
|
|
|
|
96,511 |
199,247 |
706,856 |
|
TOTAL |
|
|
|
|
|
4,540,885 |
9,374,674 |
33,257,994 |
|
NOTES: aSubtotal for North America does not include Coastal Zones in Mexico. |
||||||||
TABLE I-13 Ranges of Worldwide Land-based Contributions of Hydrocarbons and Polycyclic Aromatic Hydrocarbons (PAH) to the Sea
|
|
|
|
Hydrocarbons (tonne yr−1) |
PAH (tonne yr−1) |
||||
|
World Region |
Coastal Zone |
Description |
Low |
Best Est. |
High |
Low |
Best Est. |
High |
|
North Americaa |
A |
No urban areas |
0 |
0 |
0 |
0 |
0 |
0 |
|
B |
Coastal |
0 |
0 |
0 |
0 |
0 |
0 |
|
|
Saskatchewan |
59 |
653 |
63,666 |
5 |
7 |
81 |
||
|
Subtotal |
59 |
653 |
63,666 |
5 |
7 |
81 |
||
|
C |
Coastal |
12 |
128 |
12,471 |
1 |
1 |
16 |
|
|
St. Lawrence |
33 |
370 |
36,114 |
3 |
4 |
46 |
||
|
Subtotal |
45 |
498 |
48,584 |
4 |
5 |
62 |
||
|
D |
Coastal |
207 |
22,314 |
223,136 |
17 |
223 |
283 |
|
|
Delaware |
93 |
932 |
9,320 |
7 |
9 |
12 |
||
|
Hudson |
37 |
4,029 |
40,289 |
3 |
40 |
51 |
||
|
James |
13 |
1,409 |
14,095 |
1 |
14 |
18 |
||
|
Potomac |
3 |
37 |
3,576 |
0 |
0 |
5 |
||
|
Susquehanna |
47 |
515 |
50,241 |
4 |
5 |
64 |
||
|
Subtotal |
401 |
29,236 |
340,657 |
32 |
292 |
431 |
||
|
E |
Coastal |
136 |
1,502 |
149,368 |
11 |
15 |
185 |
|
|
Altamaha |
9 |
103 |
10,083 |
1 |
1 |
13 |
||
|
Neuse |
18 |
197 |
19,203 |
1 |
2 |
24 |
||
|
Roanoke |
8 |
91 |
8,856 |
1 |
1 |
11 |
||
|
Santee |
46 |
504 |
49,089 |
4 |
5 |
62 |
||
|
Savannah |
11 |
119 |
11,630 |
1 |
1 |
15 |
||
|
Subtotal |
227 |
2,516 |
245,230 |
18 |
25 |
311 |
||
|
F |
Coastal |
72 |
797 |
77,653 |
6 |
8 |
98 |
|
|
Alabama-Tombigbee |
34 |
373 |
36,394 |
3 |
4 |
46 |
||
|
Apalachicola |
37 |
408 |
39,805 |
3 |
4 |
50 |
||
|
Subtotal |
143 |
1,578 |
153,852 |
11 |
16 |
195 |
||
|
G |
Coastal |
128 |
1,416 |
138,025 |
10 |
14 |
175 |
|
|
Gulf coast refineries |
3 |
43 |
564 |
0 |
0 |
1 |
||
|
Brazos |
24 |
271 |
26,376 |
2 |
3 |
33 |
||
|
Colorado (TX) |
25 |
280 |
27,298 |
2 |
3 |
35 |
||
|
Mississippi |
788 |
7,885 |
78,846 |
63 |
79 |
100 |
||
|
Rio Grande |
75 |
825 |
80,392 |
6 |
8 |
102 |
||
|
Sabine |
12 |
131 |
12,771 |
1 |
1 |
16 |
||
|
Trinity |
40 |
444 |
43,239 |
3 |
4 |
55 |
||
|
Subtotal |
1,096 |
11,294 |
407,510 |
88 |
113 |
516 |
||
|
Ha |
Coastal and inland rivers |
79 |
1,623 |
57,573 |
6 |
16 |
73 |
|
|
I |
No urban areas |
0 |
0 |
0 |
0 |
0 |
0 |
|
|
Ja |
Coastal and inland rivers |
42 |
864 |
30,658 |
3 |
9 |
39 |
|
|
K |
Coastal |
168 |
1,860 |
181,273 |
13 |
19 |
230 |
|
|
L |
Coastal |
74 |
815 |
79,468 |
6 |
8 |
101 |
|
|
Sacramento |
52 |
573 |
55,813 |
4 |
6 |
71 |
||
|
San Joaquin |
78 |
865 |
84,289 |
6 |
9 |
107 |
||
|
Subtotal |
204 |
2,253 |
219,570 |
16 |
23 |
278 |
||
|
M |
Coastal |
92 |
1,016 |
99,025 |
7 |
10 |
125 |
|
|
Columbia |
52 |
573 |
55,864 |
4 |
6 |
71 |
||
|
Subtotal |
144 |
1,589 |
159,889 |
11 |
16 |
196 |
||
|
N |
Coastal |
6 |
65 |
6,333 |
0 |
1 |
8 |
|
|
O |
Coastal |
3 |
29 |
2,850 |
0 |
0 |
4 |
|
|
P |
Coastal |
7 |
83 |
8,062 |
1 |
1 |
10 |
|
|
Copper |
0 |
0 |
0 |
0 |
0 |
0 |
||
|
Susitna |
0 |
0 |
0 |
0 |
0 |
0 |
||
|
Subtotal |
7 |
83 |
8,062 |
1 |
1 |
10 |
||
|
Q |
Coastal |
0 |
0 |
0 |
0 |
0 |
0 |
|
|
Yukon |
0 |
0 |
0 |
0 |
0 |
0 |
||
|
Subtotala |
2,502 |
51,653 |
1,832,476 |
200 |
517 |
2,321 |
||
|
Africa |
|
|
178 |
3,673 |
130,317 |
14 |
37 |
165 |
|
Europe |
|
|
2,251 |
46,464 |
1,648,387 |
180 |
465 |
2,088 |
|
Central America |
|
|
164 |
3,392 |
120,343 |
13 |
34 |
152 |
|
South America |
|
|
341 |
7,047 |
250,009 |
27 |
70 |
317 |
|
Asia |
|
|
1,230 |
25,402 |
901,158 |
98 |
254 |
1,141 |
|
Oceania |
|
|
145 |
2,989 |
106,028 |
12 |
30 |
134 |
|
TOTAL |
|
|
6,811 |
140,620 |
4,988,699 |
545 |
1,406 |
6,319 |
|
NOTES: aSubtotal for North America does not include Coastal Zones in Mexico. |
||||||||
TABLE I-14 Comparison of Estimated Loading of Oil and Grease in Urban Areas
|
Location |
Unit Load per Urban Land Area (g m−2 yr−1) |
Reference |
Comments |
|
United States and Canada |
2.68 |
This work |
|
|
Los Angeles River, Calif. |
1.28 |
Eganhouse and Kaplan (1981) |
Total hydrocarbons |
|
Narragansett Bay, R. I. |
2.13 |
Hoffman et al. (1983) |
Petroleum hydrocarbons |
|
United Kingdom (roadway runoff) |
11.016 |
Perry and McIntyre (1986) |
Calculated from oil mass loading of 0.17 kg ha−1 mm of runoff−1 and annual average rainfall of 648 mm |
|
Richmond, Calif. |
1.25 |
Stenstrom et al. (1984) |
|
Hoffman et al. (1983) and Eganhouse and Kaplan (1981) were actually for hydrocarbons, which constitute part, but not all, of oil and grease. Thus, the lower loadings calculated in those studies agree nicely with the loading estimate from the current study.
The estimate of total oil and grease loading was also compared with estimates of dissolved organic carbon (DOC) inputs to the sea from land-based sources (Table I-15). Since oil and grease constitutes a small part of DOC, the current estimates of oil and grease loading should be considerably lower than estimates of DOC flux. This was confirmed for published estimates of global contributions of DOC from rivers to oceans, although the current estimates of oil and grease loading were higher on the Delaware River than corresponding published estimates of DOC flux by Leenheer (1982).
The current study’s best estimates of oil and grease loadings to coastal zone G were on the order of 800,000 tonne yr−1, which was much greater than the 27,000 tonne yr−1 estimated by the Caribbean Environment Programme (1994) for the Gulf coast of the United States. It is likely that the Caribbean Environment Programme (1994) data included neither the Mississippi River, which accounted for over 500,000 tonne yr−1 of the oil and grease loading in the current study, nor the contributions from Gulf coast refineries. Thus, the corresponding current best estimate was about 10 times greater than the Caribbean Environment Programme (1994) estimate of loading of oil and grease to the Gulf coast.
The calculations of oil and grease loadings presented in this analysis were based on unit loadings per urban land area. Comparison calculations were also made based on unit loadings per capita urban population using 1997 urban populations in the United States obtained from U.S. Bureau of the Census (1998) and 1996 urban populations in Canada from Statistics Canada (2000). These calculations resulted in oil and grease loadings of the same magnitude as calculations based on unit loadings per urban land area (Table I-16).
To test the assumption that the measured oil and grease concentrations used for the current analysis were representative of ambient concentrations in North American rivers, average measured oil and grease concentrations for the 1990s STORET data on the Mississippi and Delaware rivers were compared with a database consisting of all of the 1990s oil and grease measurements gathered from STORET (145 data points) and 704 additional data points from USGS sampling stations on rivers in Louisiana in the 1990s (Table I-17 and Figure I-1). For the Mississippi River and Louisiana sampling, the minimum detection limit was 1 mg L−1, while the minimum detection limit on the Delaware River was either 2 mg L−1 or 5 mg L−1. Measurements reported to be less than the minimum detection limit were assumed to be half of their reported value (i.e., if a measurement was reported as <1 mg L−1, 0.5 mg L−1 was entered in the database).
The comparisons shown in Table I-17 and Figure I-1 indicate that the oil and grease concentrations used for the Mississippi River in this analysis corresponded nicely with the separate measurements in Louisiana by the USGS and hence the overall database. This result was not surprising since a large portion of the Louisiana data were also measured on the Mississippi River. The Delaware River concentrations were higher than the other 1990s data collected, but the high industrialization of that river could account for higher oil and grease discharges. Thus, the oil and grease concentrations obtained from the STORET database were reasonable.
As a further test of the reasonableness of the estimates of land-based loadings of oil and grease presented here, these loads were compared to oil consumption. According to a recent BP Amoco report (BP Amoco, 2000), North America consumed 1047.1 million tonnes of oil in 1999. Assuming that all of the 3.4 million tonne yr−1 of oil and grease estimated in this study as returning to the sea from land-based sources were petroleum-derived, then only about 0.3 percent of consumed oil was returned to the sea from land-based sources. Furthermore, BP Amoco (2000) estimated that the North American annual consumption of oil was broken down as follows:
|
Gasoline |
428.8 million tonne yr−1 |
|
Middle Distillates |
319.6 |
|
Fuel Oil |
77.3 |
|
Other |
221.4 |
|
Total |
1047.1 million tonne yr−1 |
Again, assuming that (1) all gasoline products were completely consumed by use (although PAH in urban runoff are
TABLE I-15 Comparison of Published Estimates of Dissolved Organic Carbon (DOC) Inputs from Land-based Sources to Oil and Grease Loadings Estimated in this Study
|
Reference |
Description |
Estimated DOC Flux (tonne C yr−1) |
Estimated Oil and Grease Loading (tonne yr−1) |
Percent of DOC Flux |
|
Degens and Ittekkot (1983) |
DOC transported by rivers into ocean |
285,000,000 |
9,374,674 |
3.29 |
|
Degens et al. (1991) |
DOC flux from Africa |
24,700,000 |
244,889 |
0.10 |
|
Degens et al. (1991) |
DOC flux from Asia |
94,000,000 |
1,693,439 |
1.80 |
|
Degens et al. (1991) |
DOC flux from North America |
33,800,000 |
3,443,557 |
10.19 |
|
Degens et al. (1991) |
DOC flux from South America |
44,200,000 |
469,813 |
1.06 |
|
Kobak (1988)a |
Inflow of organic matter with river runoff |
210,000,000 |
9,374,674 |
4.46 |
|
Leenheer (1982) |
DOC flux from Alabama-Tombigbee |
537,000 |
24,890 |
4.64 |
|
Leenheer (1982) |
DOC flux from Apalachicola |
136,000 |
27,223 |
20.02 |
|
Leenheer (1982) |
DOC flux from Columbia |
1,346,000 |
38,206 |
2.84 |
|
Leenheer (1982) |
DOC flux from Delaware |
50,000 |
62,130 |
124.26 |
|
Leenheer (1982) |
DOC flux from Mississippi |
3,477,000 |
525,638 |
15.12 |
|
Leenheer (1982) |
DOC flux from Potomac |
1,070,000 |
2,446 |
0.23 |
|
Leenheer (1982) |
DOC flux from Sacramento |
77,000 |
38,171 |
49.57 |
|
Leenheer (1982) |
DOC flux from Susitna |
231,000 |
0 |
0.00 |
|
Leenheer (1982) |
DOC flux from Susquehanna |
225,000 |
34,361 |
15.27 |
|
Leenheer (1982) |
DOC flux from Yukon |
2,411,000 |
0 |
0.00 |
|
Leenheer (1982)b |
DOC flux from United States |
10,156,000 |
3,443,557 |
33.91 |
|
Meybeck (1988)c |
DOC export as estimated by morphoclimatic zones |
234,200,000 |
9,374,674 |
4.00 |
|
Pocklington and Tan (1983) |
DOC flux from St. Lawrence |
1,710,000 |
24,699 |
1.44 |
|
Schlesinger (1997) |
Riverine flux of dissolved organic carbon |
400,000,000 |
9,374,674 |
2.34 |
|
Siegenthaler and Sarmiento (1993)d |
River inputs |
800,000,000 |
9,374,674 |
1.17 |
|
Spitzy and Ittekkot (1991) |
Global riverine DOC flux |
218,000,000 |
9,374,674 |
4.30 |
|
NOTES: aAs cited in Kagan (1995); bLeenheer (1982) calculation is for US only; calculations in this work are for North America; cAs cited in Spitzy and Ittekkot (1991); dAs cited in McCarthy (2000). |
||||
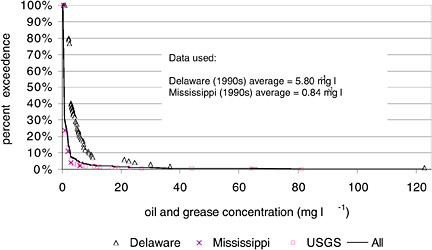
FIGURE I-1 Plot of percent exceedence values for 1990s STORET data (Delaware and Mississippi Rivers), 1990s USGS Louisiana data, and all data combined.
TABLE I-16 Comparison of Estimates of Worldwide Land-based Contributions of Oil and Grease to the Sea Based on Unit Loads per Urban Land Area and Unit Loads per Capita Urban Population
|
World Region |
Coastal Zone |
Description |
Annual Load Based on Pop. (tonne yr−1) |
Annual Load Based on Area (tonne yr−1) |
|
North Americaa |
A |
No urban areas |
0 |
0 |
|
B |
Coastal |
0 |
0 |
|
|
Saskatchewan |
41,655 |
43,542 |
||
|
Subtotal |
41,655 |
43,542 |
||
|
C |
Coastal |
8,987 |
8,529 |
|
|
St. Lawrence |
80,278 |
24,699 |
||
|
Subtotal |
89,265 |
33,228 |
||
|
D |
Coastal |
2,878,535 |
1,487,571 |
|
|
Delaware |
62,130 |
62,130 |
||
|
Hudson |
91,929 |
268,593 |
||
|
James |
22,726 |
93,964 |
||
|
Potomac |
1,409 |
2,446 |
||
|
Susquehanna |
39,634 |
34,361 |
||
|
Subtotal |
3,096,364 |
1,949,065 |
||
|
E |
Coastal |
168,292 |
100,104 |
|
|
Altamaha |
6,462 |
6,896 |
||
|
Neuse |
16,517 |
13,133 |
||
|
Roanoke |
4,792 |
6,057 |
||
|
Santee |
45,462 |
33,573 |
||
|
Savannah |
6,499 |
7,954 |
||
|
Subtotal |
248,024 |
167,717 |
||
|
F |
Coastal |
76,118 |
53,108 |
|
|
Alabama-Tombigbee |
22,762 |
24,890 |
||
|
Apalachicola |
57,096 |
27,223 |
||
|
Subtotal |
155,976 |
105,222 |
||
|
G |
Coastal |
143,951 |
94,398 |
|
|
Gulf coast refineriesb |
2,882 |
2,882 |
||
|
razos |
14,040 |
18,039 |
||
|
Colorado (TX) |
16,683 |
18,670 |
||
|
Mississippi |
525,638 |
525,638 |
||
|
Rio Grande |
20,042 |
54,982 |
||
|
Sabine |
5,330 |
8,734 |
||
|
Trinity |
66,565 |
29,572 |
||
|
Subtotal |
795,130 |
752,913 |
||
|
Ha |
Coastal and inland rivers |
157,387 |
108,189 |
|
|
I |
No urban areas |
0 |
0 |
|
|
Ja |
Coastal and inland rivers |
83,810 |
57,612 |
|
|
K |
Coastal |
260,566 |
123,976 |
|
|
L |
Coastal |
109,253 |
54,349 |
|
|
Sacramento |
30,596 |
38,171 |
||
|
San Joaquin |
33,863 |
57,647 |
||
|
Subtotal |
173,711 |
150,168 |
||
|
M |
Coastal |
84,521 |
67,725 |
|
|
Columbia |
17,959 |
38,206 |
||
|
Subtotal |
102,480 |
105,931 |
||
|
N |
Coastal |
30,361 |
4,332 |
|
|
O |
Coastal |
12,364 |
1,949 |
|
|
P |
Coastal |
3,568 |
5,514 |
|
|
Copper |
0 |
0 |
||
|
Susitna |
0 |
0 |
||
|
Subtotal |
3,568 |
5,514 |
||
|
Q |
Coastal |
0 |
0 |
|
|
Yukon |
0 |
0 |
||
|
Subtotala |
5,009,464 |
3,443,557 |
||
|
Africa |
|
|
356,249 |
244,889 |
|
Europe |
|
|
4,506,162 |
3,097,582 |
|
Central America |
|
|
328,984 |
226,147 |
|
South America |
|
|
683,454 |
469,813 |
|
Asia |
|
|
2,463,506 |
1,693,439 |
|
Oceania |
|
|
289,851 |
199,247 |
|
TOTAL |
|
|
13,637,670 |
9,374,694 |
|
NOTES: aSubtotal for North America does not include Coastal Zones in Mexico; bSee Table F-4 for calculation of refinery loading. |
||||
TABLE I-17 Comparison of STORET Oil and Grease Data Used in this Study with 1990s USGS Oil and Grease Data for Louisiana
|
Description |
Delaware River |
Mississippi River |
USGS Data |
All Data |
|
Statistics |
||||
|
Number of observations |
99 |
46 |
704 |
849 |
|
Minimum concentration (mg L−1) |
1.0 |
0.5 |
0.5 |
0.5 |
|
Maximum concentration (mg L−1) |
122.7 |
6 |
81 |
122.7 |
|
Average concentration (mg L−1) |
5.80 |
0.84 |
1.27 |
1.77 |
|
Standard deviation (mg L−1) |
13.21 |
0.94 |
4.65 |
6.35 |
|
Percent exceedence |
||||
|
Mississippi 1990s average = 0.84 mg L−1 |
100 percent |
24.6 percent |
21.1 percent |
30.4 percent |
|
Delaware 1990s average = 5.80 mg L−1 |
21.2 percent |
2.3 percent |
2.6 percent |
4.7 percent |
automobile exhaust based), and (2) fuel oil was completely consumed (i.e., there was no oily waste discharged by users of fuel oil), then the land-based sources would be derived only from the use of middle distillate fractions that end up on the land surface or in municipal and industrial discharges. Expressing the best estimate of the land-based oil that was returned to the sea as a fraction of the total middle distillate consumption gives a ratio of 3.4/320, or 1.1 percent, which is still a very small percentage.
Table I-18 shows comparisons of the computed land-based loads presented in the current study for North America and other locations with the BP Amoco (2000) data. Note the ratio of land-based sources was very consistent for all countries shown.
The best estimate of petroleum hydrocarbon loading from land-based sources was about 8 times smaller than the best estimate from the National Research Council (1985), and was much smaller than other previous world estimates (Table I-19). Although estimates presented here were considerably different than the studies in Table I-19, the calculations used in this analysis were based on more measured data than in these previous studies, including the National Research Council (1985). The approach used in the current study was also consistent with methods for estimating pollutant loads from urban runoff. The upper range of the current estimates agreed fairly well with previous studies, but the 1990s STORET data suggest that the best estimate may be much lower than previous studies indicated.
Literature-reported data and data provided by Baker (2001) on the Susquehanna River confirmed that the Michel (2001) data were within a reasonable range for river total PAH concentrations (Table I-20). In addition, estimation of river PAH concentrations were made using average annual flows calculated from available flow data (Table I-3) with PAH loadings calculated for corresponding rivers in this study (Table I-13). The average of these calculated concentrations ranged from 242 to 2,900 ng L−1, with a best average concentration of 800 ng L−1 (Table I-21). While this concentration was greater than ambient river concentrations reported by other studies, it represents a conservative estimate of PAH concentrations in river water using the best available data. Furthermore, the calculated concentrations of PAH in the Mississippi River corresponded nicely with the range of total PAH measured by Michel (2001).
TABLE I-18 Comparison of Oil Consumption with Estimated Oil and Grease Loading from Land-based Sources to the Sea
|
Location |
1999 Oil Consumptiona (million tonne yr−1) |
Oil and Grease Loading to the Sea from Land-based Sourcesb (million tonne yr−1) |
Ratio of Oil and Grease Loading to the Sea to Oil Consumption (percent) |
|
North America |
1047.1 |
3.4 |
0.3 |
|
South and Central America |
218.8 |
0.7 |
0.3 |
|
Europe |
755.2 |
3.1 |
0.4 |
|
Africa |
115.5 |
0.2 |
0.2 |
|
NOTES: aSource: BP Amoco (2000); bCalculated in this study. |
|||
TABLE I-19 Comparison of Petroleum Hydrocarbon Loading Estimates from Land-based Sources from this Work and Other Studies
|
|
|
Hydrocarbon Loading (tonne yr−1) |
||
|
Reference |
Comments |
Low |
Best Estimate |
High |
|
World estimates |
||||
|
Baker (1983) |
Petroleum hydrocarbons from municipal wastes, industrial waste, and runoff |
700,000 |
1,400,000 |
2,800,000 |
|
National Research Council (1985) |
World estimate of land-based sources |
600,000 |
1,200,000 |
3,100,000 |
|
Van Vleet and Quinn (1978) |
Petroleum hydrocarbons from municipal wastes only based on Rhode Island treatment plants |
— |
200,000 |
— |
|
This work |
World estimate of land-based sources |
6,800 |
141,000 |
5,000,000 |
|
Ratio (this work: National Research Council [1985] |
|
0.01 |
0.12 |
1.61 |
|
North American estimates |
||||
|
Eganhouse and Kaplan (1982) |
US input of petroleum hydrocarbons based on mass emission rate for wastewater effluent in southern California |
— |
120,600 |
— |
|
This work |
North American estimate of land-based sources |
2,500 |
52,000 |
1,800,000 |
TABLE I-20 Comparisons of Total PAH Concentrations in Literature, Baker (2001), and Michel (2001)
|
Reference |
Description |
Range or Average Measured Total PAH Concentrations (ng L−1) |
|
Baker (2001) |
Susquehanna River, Pennsylvania |
17.01−150.81 |
|
Bidleman et al. (1990) |
Sampit River, South Carolina |
6.8 |
|
Gustafson and Dickhut (1997a) |
Elizabeth River, Virginia |
91.4 |
|
Gustafson and Dickhut (1997b) |
York River, Virginia |
29.15 |
|
Michel (2001)a |
Mississippi River, Louisiana |
100−156 |
|
Ollivon et al. (1999) |
Seine River, France |
94.44 |
|
Ollivon et al. (1999) |
Marne River, France |
148.35 |
|
aData used in the current study. |
||
TABLE I-21 Estimated Concentrations of Polycyclic Aromatic Hydrocarbon Concentrations Based on Calculated Loadings
|
|
|
Estimated Concentration (ng L−1) |
||
|
River |
Annual Flow (106 m3 yr−1) |
Low |
Best |
High |
|
Columbia |
220,892 |
19 |
26 |
320 |
|
Delaware |
10,712 |
696 |
870 |
1,102 |
|
Hudson |
12,365 |
242 |
3,258 |
4,127 |
|
James |
6,209 |
168 |
2,270 |
2,875 |
|
Mississippia |
625,760 |
101 |
126 |
160 |
|
Neuse |
3,524 |
404 |
559 |
6,902 |
|
Sabine |
7,043 |
135 |
186 |
2,297 |
|
Sacramento |
21,000 |
197 |
273 |
3,366 |
|
Susquehanna |
36,779 |
101 |
140 |
1,730 |
|
Trinity |
8,944 |
359 |
496 |
6,124 |
|
Average |
95,323 |
242 |
820 |
2,900 |
|
aEstimated oil and grease loading for Mississippi River was the same for low, best and high estimates of PAH loading (see Tables I-12 and I-13). |
||||


