
2
Understanding The Risk
|
HIGHLIGHTS This chapter includes discussions of:
|
Oil is a general term that describes a wide variety of natural substances of plant, animal, or mineral origin, as well as a range of synthetic compounds. Crude oil is a naturally occurring oil generated by geological and geochemical processes. A variety of petroleum products are then derived from this natural resource. Because their compositions vary, each type of crude oil or petroleum product has unique characteristics or properties. These properties influence how petroleum will behave when it is released and determine its effects on biota and habitats.
Crude oil and derived petroleum products (collectively referred to here as petroleum) are made up of dozens of major hydrocarbon compounds and thousands of minor ones. Hydrocarbons occur naturally in great abundance and in a variety of forms. Although petroleum is overwhelmingly composed of hydrocarbon compounds, not all hydrocarbon compounds come from petroleum. Thus, it is appropriate to limit discussion here to that subset of compounds typically associated with the term petroleum hydrocarbon. For the purposes of this study, hydrocarbon compounds containing less than five carbon atoms (e.g., methane, ethane, and other gases) were not considered because they are abundant and widespread and because their behavior differs so greatly from liquid petroleum. Furthermore, non-petroleum oils (e.g., vegetable oils, animal fats) were not included, because spills of these materials, although not trivial, present unique fate and effect problems. Addressing these spills in an adequate manner was determined to be beyond the resources of the present study.
Crude oil, the naturally occurring liquid form of petroleum, is an important part of the current energy mix of fossil fuels. As this fossil fuel is extracted, refined, transported, distributed, or consumed, spills and other releases occur. In addition, natural processes can result in seepage of crude oil from geologic formations below the seafloor to the overlying water column (see Chapter 3 for greater detail about natural and anthropogenic inputs). Understanding the nature and distribution of sources and their inputs, as well as the behavior of petroleum in the environment, is key for understanding the potential effect on the marine environment (see Chapters 4 and 5 for more detail about fate and effects).
THE COMPOSITION OF PETROLEUM
Petroleum is composed principally of hydrocarbons (compounds containing only hydrogen and carbon); thus, the terms petroleum and hydrocarbons are often used interchangeably. In fact, the elements hydrogen and carbon together (occurring as hydrocarbons or related compounds) constitute about 97 percent of most petroleum, while the
minor elements nitrogen, sulfur, and oxygen make up the remaining 3 percent (NRC, 1985). Crude oil sometimes contains mineral salts, as well as trace metals such as nickel, vanadium, and chromium. In general, the hydrocarbon compounds found in crude oil are characterized by their structure (see Speight, 1991 for greater discussion of the classification of petroleum related compounds). These compounds include the saturates, olefins, aromatics, and polar compounds. Understanding these different compounds and their structures is important for understanding the fate and effect of releases of crude oil or products derived from it.
The saturate group of compounds in various crude oils consists primarily of alkanes, which are composed of hydrogen and carbon with the maximum number of hydrogen atoms around each carbon (Speight, 1991). Thus, the term “saturate” is used because the carbons are saturated with hydrogen. The saturate group also includes cycloalkanes, which are compounds made up of the same carbon and hydrogen constituents, but with the carbon atoms bonded to each other in rings. Higher-molecular-weight saturate compounds are often referred to as “waxes.”
Olefins, or unsaturated compounds, are those that contain fewer hydrogen atoms than the maximum possible. Olefins have at least one carbon-to-carbon double bond, which displaces two hydrogen atoms. Significant amounts of olefins are found only in refined products (NRC, 1985; Speight, 1991).
Aromatic compounds include at least one benzene ring. Benzene rings are very stable, and therefore persistent in the environment, and can have toxic effects on organisms. The more volatile monoaromatic (single-ring) compounds found in crude oil are often referred to as BTEX, or benzene, toluene, ethylbenzene, and xylene (NRC, 1985; Speight, 1991).
Aromatic hydrocarbons may account for about 1 to 20 percent of the total hydrocarbons in crude oil. Benzene and alkyl benzenes with one or two methyl or ethyl groups (toluene, xylenes, ethylbenzene), the BTEX compounds, may be present at a concentration of several percent in light crude oil, but more typically are present at concentrations of 1,000 to 10,000 mg/kg (Speight, 1991). Usually, toluene is the most abundant of the BTEX compounds, followed by benzene or one of the three xylene isomers. More highly alkylated benzenes usually are present at low concentrations in crude oils.
Polycyclic aromatic (multiple-ring) hydrocarbons (PAH, also called polynuclear aromatic hydrocarbons, PNA) consist of at least two benzene rings. A typical crude oil may contain 0.2 percent to more than 7 percent total PAH.
Some related aromatic compounds (not technically hydrocarbons because they may contain within their structure many elements such as sulfur, nitrogen, and oxygen) are detected with the same analytical techniques and often occur with true polycyclic aromatic hydrocarbons. Thus, these compounds are often grouped with, and discussed as, PAH. PAH includes those compounds that have the most serious environmental effects of the compounds in crude oil. PAH in the environment are derived largely from combustion of oil and coal, but are also produced by the burning of wood, forest fires, and a variety of other combustion sources.
The abundance of aromatic hydrocarbons in petroleum usually decreases with increasing molecular weight. In most cases, one-ring (benzene) through three-ring (phenanthrene) aromatic hydrocarbons and related heterocyclic aromatic hydrocarbons, such as dibenzothiophene, account for at least 90 percent of the aromatic hydrocarbons that can be resolved in crude petroleum by conventional analytical methods (Neff, 1990). Four- through six-ring PAH (pyrene/fluoranthene through coronene), some of which are known mammalian carcinogens, usually are present at low or trace concentrations in crude oils (Kerr et al., 1999). The PAH in petroleum often contain one or more methyl, ethyl, or occasionally higher alkyl substituents on one or more aromatic carbons. As a general rule, these alkylated PAH are more abundant than the parent compounds in petroleum (Sporsol et al., 1983).
Of the hydrocarbon compounds common in petroleum, PAH appear to pose the greatest toxicity to the environment (see Chapter 5 for greater discussion). Most of the PAH compounds in petroleum are not as toxic as those produced by certain combustion processes, but most groups are significant components of runoff from paved surfaces.
Polar compounds are those that have a significant molecular charge as a result of bonding with elements such as sulfur, nitrogen, or oxygen. The polarity of the molecule results in behavior that differs from that of unpolarized compounds under some circumstances. In the petroleum industry, the smallest polar compounds are known as resins. The larger polar compounds are called asphaltenes and often make up the greatest percentage of the asphalt commonly used for road construction. Asphaltenes often are very large molecules, and if abundant in a specific volume of oil, they have a significant effect on oil behavior.
PROPERTIES OF CRUDE OIL OR PETROLEUM PRODUCTS
The properties of liquid petroleum, including crude oil or refined products, that are most important in understanding the behavior and fate of spills or other releases are viscosity, density, and solubility (see Chapter 4 for greater detail).
Viscosity is the resistance to flow in a liquid. The lower the viscosity, the more readily the liquid flows. The viscosity of oil or petroleum products is determined largely by the proportion of lighter and heavier fractions that it contains. The greater the percentage of light components such as saturates and the lesser the amount of asphaltenes, the lower is the viscosity. Highly viscous oils tend to weather more slowly because they do not spread into thin slicks. Instead, they form tarballs, which can be transported long distances and accumulate in thick deposits on shorelines that can persist for decades.
Density is the mass of a given volume of oil or petroleum product and is typically expressed in grams per cubic centimeter.1 It is the property used by the petroleum industry to define light or heavy crude oils. Density is also important because it indicates whether a particular oil will float or sink in water. The density of pure water is 1.0 g/cm3 (at 15ºC) and the density of most oils ranges from 0.7 to 0.99 g/cm3 (at 15ºC), thus most oils will float on water. Since the density of seawater is 1.03 g/cm3 (at 15ºC), thus even heavier oils will usually float on it. Density is often used as a surrogate for predicting the relative rate of natural weathering when crude oil or other petroleum products are released to the environment. Light oils contain petroleum hydrocarbons that are readily lost via evaporation and microbial degradation. Heavy oils contain a greater percentage of the higher-molecular-weight petroleum hydrocarbons that are more resistant to weathering.
Solubility in water is the measure of the amount of an oil or petroleum product that will dissolve in the water column on a molecular basis. Because the amount of dissolved oil is always small, this is not as significant a loss mechanism as evaporation. In fact, the solubility of oil in water is generally less than 100 parts per million (ppm). However, solubility is an important process because the water-soluble fractions of the oil are sometimes toxic to aquatic life. Thus, although solubilization represents a minor loss process, the concentration of toxic compounds dissolved in water from oil may be sufficient to have impacts on marine organisms.
BEHAVIOR IN THE ENVIRONMENT
Oil or petroleum products spilled on water undergo a series of changes in physical and chemical properties that, in combination, are termed “weathering.” Weathering processes occur at very different rates but begin immediately after oil is released into the environment. Weathering rates are not consistent and are usually highest immediately after the release. Both weathering processes and the rates at which they occur depend more on the type of oil than on environmental conditions. Most weathering processes are highly temperature dependent, however, and will often slow to insignificant rates as the temperature approaches zero. Table 2-1 is a summary of the processes that affect the fate of petroleum hydrocarbons from seven major input categories. Each input is ranked using a scale of high, medium, and low that indicates the relative importance of each process. The table is intended only to convey variability and is based on many assumptions. Nevertheless, it does provide a general idea of the relative importance of these processes. Clearly one of the biggest problems in developing such a table is that the importance of a particular process will depend on the details of the spill event or release. Table 2-1 attempts to account for this to a limited extent in the case of accidental spills by including subcategories for various oil types (see Chapter 4). This table emphasizes the role various environmental processes can play in spills of widely varying types. This in turn underscores how just one facet of the complex set of variables may vary from spill to spill, making each spill a unique event. Thus, the chemical and physical character of crude oils or refined products greatly influence how these compounds behave in the environment as well as the degree and duration of the environmental effects of their release.
Relating Size of Release to Impact on Organisms
This report attempts to compile and estimate total release (or loadings) of petroleum hydrocarbons to the marine environment from a variety of sources. These loading rates, in units of mass per unit time, are useful to compare the relative importance of various types of loadings and to explore the spatial distribution of loadings. Obviously, sources of petroleum that release significant amounts (whether through spills or chronic discharges) represent areas where policymakers, scientists, and engineers may want to focus greater attention. Attributing specific environmental responses to loadings calculated at worldwide or regional scales, however, is currently not possible.
As discussed earlier, petroleum is a complex group of mixtures, and each group may contain widely varying relative amounts of hundreds (or more) compounds. Although many of the compounds are apparently benign, many other, such as some types of PAH, are known to cause toxic effects in some marine organisms. To further complicate this picture, marine organisms (even in the same taxa) vary greatly in their sensitivity to the same compound. Predicting the environmental response to a specific release of a known quantity of a refined petroleum product (which contains far fewer compounds than crude oil) requires much site-specific information about the nature of the receiving water body. Thus, the estimated loadings reported later in this chapter or in Chapter 3, are best used as a guide for future policymaking. In addition to identifying potential sources of concern, these estimates may have some value as performance metrics. Specifically, in those cases where reasonable comparisons can be made to estimates developed in earlier studies, they have value as a measure of the effectiveness of already implemented policies designed to reduce petroleum pollution.
Much of what is known about the impacts of petroleum hydrocarbons comes from studies of catastrophic oil spills and chronic seeps. These two aspects of petroleum pollution (loading and impact) are distinct, and it is not possible to
TABLE 2-1 Processes That Move Petroleum Hydrocarbons Away from Point of Origin
directly assess environmental damage from petroleum hydrocarbon mass loading rates. As discussed in Chapters 4 and 5 to a very large degree, loading rates reflect the intensity and location of societal use of petroleum, whereas effects tend to reflect the amount of toxic hydrocarbon compounds reaching a marine organism and the differing susceptibility of various organisms, populations, and ecosystems to the effects of these hydrocarbons. The reader is therefore strongly cautioned against inferring impacts from the mass loading rates. For instance, one might be tempted to calculate the “Exxon Valdez-equivalence” by comparing the quantity of petroleum released from a specific source to that released during the Exxon Valdez spill and then concluding that the impact of the petroleum release will be a corresponding multiple of the Exxon Valdez impact. This is a flawed analysis. Ecotoxicological responses are driven by the dose of petroleum hydrocarbons available to an organism, not the amount of petroleum released into the environment. Because of the complex environmental processes acting on the released petroleum, dose is rarely directly proportional to the amount released. In addition, one must consider the type of petroleum released and the susceptibility of the target organisms. Complex geochemical and pharmacokinetic models are required to translate petroleum release rates into environmental exposures. Even once these factors are accounted for, it is often difficult to reach consensus on the magnitude and duration of environmental effects (Box 2-1).
The amount of petroleum made available to an organism through various environmental processes (whether for ingestion or absorption) is referred to as being biologically available, or simply “bioavailable.” Just as combustion during smoking makes nicotine in tobacco bioavailable to the smoker, physical, chemical, and even biological processes determine how bioavailable toxic compounds in oil and other petroleum products will be to marine organisms. It is understandable, therefore, that the release of equal amounts of the same substance at different times or locations may have dramatically different environmental impacts.
Broadly speaking, the term “bioavailability” can therefore be used to describe the net result of physical, chemical, and biological processes that moderate the transport of hydrocarbon compounds from their release points to the target organisms. As the spill moves from the release point to the marine organism, these processes alter the chemical composition of the petroleum mixture, which in turn likely alters the toxicity by selectively enriching or depleting the toxic components (Bartha and Atlas, 1987). Physical weathering processes (Table 2-1) may encapsulate some or all of the petroleum in forms that are less available to organisms (e.g., tarballs). Various physiological and behavior processes moderate the movement of petroleum from the surrounding environment into marine organisms. Individual petroleum components pass into organisms at different rates, depending on their physical and chemical properties. Organisms respond to hydrocarbons in their surroundings and moderate or accentuate exposure. Incidental ingestion of oil by preening birds enhances exposure, while short-term cessation of filter feeding by bivalves in response to hydrocarbons in the water limits exposure. Once the hydrocarbons are in the organisms, there is a wide variation in the types and magnitudes of physiological responses. Many organisms readily metabolize and excrete hydrocarbons, although these pathways may create more toxic intermediates. In short, the processes of bioavailability, including petroleum fate and transport in the coastal ocean and disposition within marine organisms, are the most complex and least understood aspects of oil in the sea. Although there is a reasonable understanding of the amount of petroleum hydrocarbons released to the coastal ocean, and one can estimate the impact of spilled petroleum under previously studied conditions, generalizing these findings to predict hydrocarbon impacts from all sources on North American coastal waters is currently not possible.
|
BOX 2-1 Lessons from Exxon Valdez: Science in a Litigious Environment In addition to being the largest oil spill in U.S. waters, the Exxon Valdez Oil Spill (EVOS) has been a seminal event in the development of U.S. environmental policy. Efforts to ascertain the extent of the injury and the rate of recovery from the spill have been particularly divisive and opposing positions have been hotly debated. The relevant federal regulation (43 CFR 11.14) provides definitions of both injury and recovery, but does not specify how these are to be objectively measured. Thus, both the responsible party (Exxon) and the resource trustees (EVOS Trustee Council) developed different perspectives on how to define both injury and recovery, these differences reflecting very real differences in each group’s political, social, and financial objectives and responsibilities. These different perspectives and objectives led to differing technical and scientific approaches or methods for quantifying both the extent of the initial injury and the rate of recovery. These different approaches then led to different results and conflicting, and often incompatible, conclusions from two sets of studies. At the core of many disagreements centering on uncertainty in cause and effect were the questions of burden of proof and the application of the precautionary principle. In general, Exxon demanded a high level of proof to accept an injury, whereas the Trustees used a weight-of-evidence approach that accepted higher levels of uncertainty. Such situations are not uncommon in the world of science. Science is often divisive. In fact, the scientific method uses trial-and-error hypothesis testing and peer criticism to develop understanding in the form of a consensus opinion. Thus, scientific understanding is often best developed under a dynamic tension between consensus building and division. Litigation, however, offers a drastically different and somewhat incompatible set of rules. The purpose of litigation (from the latin litigāare, to dispute, quarrel, sue) is to resolve differences by determining which party has the stronger of two legal arguments. As in many instances where scientific or technical evidence forms the central tenant of either party’s argument, the dynamic tension between consensus building and division shifts perceptibly and inextricably toward division. Finding common ground in a litigious environment is not a priority, in fact it may even be considered to be antithetic to the purpose of litigation. Thus, while scientific and technical questions that arise within the litigious environment surrounding an event like EVOS may have broad implications for fundamental scientific understanding of the way systems respond to perturbations, the totality of the scientific effort expended during litigation cannot reasonably be expected to lead to a consensus opinion. This was recognized early on in the post-EVOS world, and a growing desire to inject new approaches or philosophies to facilitate cooperative approaches for developing natural resource damage assessments (NRDAs) began to emerge. Eventually, using authority granted under the Oil Pollution Act of 1990 (commonly referred to as OPA 90), NOAA instituted a new set of NRDA regulations that codified steps to develop cooperative assessment plans involving both the responsible party and the resource trustees. Under these regulations, responsible parties must be given the opportunity to participate in the damage assessment and, when appropriate, jointly conduct a coordinated and open damage assessment. The invitation to participate must be in writing and as early as practical, but no later than the completion of the preliminary assessment phase of the incident. There should be a formal agreement on how the cooperation is to be structured. The process should be open and all results available to the public. There are many benefits of cooperative assessments: cost savings because only one set of studies is being conducted; less potential for litigation because both sides are working with the same data and are more likely to reach common ground; and restoration can be accomplished more quickly because efforts can be shifted to designing restoration projects rather than preparing for litigation. Inherent in the cooperative process is trust. Each group has to trust the other to make a good faith effort to make the process succeed. Otherwise, there is the fear that cooperation will be abused: one side uses the knowledge gained in the process to build a better legal defense; studies are intentionally designed to provide data that are too weak for use in litigation; one side only pretends to be working cooperatively, or only agrees to cooperate on data collection and initial analysis, then the case changes to an uncooperative process for final negotiations and litigation, leaving the other side with a weaker case. Ongoing and future efforts to define the injury and recovery of the ecosystem in and around Prince William Sound due to EVOS will continue to raise important scientific questions and will contribute greatly to scientific understanding of the effect of releases of petroleum at a variety of scales. However, the development of a consensus opinion regarding the answers to these same questions most likely lies outside research efforts currently embroiled in the EVOS litigation. |
Understanding the Impacts of Spills and Other Releases
Oil in the sea, whether from spills or chronic sources, is perceived as a major environmental problem. Occasional major oil spills receive considerable public attention because of the obvious attendant environmental damage, oil-coated shorelines, and dead or moribund wildlife, including, in particular, oiled seabirds and marine mammals (Box 2-2). These acute effects may be of short duration, or they may have long-term population- or community-level impacts depending on the circumstances of the spill and the numbers and types of organisms affected. Oil in the sea also occurs when small amounts are released over long periods of time, resulting in chronic exposure of organisms to oil and its component chemical compounds. Sources of chronic exposures include point sources, such as natural seeps, a leaking pipeline,
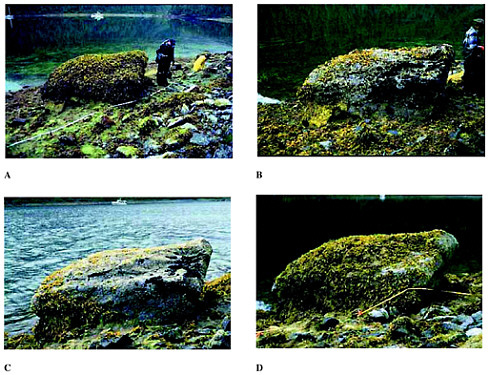
PHOTO 4 Each year since 1990, scientists studying shoreline recovery following the Exxon Valdez spill in Prince William Sound have taken photos of a prominent boulder, know commonly referred to as Mearns Rock. The photo series, available at http://response.restoration.noaa.gov/photos/mearns/mearns.html, demonstrates the complex changes that can take place year to year in the nature and abundance of marine organisms. (A) 1991 The entire boulder is covered with Fucus sp., a gold-brown algae. Notice the darker species of seaweed forming an apron around the base of the boulder. The beach area surrounding the boulder (the “beach face”) is also completely covered with other seaweed species. In the water behind the boulder, healthy eelgrass (Zostera marina) bed is visible. The boulder’s condition appears to be improving, shown by the heavier covering of seaweed. (B) 1993 Fucus now covers about 20 percent of the boulder’s surface. Large, older plants are gone apparently replaced by young plants. Mussels are growing on the front face of the boulder (black regions). (C) 1995 About half of the mussels have disappeared, leaving smaller dark regions on the right side of the boulder. Fucus is making a comeback on the left side and top surface of the boulder. Also visible is an apparent resurgence of algal growth on the beach face. The disappearance of the mussels may be the result of predation (perhaps by sea otters) or natural mortality. Regardless of whatever caused the boulder’s plant life to die back in 1993-94, the boulder now seems to be supporting new plant and animal life. (D) 1997 The boulder is once again covered (about 80 percent) with the seaweed Fucus. There are several age groups of Fucus on the boulder. Young Fucus is growing over the top section of the boulder and adult Fucus is growing around the mid-portion. The beach face is again rich with seaweed. No mussels are visible and the areas occupied by the barnacles have shrunk. Starfish and sea otters may have been preying on the mussels, and a predatory snail, Nucella, has likely been eating the barnacles.
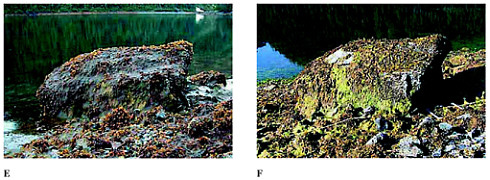
(E) 2000 Mature Fucus now covers about 10 percent of the boulder’s surface. In addition, there is a heavy cover of a grayish, slimy seaweed (this could be any of three or four seaweed species that can look like this). The white areas on the beach face look to be large barnacle sets. Eelgrass is barely visible in the water. As in the 1993 photo, the mature Fucus plants are again dying back. However, at this time, there is no sign of a third new crop of young Fucus. (F) 2001 This year, the boulder has a 20-30 percent cover of Fucus. Older (brownish) plants are visible on the left section of the boulder and younger (greenish-brown) plants on the right. A whitish “bald” patch on the upper left is actually a patch of barnacles. Another bare-looking patch on the lower right corner contains barnacles (white) and small mussels (dark spots). A bright green algae, possibly “sea lettuce” (Ulva) droops down along the lower third of the rock face. Algae and barnacles also cover most of the cobble on the beach face. (Photo by Alan Mearns, courtesy of NOAA Office of Response and Restoration.)
|
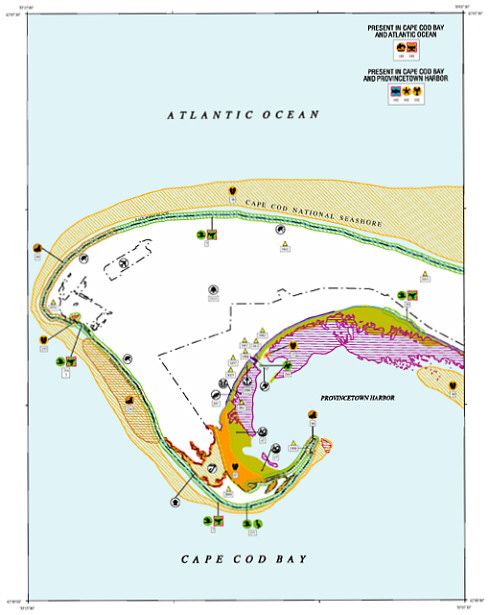
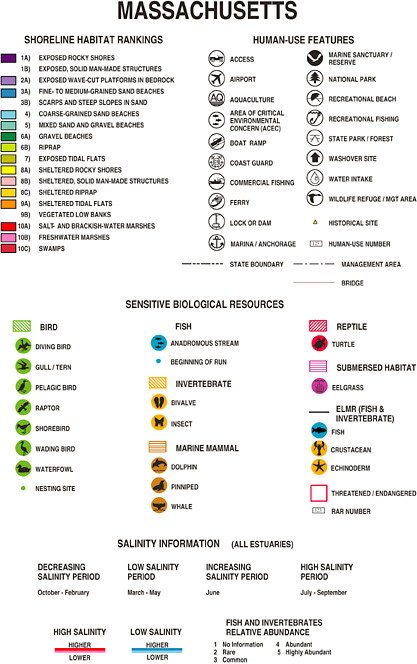
BOX 2-2 Environmental Sensitivity Index Mapping In 1979, as the oil from the Ixtoc II well blowout approached the U.S. coast, the Scientific Support Team from the Hazardous Materials Response Branch of the National Oceanic and Atmospheric Administration (NOAA) was advising the U.S. Coast Guard on protection priorities. The concept of ranking shorelines according to their oil spill sensitivity had recently been developed (Michel et al., 1978), and it was first applied in the days prior to oil landfall in south Texas. In 1980, the first Environmental Sensitivity Index (ESI) maps were produced for south Florida; by 1990, hardcopy ESI maps were available for most of the U.S. coastline. Since 1990, updated maps have been produced using Geographical Information System (GIS) technology, with both hard copy and digital products available. ESI maps and databases are comprised of three general types of information (Fig. 2-1; Halls et al., 1997): Shoreline Classification. The shoreline habitats are ranked according to a scale relating to sensitivity, natural persistence of oil, and ease of cleanup. A scale of 1 to 10 is used, with 1 being least sensitive and 10 the most sensitive. The classification system has been standardized nationwide, for estuaries, rivers, and lakes. The ranking scheme is based on extensive, empirical observations at oil spills, and it has become the basis for many spill response tools and strategies, such as protection prioritization, selection of response options, and determination of cleanup endpoints. Biological Resources. The maps display the spatial and temporal distributions of oil-sensitive animals, habitats, and rare plants that are used by oil-sensitive species or are themselves sensitive to oil spills. There are seven major biological groups (marine mammals, terrestrial mammals, birds, fish, invertebrates, reptiles and amphibians, and habitats and plants), which are further divided into groups of species with similar taxonomy, morphology, life history, and/or behavior relative to oil spill vulnerability and sensitivity. The maps show the locations of the highest concentrations, the most sensitive life-history stages or activities, and the most vulnerable and sensitive species. The maps link to data tables that include species name, legal status of each species (state and/ or federal threatened or endangered listing), concentration at that specific location, seasonal presence and/or abundance by month, and special life-history time periods (e.g., for birds, nesting, laying, hatching, and fledging dates). Human-Use Resources. The maps show four specific areas that have increased sensitivity and value because of their use: high-use recreational and shoreline access areas; management areas (e.g., marine sanctuaries and refuges); resource extraction locations (e.g., water intakes, subsistence areas); and archaeological, historical, and cultural resource locations. Sensitivity maps are used to identify protection priorities in vessel and facility response plans, and they are used in area contingency plans as part of the Sensitive Areas Annex. ESI maps use a standard set of colors and symbology so responders from any region can use the maps readily. The concept of sensitivity mapping has been adopted internationally as a key component of oil spill contingency planning (Baker et al., 1995). Sensitivity atlases have been produced for such diverse areas as Australia, Mauritius, South Africa, the Gaza Strip, the North Sea, most of Canada, and the Sakhalin Islands. |
production discharges, or a land-based facility. In these cases, there may be a strong gradient from high to low oil concentration as a function of distance from the source. In other cases, such as land-based runoff and atmospheric inputs, the origin of the oil is a non-point source, and environmental concentration gradients of oil compounds may be weak. Chronic exposures may also result from the incorporation of oil into sediments in which weathering of oil is slow and from which nearly fresh oil may be released to the water column over extended periods. In recent years, it is the long-term effects of acute and chronic oil contamination that have received increasing attention (Boesch et al., 1987)
Petroleum Hydrocarbon Pollution and Its Possible Effects
Petroleum hydrocarbon inputs into North American and worldwide marine waters were computed, based on various databases, for several major categories. Three activities— extraction, transportation, and consumption—are the main sources of anthropogenic petroleum hydrocarbon pollution in the sea. Each of these activities poses some risk of oil release, and as greater amounts of petroleum hydrocarbons are imported into North American waters, the risk increases. The categories are listed in Table 2-2. Details of the methods used, discussion of databases, and computation and distribution of sources are discussed in Appendixes C, D, E, F, G, H, and I. Table 2-2 and Figures 2-2A and 2-2B summarize the sources and inputs for North American and worldwide waters (see Chapter 3 for greater details). Table 2-3 summarizes conclusions about the intercomparability of the data, methods, and assumptions used develop these estimates with those reported by the NRC in 1985 and what significance if any, can be attached to changes in those estimates.
The acute toxicity of petroleum hydrocarbons to marine organisms is dependent on the persistence and bioavailability of specific hydrocarbons. The ability of organisms to accumulate and metabolize various hydrocarbons, the fate of metabolized products, the interference of specific hydrocarbons (or metabolites) with normal metabolic processes that may alter an organism’s chances for survival and repro
TABLE 2-2 Average, Annual Releases (1990-1999) of Petroleum by Source (in thousands of tonnes)
|
|
North Americaa |
Worldwide |
|||||
|
|
Best Est. |
Regionsb |
Min. |
Max. |
Best Est. |
Min. |
Max. |
|
Natural Seeps |
160 |
160 |
80 |
240 |
600 |
200 |
2000 |
|
Extraction of Petroleum |
3.0 |
3.0 |
2.3 |
4.3 |
38 |
20 |
62 |
|
Platforms |
0.16 |
0.15 |
0.15 |
0.18 |
0.86 |
0.29 |
1.4 |
|
Atmospheric deposition |
0.12 |
0.12 |
0.07 |
0.45 |
1.3 |
0.38 |
2.6 |
|
Produced waters |
2.7 |
2.7 |
2.1 |
3.7 |
36 |
19 |
58 |
|
Transportation of Petroleum |
9.1 |
7.4 |
7.4 |
11 |
150 |
120 |
260 |
|
Pipeline spills |
1.9 |
1.7 |
1.7 |
2.1 |
12 |
6.1 |
37 |
|
Tank vessel spills |
5.3 |
4.0 |
4.0 |
6.4 |
100 |
93 |
130 |
|
Operational discharges (cargo washings) |
nac |
na |
na |
na |
36 |
18 |
72 |
|
Coastal facility spills |
1.9 |
1.7 |
1.7 |
2.2 |
4.9 |
2.4 |
15 |
|
Atmospheric deposition |
0.01 |
0.01 |
traced |
0.02 |
0.4 |
0.2 |
1 |
|
Consumption of Petroleum |
84 |
83 |
19 |
2000 |
480 |
130 |
6000 |
|
Land-based (river and runoff) |
54 |
54 |
2.6 |
1900 |
140 |
6.8 |
5000 |
|
Recreational marine vessel |
5.6 |
5.6 |
2.2 |
9 |
nde |
nd |
nd |
|
Spills (non-tank vessels) |
1.2 |
0.91 |
1.1 |
1.4 |
7.1 |
6.5 |
8.8 |
|
Operational discharges (vessels ≥100 GT) |
0.10 |
0.10 |
0.03 |
0.30 |
270 |
90 |
810 |
|
Operational discharges (vessels<100 GT) |
0.12 |
0.12 |
0.03 |
0.30 |
ndf |
nd |
nd |
|
Atmospheric deposition |
21 |
21 |
9.1 |
81 |
52 |
23 |
200 |
|
Jettisoned aircraft fuel |
1.5 |
1.5 |
1.0 |
4.4 |
7.5 |
5.0 |
22 |
|
Total |
260 |
250 |
110 |
2300 |
1300 |
470 |
8300 |
|
aNumbers are reported to no more than two significant figures. b“Regions” refers to 17 zones or regions of North American waters for which estimates were prepared. These are discussed later in this chapter. cCargo washing is not allowed in U.S. waters, but is not restricted in international waters. Thus, it was assumed that this practice does not occur frequently in U.S. waters (see Chapter 3 and Appendix E). dEstimated loads of less than 10 tonnes per year reported as “trace.” eWorldwide populations of recreational vessels were not available (see Chapter 3 and Appendix F). fInsufficient data were available to develop estimates for this class of vessels (see Chapter 3 and Appendix E). |
|||||||
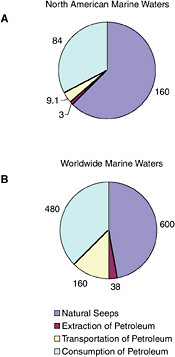
FIGURE 2-2 Relative contribution of average, annual releases (1990-1999) of petroleum hydrocarbons (in kilotonnes) from natural seeps and activities associated with the extraction, transportation, and consumption of crude oil or refined products to the marine environment.
duction in the environment, and the narcotic effects of hydrocarbons on nerve transmission are major biological factors in determining the ecologic impact of any release. Weathering processes may alter oil composition and thus its toxicity (Burns et al., 2000; Neff et al., 2000). With weathering, there is a subsequent loss of monoaromatic compounds, and the polycyclic aromatic hydrocarbons become more important contributors to the toxicity of weathered oils. Other factors that may contribute to alterations in toxicity include photodegradation and photoactivation (Mallakin et al., 1999; Boese et al., 1999).
Data gathered from several spills that occurred in the 1970s and 1980s demonstrated that the higher molecular weight aromatic compounds, such as the alkylated phenanthrenes and alkylated dibenzothiophenes, are among the most persistent compounds in both animal tissues and sediments (Capuzzo, 1987). Impairment of feeding mechanisms, growth rates, development rates, energetics, reproductive output, recruitment rates and increased susceptibility to disease and other histopathological disorders are some examples of the types of sublethal effects that may occur with exposure to petroleum hydrocarbons (Capuzzo, 1987). Early developmental stages can be especially vulnerable to hydrocarbon exposure, and recruitment failure in chronically contaminated habitats may be related to direct toxic effects of hydrocarbon-contaminated sediments (Krebs and Burns, 1977; Cabioch et al., 1980, Sanders et al., 1980; Elmgren et al., 1983).
Marine birds and mammals may be especially vulnerable to oil spills if their habitats or prey become contaminated. In addition to acute effects such as high mortality, chronic, low-level exposures to hydrocarbons may affect survival and reproductive performance of seabirds and some marine mammals. Sublethal effects of oil on seabirds include reduced reproductive success and physiological impairment, including increased vulnerability to stress (reviewed in Hunt, 1987; Fry and Addiego, 1987, 1988; Briggs et al., 1996). In contrast, in marine mammals, sublethal exposure to petroleum hydrocarbons has been shown to cause minimal damage to pinnipeds and cetaceans (e.g., Geraci, 1990; St. Aubin, 1990), although sea otters appear to be more sensitive (Geraci and Williams, 1990; Monson et al., 2000). Oil can also indirectly affect the survival or reproductive success of marine birds and mammals by affecting the distribution, abundance, or availability of prey.
Oil inputs from consumption activities vary widely in composition, persistence, loading rates by area and season, and effects. The single largest inputs of both petroleum hydrocarbons and PAH from this general source are land-based sources, which are composed of petroleum hydrocarbons that have already undergone considerable chemical and biological weathering during overland and riverine transport by the time they enter coastal waters. Further weathering rates will be slow. The hydrocarbons are mostly sorbed onto suspended sediments; thus their bioavailability is highly variable, depending on the feeding behavior of different organisms, sediment deposition patterns and rates, organic carbon content of the sediments, and the partitioning behavior of individual PAH. In contrast, although the input from the operation of recreational marine vessels in coastal waters is large, the bulk of the fuel is gasoline, which volatilizes from the surface water at rates that last on the order of several minutes to hours at 15ºC. The temporal and spatial discharge patterns are different from other sources, with most recreational boating being concentrated in the summer months and in coastal waters.
Chronic contamination by petroleum hydrocarbons from sources other than oil spills may be found in many coastal urban areas as a result of non-point source petroleum spillage, the burning of fossil fuels, and municipal wastewater discharges. The persistence of some compounds such as PAH in sediments, especially in urban areas with multiple
TABLE 2-3 Validity and Significance of Comparisons Between Estimates from NRC (1985) and Current Report
|
This Report |
1985 Report |
Comparability |
Significance of change in estimate |
|
Natural Seeps |
Marine Seeps |
Changes in methods, data, and assumptions significant, but gross comparison still valid. |
Natural seeps are a significant source in both reports. |
|
|
Sediment erosion |
Differences in approach for calculated land-based loads prevent direct comparison. |
Both reports point out that at worldwide or continental scales, the load from eroded source rocks is overwhelmed by natural seeps or anthropogenic loads from land-based sources. Thus, these sources may be of local significance in areas where seeps or anthropogenic loads are essentially absent. |
|
Extraction of Petroleum |
Offshore production |
Changes in groupings of subcategories make direct comparison with 1985 study impossible. |
|
|
Platforms |
Platforms and pipelines |
Both studies used national databases as the foundation for the resulting estimate. However, the 1985 report combined spills from pipelines with platforms. Thus, combining the estimates for these two sources in the current study should allow valid comparison at two significant figures. |
Reduction in worldwide estimate from 40,000 tonnes per year to 13,000 tonnes per year is significant and is believed to reflect changes in industry practice, especially in areas where stricter regulations have been implemented. |
|
Produced waters |
Operational (produced water) discharges |
Basic approach was similar but the most significant difference was in how the volume of produced water was determined. In 1985, produced water was determined as a fraction of oil production. The current study used reported data on produced water volume for North America and the North Sea, and extrapolations to worldwide production. Also, oil content was based on actual reported measurements in North America and the North Sea. |
The increase from roughly 10,000 tonnes per year to 36,000 tonnes per year is significant, mostly reflecting an increase in the amount of produced water discharged as oil production fields mature, but also related to increased offshore oil production. |
|
Atmospheric deposition |
|
Not accounted for in 1985 study. |
Small number calculated in the current study suggests the input is significant only in terms of its impact on local air quality. |
|
Transportation of Petroleum |
Transportation |
Changes in groupings of subcategories make direct comparison with 1985 study impossible. Combining estimates for relevant categories (tanker operations, dry docking, marine terminals, bilge & fuel oil, tanker accidents, non-tanker accidents) in current study allows for valid comparison at two significant figures. |
The decrease from 1.5 million tonnes to 420,000 tonnes is significant and reflects the substantial steps taken to reduce the incidence of transportation related spills and operational discharges worldwide. |
|
Pipeline spills |
|
Included with platforms in 1985 study. |
|
|
Spills (tank vessels) |
Tanker accidents |
Both studies used international databases as the foundation for the resulting estimate. Thus, the results should be grossly comparable at two significant figures. |
The decrease from 700,000 tonnes per year to 100,000 tonnes is significant and reflects the substantial steps taken to reduce the incidence of transportation-related spills worldwide. |
|
Operational discharges (cargo oil) |
Tanker operations |
Differing quality of data and changes in methodology make comparisons of little value. |
|
|
Coastal facility spills |
Dry-docking |
Both studies used international databases as the foundation for the resulting estimate. However, nature and type of facilities included makes comparison of limited value. |
|
|
|
Marine terminals |
Grouped with Dry Docking and Refineries in current study. |
|
|
|
Refineries |
Grouped with Dry Docking and Marine Terminals in current study. |
|
|
Atmospheric deposition (tanker VOC) |
|
Not accounted for in 1985 study. |
Small number calculated in the current study suggests the input is significant only in terms of its impact on local air quality. |
|
This Report |
1985 Report |
Comparability |
Significance of change in estimate |
|
Consumption of Petroleum |
|
Changes in groupings of subcategories make direct comparison with 1985 study impossible. |
|
|
Land-based (river and runoff) |
Municipal & industrial wastes |
Significant differences in data quality, assumptions, and methodology make comparison meaningless. |
The large numbers suggested by both studies, although not directly comparable, suggest that land-based sources of petroleum pollution to coastal environments is a significant environmental concern at a variety of scales. |
|
|
Municipal wastes |
Grouped with all land-based sources in current report. |
|
|
|
Non-refinging industrial wastes |
Grouped with all land-based sources in current report. |
|
|
|
Urban runoff |
Grouped with all land-based sources in current report. |
|
|
|
River runoff |
Grouped with all land-based sources in current report. |
|
|
Recreational marine vessels |
|
Not accounted for in 1985 study. |
Large number calculated during current study suggests this may be an important source of petroleum pollution, especially given the environmental sensitivity of the coastal areas where these vessels most commonly operate. |
|
Spills (commercial vessels ≥100 GT) |
Nontanker accidents |
Both studies used national databases as the foundation for the resulting estimate. Thus, the results should be comparable at two significant figures. |
The decrease from 20,000 tonnes per year to 7,100 tonnes is significant and reflects the substantial steps taken to reduce the incidence of transportation-related spills worldwide. |
|
Operational discharges (vessels ≥100GT) |
Bilge and Fuel oils |
Differences in data, assumptions, and methodology make comparison of little value. |
|
|
Operational discharges (vessels <100GT) |
|
1985 study did not differentiate based on vessel size. |
|
|
Atmospheric deposition |
Atmosphere |
Differences data, assumptions, and methodology make comparison of limited value. |
Large numbers calculated in both studies suggest this may be a significant input of petroleum (especially PAH) to the marine environment |
|
Jettisoned aircraft fuel |
|
Not accounted for in 1985 study. |
Large number (7,500 tonnes worldwide) suggests that this source may generate significant loading at local scales. |
|
|
Ocean dumping |
Not accounted for in current study. |
Ocean disposal of wastewater treatment/sewage sludge has been banned in the United States and elsewhere, but may be locally significant where practiced. However, given the large uncertainty already associated with estimates of land-based sources (2 orders of magnitude), calculating the additional loads to each region or worldwide from sludge disposal was deemed to be of limited value. |
sources of petroleum inputs, is an example of chronic persistence and toxicity beyond the observations made following oil spills. Meador et al. (1995) reviewed the processes controlling the uptake and persistence of PAH in marine organisms, especially under chronic exposure conditions, highlighting differential mechanisms of tissue distribution and elimination. Transfer of contaminants to marine biota and the human consumer and toxicological effects on the ecosystem are dependent on the availability and persistence of these contaminants within benthic environments. The incidence of tumors and other histopathological disorders in bottom-dwelling fish and shellfish from contaminated coastal areas has been suggested as a possible link to chronic hydrocarbon exposure and uptake (Neff and Haensly, 1982; Berthou et al., 1987; also see Chapter 5).
To understand the toxic effects of petroleum hydrocarbon releases to the marine environment, one has to examine the loading of the more toxic components of the hydrocarbon mixture. Since PAH are thought to be responsible for many of the biological effects of petroleum, estimates of PAH
TABLE 2-4 Estimated PAH Contribution to North American Waters and Assumptions of Oil Type Composition by Source
|
Source |
Description of Composition by Oil Type |
Estimated PAH Contribution (thousands of tonnes per year) |
|
Natural Seeps |
Crude oil |
2.5 |
|
Petroleum Extraction |
|
|
|
Platforms |
Crude oil, heavy distillates, light distillates, and gasoline |
0.0016 |
|
Produced waters |
Crude oil |
0.052 |
|
Atmospheric deposition |
See Chapter 3 and Appendix D |
0.016 |
|
Subtotal |
|
0.070 |
|
Petroleum Transportation |
|
|
|
Vessel spills |
Crude oil, heavy distillates, light distillates, and gasoline |
0.12 |
|
Pipelines |
Crude oil, heavy distillates, light distillates, and gasoline |
0.030 |
|
Coastal facilities |
Crude oil, heavy distillates, light distillates, gasoline |
0.0040 |
|
Atmospheric deposition |
See Chapter 3 and Appendix E |
0.016 |
|
Subtotal |
|
0.17 |
|
Petroleum Consumption |
|
|
|
Land-based |
See Chapter 3 and Appendix I |
0.54 |
|
Aircraft dumping |
Jet fuel |
0.031 |
|
Recreational vessels |
Lube oil |
0.0015a |
|
< 100 GT vessels |
Light distillates |
0.0040 |
|
> 100 GT vessels |
Heavy distillates and light distillates |
0.0084 |
|
Atmospheric deposition |
See Chapter 3 and Appendix H |
1.60 |
|
Subtotal |
|
2.2 |
|
Total |
|
4.9 |
|
aPyrogenic PAH produced during incomplete combustion is not included in this value, which must therefore be considered as a minimum estimate. |
||
loads from various petroleum sources were derived for the major sources of petroleum (Table 2-4). Although these numbers may have value as first-order indicators of where loads of PAH may be important, it is important to note that the toxic effect of specific PAH compounds differ from that of the entire class. Furthermore, sensitivity to various specific PAH compounds can vary dramatically among species, even among closely related taxonomic groups (see Chapter 5). As with other effects from spills, the timing and nature of introduction of PAH, as well as the environmental processes (see Chapter 4) operating at the time, can play a significant role in determining the ultimate toxicological effect these compounds may have.
Many of the source types, including natural seeps, platforms, pipelines, produced waters, vessel spills, vessel operations, aircraft dumping, recreational marine vessels, vessels of less than 100 GT, and coastal facilities, PAH loadings were estimated as a fraction of the total petroleum hydrocarbon loadings, based on measured PAH content of crude oils and refined petroleum products (see Appendix J). Because coastal waters are undersaturated with dissolved PAH relative to the overlying atmosphere, there is a significant net transfer of atmospheric PAH to the oceans. PAH loadings from land-based sources were estimated by assuming that the PAH load from each river is proportional to the estimated petroleum hydrocarbon loading (see Chapter 3 and Appendix E for details). This refinement of the 1985 report Oil in the Sea is a step toward a more rigorous risk assessment of petroleum releases to the coastal oceans.
A significant effort was made to develop estimates of inputs by zone, both along shore regions and two zones offshore (a coastal zone that extended out to 3 miles and an offshore zone from 3-200 miles). This effort, to further delineate the geographic distribution of these inputs, is the second significant difference between the current study and the 1985 Oil in the Sea report, led to the subdivision of North American waters into 17 zones (Figure 2-3). These values were totaled to develop the first approximation of total inputs to the North American and world-wide marine environment listed in Table 2-2 (values reported in the “Regions” column). This regional approach allows the spatial distribution of the inputs to be used as a basis for evaluating the potential risks of the oil inputs to marine resources in each region (Fig. 2-4). It is clear that the ecological effects of oil inputs is a function of many factors, including oil type, release rates, fate processes, and distribution of biological resources. It is difficult to articulate in general terms how each of the input categories may affect marine resources because of the wide range of pathways of exposure, species sensitivity, and potential effects. Regional data may be of benefit to
regulators and resource managers, by helping to establish linkages between petroleum inputs and potential effects, leading to prioritized actions needed to reduce the most significant risks.
Natural Seeps
Natural seeps are the highest contributors of petroleum hydrocarbons to the marine environment (Figures 2-2A and 2-2B). Coastal seeps occur mainly in southeast Alaska where they are a minor source of petroleum introduced to the region during the reporting period (1990-1999).2 Offshore seeps are only known to occur in the northern and southern Gulf of Mexico, where they represent 95 percent of the total oil inputs to the offshore region, and southern California, where they represent 98 percent of oil inputs to the offshore zone. Considering the size of the inputs into these regions, and that the releases are composed primarily of unweathered crude oil, one would expect seeps to have a significant impact to marine resources in these areas. Yet, studies have shown that benthic communities have acclimated and even evolved to utilize some of the hydrocarbons (Spies et al., 1980; Spies and Desmaris, 1983; Montagna et al., 1986, 1989). The uncertainty in these estimates is large, complicating attempts to understand the potential risks to marine ecosystems. It is also uncertain whether the rates of release from seeps will decrease as the reservoirs are depleted over the next coming decades.
Crude oil released as seeps constitutes the single largest source of PAH input to the sea; however, these seeps most often occur in specific oil-production areas, and release rates are relatively low and chronic. As the relatively unweathered crude oil enters the ocean from the seabed, the soluble compounds dissolve and the volatile compounds volatilize, but much of the oil rises to the surface, forming slicks. For most crude oils, about one-third is lost by evaporation-volatilization in the first 24 hours. Intermediate-weight compounds can degrade by photooxidation and microbial processes over periods of weeks, and the residues form tarballs. Where seeps occur close to shore, such as in the Santa Barbara Channel off the coast of southern California, tar forms persistent deposits on the shoreline. Seeps are a significant contributor to the coastal PAH budget, adding 2.5 thousand metric tonnes, or one half of the estimated annual PAH loading (Table 2-4). Unlike much of the coastal waters, waters in areas dominated by seeps are likely enriched in dissolved PAH, and net volatilization of PAH occurs.
Petroleum seeps occur in many parts of the ocean and have served as natural experiments for understanding the relationship between chemical persistence and biological response among organisms comprising the seep community, including adaptive responses that have occurred over generations of exposure. As petroleum enters the ocean from the seabed, it is relatively unweathered and provides an energy source to microbial populations (Bauer et al., 1988; Spies et al., 1980; Spies and Desmaris, 1983; Montagna et al, 1986, 1989). This enrichment of the benthic environment by microbial turnover of organic material alters the benthic community by depleting local oxygen concentrations in addition to altering the hydrocarbon concentrations for exposure.
The most detailed investigations of petroleum seepages have been carried out in the Santa Barbara Channel off the coast of southern California. In heavy seepage areas, the benthic community has low diversity of a few species or invertebrates and is dominated by mats of sulfur-oxidizing bacteria (Beggiatoa) and a few species of invertebrates (Spies et al., 1980; Montagana et al., 1987, 1989, 1995). Pore-water concentrations of aromatic hydrocarbons within a few centimeters of an active seep were about 1 ppm. Within several meters of the very active seeps and where a small amount of seepage is still found, a diverse benthic community exists, similar in composition to benthic communities of the inner continental shelf in southern California with a few differences in species abundance (Spies, 1987). Natural biogeochemical tracers (13C, 14C, 35S) indicate that both the petroleum carbon, particularly the lighter fractions, and the sulfur from sulfide are incorporated into benthic meiofauna and macrofauna (Spies and DesMarais, 1983; Bauer et al., 1990). Therefore, even though the input from seeps is very large, ecological impacts appear to be limited in area, suggesting that the slow rate of release allows biota to acclimate to PAH and other toxic compounds in the releases.
Extraction of Petroleum
Historically, extraction of petroleum hydrocarbons has represented a significant source of spills and other releases of petroleum to the marine environment. The second largest marine spill event in the world was the IXTOC I blowout that released 476,000 tonnes of crude oil into the Gulf of Mexico in 1979. In the past decade, however, improved production technology and safety training of personnel have reduced significantly both blowouts and daily operational spills. Today, roughly 150 tonnes of petroleum hydrocarbons per year are discharged as accidental spills from platforms in North American waters (Table 2-2). Another source of petroleum hydrocarbon pollution in the extraction process is from produced waters. Presently, this is the largest source, approaching 2,700 tonnes per year into North American waters and 36,000 tonnes worldwide (Table 2-2). Although these amounts may seem high at first glance, these contributions represent less than 2 percent of the amount entering the marine environment from natural sources (Figures 2-5A and 5B).
|
2 |
As discussed in Chapter 3 and Appendix I, erosion of organic rich source rocks can yield petroleum-bearing sediment in locally significant amounts. However, this material is largely bound within sediment particles, thus suggesting it is largely not biologically available. |
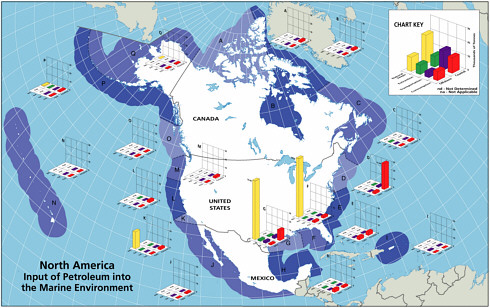
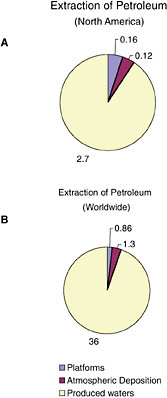
FIGURE 2-5 Relative average, annual input (1990-1999) of petroleum hydrocarbons (kilotonnes) to North American (A) and worldwide (B) marine environment from sources associated with petroleum extraction.
Inputs from oil and gas extraction are restricted to the coastal and offshore oil and gas production areas, namely the Gulf of Mexico, Alaska, southern California, and Canadian Maritimes (Fig. 2-6). Over 90 percent of the inputs from extraction activities are from produced water discharges (Fig. 2-5), which release low but continuous amounts of dissolved components and dispersed crude oil (Utvik, 1999). Because dilution and weathering are important mechanisms for reducing the concentrations of toxic components in produced water, the elimination of coastal discharges in most North American waters has significantly reduced the overall potential effects of these inputs. Similar discharges continue, however, in production fields of developing countries.
Spills (of mostly crude oil) from platforms comprise 5 percent of the total inputs from extraction activities. The amount of oil released into the coastal zone for the Canadian Maritimes, eastern Gulf of Mexico, and southeast Alaska are remarkably similar, ranging from 2.2 to 2.5 tonnes per year. Oil input from platform spills into California coastal waters is very low, at 0.4 tonnes per year. The highest amount of oil from platform spills is for the northwestern Gulf of Mexico, with inputs into coastal waters reaching 81 tonnes per year and representing 92 percent of the total amount of oil spilled from platforms into North American coastal waters. Spills into state waters are about twice the input from spills in offshore waters. Spills from platforms are generally small, averaging 3.5 tonnes (1,000 gallons), yet small spills can have significant impacts under some circumstances.
Extraction activities do not appear to be an important source of PAH. Less than 2 percent of the 5,000 tonnes of PAH entering the marine environment comes from petroleum extraction (Table 2-4). Extraction activities release about 0.07 thousand tonnes of PAH to marine waters in North America, with 74 percent associated with produced water discharges. Most of the remaining PAH inputs resulting from extraction activities are from atmospheric deposition.
Inputs from extraction of petroleum are composed primarily of components of crude oil, although they also include minor spills of refined products from equipment and vessel operations associated with oil platforms (see Chapter 3). The single largest input from extraction activities is from produced waters that contain the dissolved compounds (mostly single-ring aromatic hydrocarbons) and dispersed oil that cannot be separated from the water extracted with the oil from reservoirs (see Table 2-2). The dissolved compounds are also relatively volatile, so a significant fraction of the oil from produced water is removed rapidly by volatilization and evaporation, particularly when released to open, well-mixed waters. The finely dispersed oil droplets stay suspended in the water column and undergo microbial degradation or are sorbed onto suspended sediments that are then deposited on the seabed (Boesch and Rabalais, 1989a). Elevated levels of contaminants in sediments typically extend up to 300 m from the discharge point. Produced water discharges increase with reservoir age; thus these inputs may increase over time unless more produced water is re-injected or better treatment technologies are developed.
Except for very rare blowouts, spills from platforms are generally small and make landfall only when spilled close to shore or inshore. Impacts would be greatest in coastal or inland areas where numerous small spills result in chronic exposure during the life of the field. Oil production in coastal waters only occurs in Louisiana, Texas, and Alaska, although most of it is in Louisiana.
The environmental effects that may result from oil and gas production in a field depend greatly on the characteristics of the receiving environment (Rabalais et al., 1991a, Rabalais et al., 1992). Measurable effects are most likely in
shallow waters, areas of restricted flow and dispersion, water with a high concentration of suspended particulates, and fine-grained anaerobic sediments (Boesch and Rabalais, 1989 a,b; St. Pé, 1990). There are clear effects of produced water discharges on estuarine waters, sediments, and living resources in inshore production fields where the receiving environment is not conducive to the dispersion of the effluent plume. In the United States, studies of their effects (Boesch and Rabalais, 1989 a,b; St. Pé, 1990; Rabalais et al., 1991a) led to the prohibition of produced water discharges into coastal waters in the late 1990s. In shallow shelf waters, hydrocarbons from produced water accumulate in bottom sediments, and the diversity of benthic fauna may be reduced up to 300 m from the outfall (Rabalais et al., 1991a,b; also see Chapter 5; Table 5-7). Measurable effects occur around offshore platforms but, except for artificial reef effects (sedimentary changes or changes brought about by a cuttings pile), such effects are usually localized (Rabalais et al., 1993; Kennicutt et al., 1996a; Montagna and Harper, 1996). It is noted, however, that discharge of oil-based drill cuttings has never been permitted in the U.S. and was recently prohibited in the North Sea. Beyond some contamination of organisms by petroleum, there is little convincing evidence of significant effects from petroleum around offshore platforms. Where oil-based drill cuttings are discharged, there are more readily evident effects of sediment contamination and benthic impacts to much greater distances from the platforms (up to 1 to 2 km) (see Chapter 5). Although directed studies have identified some specific sublethal effects of long-term oil and gas development (Kennicutt et al., 1996a, b; Street and Montagna, 1996), the most significant unanswered questions remain those regarding the effects on ecosystems of long-term, chronic, low-level exposures resulting from discharges and spills caused by development activities. Unique features of deep-sea communities and the relative lack of understanding of these communities may make them more vulnerable to production activities. As the reservoirs age, the volume of produced water discharges from existing production facilities will significantly increase. The ecological impact of increasing rates of produced water discharge in both nearshore and new deep-water habitats is not clear. It will be important to consider these increases in future monitoring programs.
Another component of crude oil that is released during petroleum extraction consists of the VOC that occur as gases at ambient temperature and pressure, and thus escape to the atmosphere. Atmospheric deposition from extraction activities accounts for 4 percent of the total extraction-related inputs. Because VOC inputs are estimated using production volume, inputs are largest for the areas of highest oil and gas production. Inputs into coastal waters are about an order of magnitude lower than into offshore areas (see Table 2-2).
Only 0.2 percent of the VOC released to the atmosphere are estimated to be deposited into surface waters, when very conservative assumptions are used. This input is overwhelmed by hydrocarbon outgassing from the oceans. Therefore, impacts from VOC deposited at relatively low, uniform rates over large areas of ocean are likely to be small. Still, the fate and potential effects of VOC inputs to marine ecosystems are poorly understood; thus, there are unanswered questions about the concentrations and duration of VOC in the microlayer, the bioavailability of such volatile compounds, and their toxicity.
Transportation of Petroleum
The five major sources of petroleum hydrocarbon discharges into the marine waters by transportation activities include pipeline spills, tank vessel spills, operational discharges from cargo washings, coastal facilities spills, and gross atmospheric deposition of VOC releases from tankers (Table 2-2, Figures 2-7 and 2-8).
Pipelines
DeLuca and LeBlanc (1997) estimate that there are approximately 23,000 miles of pipelines that carry petroleum hydrocarbons in North America. Pipeline spills can occur as petroleum hydrocarbons are transported from the source to refineries and from refineries to the consumer (see Chapter 3 for greater details). The total input of petroleum hydrocarbons to the marine environment by spills from pipelines to North American waters is estimated to be 1,900 tonnes per year (Fig. 2-7).
The volume of crude oil spilled from pipelines in coastal areas is double that spilled in offshore areas, increasing the potential impacts because weathering and fate processes will not reduce the risks of exposure from such spills of crude oil (see Chapter 3). Accidental spills by pipelines are more common in coastal waters because production first occurred in the coastal regions and many of the pipelines are approaching 30–40 years old. It is highly probable that accidental spills from coastal pipelines will continue into the future as these pipelines age further unless steps are taken to ensure the integrity of this important system. The efforts of the Office of Pipeline Safety, under the Pipeline Integrity Management Program, are timely and appropriate for reducing these risks.
Tanker Spills
Because of numerous regulations and technology advances in vessel construction (i.e., double-hull tankers, new construction materials, and vessel design) spills from tank vessels have been reduced significantly during the past decade, even though the tanker fleet has increased by some 900 vessels to a total of 7,270 in 1999. Spills greater than 34 tonnes in size represent less than 1 percent of the spills by number but are responsible for more than 80 percent of the total spill volume (see Chapter 3 for greater details). In North American waters, vessel spills have been reduced consider
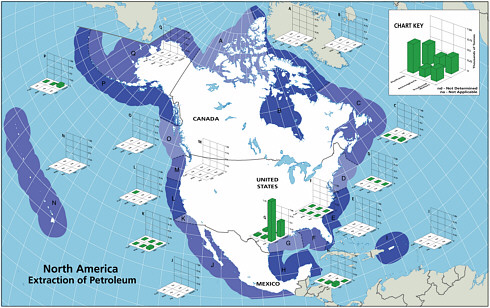
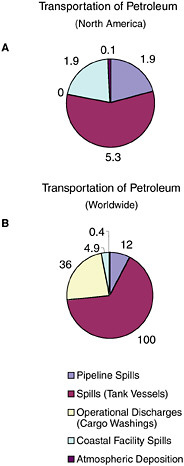
FIGURE 2-7 Relative average, annual input (1990-1999) of petroleum hydrocarbons (kilotonnes) to North American (A) and worldwide (B) marine environment from sources associated with the transport of petroleum.
ably over the past two decades and now account for only 5,300 tonnes per year, although they are still the dominant source from petroleum transportation activities (Figure 2-7). Tank vessel spills, globally, still discharge some 100,000 tonnes per year of petroleum hydrocarbons into marine waters, and they are the largest input from petroleum transportation worldwide (Table 2-2, Figure 2-7).
Operational Discharges (Cargo Washing)
Tank vessels are permitted discharges related to both cargo and propulsion machinery, whereas nontankers are permitted only machinery-related discharges. Operational discharges from cargo washing are illegal in North American waters. Because of rigorous enforcement and the likelihood that intentional discharges will be detected as spills, no petroleum inputs are estimated for North American waters. Worldwide, operational discharges resulting from cargo washings represent 36,000 tonnes per year (Table 2-2). Increased compliance with international regulations has reduced this amount significantly from past estimates.
Discharges of oil in ballast and tank washing from oil tankers are prohibited within 50 nautical miles of the coast, thus most of the oil inputs from operational tanker discharges occur at sea. These discharges can cause impacts where heavily trafficked shipping lanes pass close to sensitive resources.
Coastal Facilities
Spills from coastal facilities are primarily composed of refined products and account for an estimated 1,900 tonnes per year of petroleum hydrocarbons released to North American waters and 4,900 tonnes worldwide. Coastal pipelines that carry refined products and marine terminals account for 33 percent each of the total discharge. Because of their coastal location, these spills can have significant impacts from both episodic spills and chronic releases.
Atmospheric Deposition (Transportation-related)
Loss of VOC during loading, washing, and transport on tankers contributes the smallest amount of petroleum hydrocarbons to marine waters from transportation activities, both in North America and globally (Figure 2-7). Most of the VOC is methane that enters in the atmosphere and is not counted in the volume entering the sea.
Based on the PAH content of oils spilled and released during shipping, an estimated 170 metric tonnes of PAH are released by transportation. This value does not include combustion-derived PAH produced by ships’ power plants that are released to the atmosphere (these contribute to the atmospheric PAH inventory and are included in the atmospheric deposition loadings). PAH release from transportation is approximately 7 percent of the total PAH loading from anthropogenic sources to the North American coastal ocean (Table 2-4). Tank vessel spills account for 70 percent of transportation-related PAH discharges.
The distribution of transportation-related inputs reflects the regions where refinery production and coastal tanker traffic are highest. All of the petroleum inputs into North American waters are point-source spills from pipelines, tank vessels, and coastal facilities, with the exception of a small amount of atmospheric deposition (note that operational discharges from vessels are illegal; thus they are estimated to
be zero, with illegal discharges reported as spills). A wide range of crude oils and refined products are included in these inputs.
As with spills associated with extraction of petroleum, the impacts from transportation-related spills are very much linked to the spill conditions and location. The release of petroleum over short periods can have significant impacts, depending on the location, time of year, environmental conditions, and effectiveness of containment and recovery actions. Depending on the petroleum type, loss to the atmosphere due to evaporation and volatilization will account for 10 percent (for heavy fuels) to 80 percent (for light, refined products) of the spill volume. The inputs do not account for any oil removal during the response, although recovery of 20 percent of the spill volume is considered to be a good effort. Much has been learned in the last decade about the fate and effects of oil spills, yet many questions remain, particularly about sub-lethal effects associated with oil residues remaining once cleanup efforts have been terminated.
Consumption of Petroleum
Once petroleum hydrocarbons have been extracted, transported to refineries, and refined, they are delivered to the consumer. The six major sources of petroleum hydrocarbon releases to the marine environment include land-based sources (river discharge and runoff), two-stroke vessel discharge, non-tank vessel spills (≥100 GT), operational discharges (both ≥ 100 GT and < 100 GT), gross atmospheric deposition, and aircraft dumping. The volumes of oil and other petroleum products from spills or releases associated with consumption dwarf input from all other anthropogenic activities (Figure 2-2A and 2-2B). As mentioned earlier, North America consumes the vast majority of energy worldwide; thus, discharge of by-products from various energy uses remains high for North American waters.
Land-based Sources
Land-based river-runoff discharges are the largest anthropogenic source of petroleum hydrocarbon pollution in the marine environment, accounting for 54,000 tonnes per year in North American waters and 140,000 tonnes worldwide (Table 2-2, Figures 2-9 and 2-10). This input is quite significant because a high percentage is discharged directly into coastal and estuarine waters. Major sources include urban runoff, petroleum refinery wastewater, municipal wastewaters, and non-refining industrial wastes. As the population of coastal regions increase (Fig. 2-11), urban runoff has become more polluted by expansion in the numbers of cars, asphalt-covered highways and parking lots, municipal wastewater loads, and the use and improper disposal of petroleum products.
Recreational Marine Boating
During periods of economic growth in North America, the population spends larger sums of money on recreational marine craft and has more free time to use these small vessels. Recreational use of two-stroke engines in many outboard motors and personal watercraft (e.g., jet skis) has increased significantly during the past two decades. In 1990, heightened awareness of the large numbers and the design inefficiencies of these engines led the U.S. Environmental Protection Agency to begin regulating the “non-road engine” population under the authority of the Clean Air Act. Inputs from use of two-stroke engines in coastal waters are large in areas of high coastal populations. Discharges from two-stroke engines account for an estimated 5,600 tonnes per year into North American waters (data were insufficient for worldwide estimates; Table 2-2, Figure 2-9). The bulk of the input is gasoline, which is thought to rapidly evaporate and volatilize from the water surface. However, very little is known about the actual fate of the discharge. Questions regarding the amount of petroleum residing in the water column or along the surface for biologically significant lengths of time remain. Together, land-based runoff and discharges by two-stroke engines account for nearly 22 percent of the total petroleum released to the marine environment in North America by all sources (collectively, they represent nearly 64 percent of the total anthropogenic load). This is of particular concern because these discharges occur entirely in coastal environments.
Non-tank Vessels—Spills and Operational Discharges
Spills from non-tank vessels ≥100 GT represents a relatively small amount of discharge, contributing 1,200 tonnes per year in North America and 7,100 tonnes worldwide (Table 2-2). In contrast, non-tank vessel operational discharges are a major source of petroleum hydrocarbons delivered to global marine waters, which is estimated to be 270,000 tonnes and represents the second highest input of petroleum hydrocarbons into the marine environment (Table 2-2). These sources include machinery space bilge oil, fuel oil sludges, and oily ballast. The International Convention for Prevention of Pollution from Ships (MARPOL 73/78) regulates, worldwide, the design, construction, and operation of commercial vessels of 100 gross tonnes or more, with the goal of reducing or eliminating the discharge of oil and other pollutants into the sea. These regulations have significantly decreased the load, and in 1990, compliance with MARPOL 73/78 ranged from 80 to 99 percent (by class).
Atmospheric Deposition
VOC that enter the marine environment are generated primarily by sources such as internal combustion engines, power generating plants, industrial manufacturing facilities,
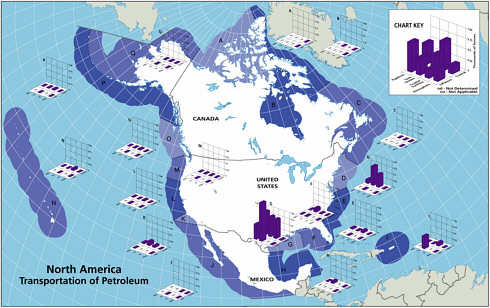
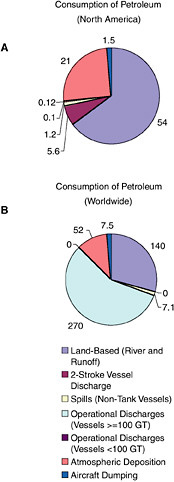
FIGURE 2-9 Relative average, annual input (1990-1999) of petroleum hydrocarbons (kilotonnes) to North American (A) and worldwide (B) marine environment from sources associated with the consumption of petroleum.
offshore facilities, and marine vessels. Because of their relatively high volatilities and low solubilities, only a small fraction (about 0.2 percent) of VOC released to the marine atmosphere are deposited on the ocean surface. It is estimated that total deposition of petroleum hydrocarbons resulting from VOC release is 21,000 tonnes per year into North American waters and 52,000 tonnes per year, worldwide. The inputs represent estimates of the wet and dry aerosol deposition and gas absorption. Although the net loadings of total petroleum hydrocarbons are negative, due to outgassing of the lighter weight fraction, it is important to note that this category contributes 10 percent of the PAH loadings to the sea. It is difficult to evaluate the impacts, however, because very little is known about the role that air-sea interactions play on the long-term fate of volatile petroleum hydrocarbons. It will be necessary to first obtain a better understanding of the likely concentrations before potential impacts can be evaluated.
Purposeful Jettisoning of Aircraft Fuel
With the expansion of aircraft travel during the past two decades, as well as international flights into and out of North America, the release of unexpended fuel over the coastal ocean has become an increasing source of petroleum hydrocarbons in the marine environment (Table 2-2). The two major sources of aircraft releases are deliberate discharge due to emergency conditions aboard the aircraft (emergency jettisoning) and normal operational releases including the release of partially burned fuel in inefficient engines or inefficient operating modes and the emptying of fuel injection bypass canisters. Modern aircraft have takeoff weights that exceed their landing weights, sometimes by as much as 150 tonnes. Emergency jettisoning of fuel is infrequent but not rare. Reporting such releases is required but is not enforced or monitored. To avoid jettisoning fuel over residential areas, most releases of this type occur over preassigned areas with little human habitation, commonly lakes or coastal waters offshore of coastal airports. It is estimated that 1,500 tonnes of petroleum per year are released over the marine environment in North America and 7,500 tonnes per year worldwide from this source.
Trends in Consumption-Related Inputs
The spatial distribution of consumption-related inputs into North American waters reflects the regions where refinery production and urban areas are highest, namely the northeast corridor, with 39 percent of the consumption-inputs, and the Gulf of Mexico with 16 percent of the consumption-related inputs (see Chapter 3). The distribution also reflects the dominance of land-based inputs into coastal waters.
Over half of the land-based inputs for North America are estimated to occur in the nearshore region between Maine and Virginia, a region rich in estuarine and coastal resources. Land-based sources are generally the largest single source of oil input to the sea for all coastal regions, except for regions with seeps, the Arctic, and the western Pacific. Yet, the long-term fate, bioavailability, and effects of land-based inputs are poorly understood. Assessment of potential impacts is further complicated by the co-occurrence of other contaminants, such as chlorinated hydrocarbons and metals.
Consumption of oil overwhelms all other sources of oil input into coastal waters. Even for offshore waters, consump
tion inputs dominate except where seeps occur. It should be noted that the estimates of inputs of the non-point sources have large uncertainties; thus these data indicate only the potential magnitude of the problem.
It is important to note that one of the greatest anthropogenic petroleum hydrocarbon marine polluters is the consumer. Of the total load of petroleum hydrocarbons discharged into the sea, natural seeps account for the largest load, nearly 61 percent of the total. Of the anthropogenic load, consumers account for nearly 90 percent of the discharge.
The resulting total estimated loading of PAH to the coastal ocean of North America from all sources is approximately 5,000 tonnes per year. One-half of the PAH loading comes from natural seeps, and atmospheric deposition and land-based sources account for 33 percent and 10 percent of the total PAH loading, respectively. When considering only anthropogenic sources, consumption-related activities contribute an estimated 92 percent of the PAH load. Extraction and transportation of petroleum contributes a relatively small amount of PAH to the marine environment, especially when compared to the contribution from consumption activities.
REGIONAL VARIABILITY IN INPUTS OF PETROLEUM AND THEIR SIGNIFICANCE
A major effort of the work on inputs for this report was the spatial allocation of the source loads into regions as well as into coastal and offshore waters. To highlight the differences among the sources by region, the five megaregions (i.e., the Canadian Arctic, the Atlantic coast, the Gulf of Mexico and Puerto Rico, the Pacific coast, and Alaska) are discussed in more detail.
Canadian Arctic
Inputs of petroleum hydrocarbons, in all forms, to the Canadian Arctic are extremely small. The total average annual calculated load to this area, from all sources, during the reporting period (1990-1999) was about 2,300 tonnes (or roughly 1 percent of the total load to North American waters, Table 2-5, Figure 2-12). The dominant source in the area is atmospheric deposition associated with the consumption of petroleum hydrocarbons worldwide. Spills are rare occurrences and are generally associated with tanker traffic in and around the Hudson Bay. Land-based sources make a relatively significant contribution to the coastal zone in areas where development has occurred.
The minimal level of human activity in the Canadian Arctic has resulted in relative small releases of petroleum hydrocarbons to the environment. However, as is discussed in Chapter 5, even a small release during periods of heightened biologic activity (mating, nesting, feeding) at an important site can have long-term impacts on sensitive species. Continued efforts to reduce spills of all types should be encouraged. In addition, the implications of high-latitude deposition of toxic compounds from diffuse land-based sources (whether transported by river or atmospheric processes) should be investigated.
Atlantic Seaboard of North America
The Atlantic seaboard extends from northern Canada to Florida. Table 2-6 and Figure 2-13 present the inputs for the Atlantic regions by source and location. It is very clear that consumption sources dominate the inputs and the region from Maine to Virginia has the greatest loads along the Atlantic coast. This one region has 54 percent of all the estimated land-based inputs for North America. It has the second highest inputs from recreational marine vessels. It also ranks third out of seventeen regions for inputs from tank vessel spills, with 38 percent of the inputs into coastal waters, and fourth in terms of facility spills, with nearly 30 percent of the coastal inputs. A large coastal population, high degree of urbanization, and high energy demand all contribute to these large inputs from both transportation and consumption sources. With little oil and gas production, inputs into offshore waters are dominated by atmospheric deposition. Aircraft dumping is another significant input into offshore waters along the Atlantic regions.
The elevated inputs of petroleum hydrocarbon as total petroleum hydrocarbons (TPH) and PAH, due to human activities in this portion of North America, and especially the load entering the coastal zone from land-based sources, suggest that the sensitive marine communities in these areas are at significant risk from chronic releases, as well as the long-term, sublethal exposure associated with them. The ultimate effect of this exposure remains an area of important scientific research, but greater understanding and monitoring of nonpoint sources of petroleum pollution is needed in these areas.
Gulf of Mexico and Puerto Rico
Inputs to the Gulf of Mexico and Puerto Rico are presented in Table 2-7 and Figure 2-14, and have a very different mix and loads of sources for coastal and offshore waters. Offshore, seeps dominate inputs in the Gulf of Mexico. For anthropogenic sources, the largest offshore source varies by region: around Puerto Rico and eastern Gulf of Mexico it is spills from tank vessels; in the western Gulf of Mexico it is produced water discharges followed closely by tank vessel spills; in Mexico, it is produced water. In coastal areas, once again land-based sources dominate in all regions. Despite including the Mississippi River discharge and a high concentration of coastal refineries, the western Gulf of Mexico received only 21 percent of the total inputs from land-based sources in North America. Transportation-related inputs to the western Gulf of Mexico were about 15-25 times greater than the other Gulf and Caribbean regions, and equally di
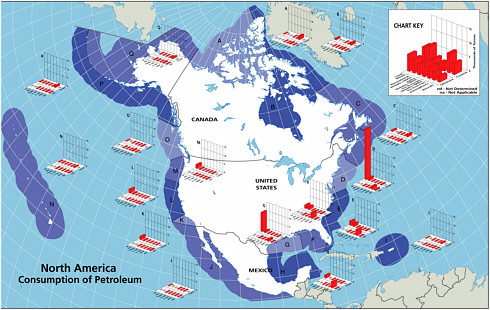
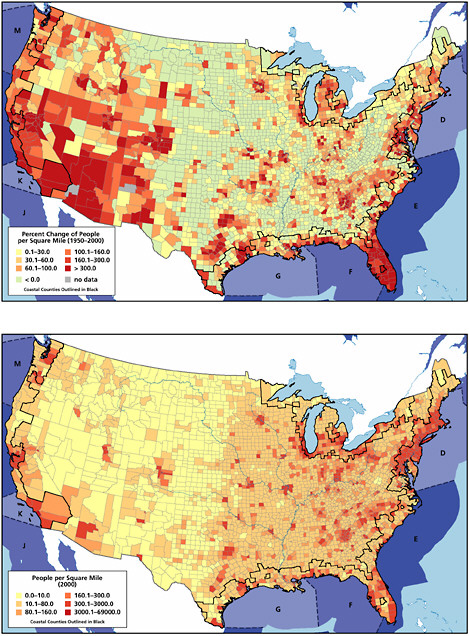
vided among coastal pipelines, tanker spills, and coastal facilities. These sources reflect the large petroleum industry of the region that involves all phases of oil and gas exploration, production, and transportation.
Spills from pipelines and tank vessels into the Western Gulf of Mexico release about 1,600 tonnes into both offshore and coastal areas, thus continued efforts by the transportation industries is needed to reduce the threat posed by such spills. In addition to the direct threat posed from spills, the elevated inputs of petroleum hydrocarbon (both as TPH and as PAH) due to human activities within the Mississippi River watershed and along the Gulf Coast, especially that load entering the coastal zone from land-based sources, suggests that sensitive marine communities in these areas are at a significant risk from chronic releases and the long-term, sublethal exposure associated with them. As discussed earlier, the ultimate effect of this exposure remains an area of important scientific research, but greater understanding and monitoring of nonpoint sources of petroleum pollution is needed in these areas.
Pacific Seaboard of North America and Hawaii
The total average annual input of petroleum hydrocarbons to the Pacific seaboard of North America (including Hawaii) on a regional basis, is relatively low. This area, the largest of the five discussed, receives roughly 31,000 tonnes of petroleum hydrocarbons from all sources each year (less than 10 percent on the total annual load to North American waters; Table 2-8, Figure 2-15). The dominant source of petroleum hydrocarbons to the coastal zone is from consumption related activities, and as expected, these loads show marked correlation to the distribution of human population and the degree of urbanization. In addition, the heavy use of recreational marine vessels in some regions results in substantial loads of petroleum hydrocarbons, accounting for nearly 50 percent of the calculated load for waters off California. Offshore, inputs are much smaller, with the significant exception of offshore Southern California. Here the extensive system of natural seeps off Coal Oil Point release approximately 20,000 tonnes of crude petroleum to the marine environment each year (accounting for nearly two thirds of the total load received by coastal and offshore waters of the Pacific seaboard, including Hawaii).
The load from consumption-related activities to coastal waters off more densely populated coastal regions of western North America may represent a significant risk to natural resources in these areas, depending on local oceanographic conditions (see Chapter 4) and the nature of the biota. This risk may be even more significant if these ecosystems should prove sensitive to chronic exposure to certain toxins found in petroleum hydrocarbons (such as PAH; see Chapter 5). Spills, although infrequent compared to some regions, can still be significant, especially if they occur at important periods of biologic activity or in particularly important locations.
TABLE 2-5 Average Annual Input (1990-1999) of Petroleum Hydrocarbons (tonnes) for the Canadian Arctic
|
ZONE (Coastal) |
|
A |
B |
|
Sum Seepsa |
|
na |
na |
|
|
Platforms |
na |
na |
|
|
Atmospheric |
na |
na |
|
|
Produced |
na |
na |
|
Sum Extractionb |
|
na |
na |
|
|
Pipelines |
na |
na |
|
|
Tank vessel |
na |
tracec |
|
|
Coastal facilities |
na |
na |
|
|
Atmosphericd |
trace |
trace |
|
Sum Transportation |
trace |
trace |
|
|
|
Land-based |
tracee |
660 |
|
|
Recreational vessels |
ndf |
nd |
|
|
Vessels >100GT (spills) |
0g |
0 |
|
|
Vessel >100GT (op discharge) |
trace |
trace |
|
|
Vessel <100GT (op discharge) |
trace |
trace |
|
|
Atmospheric |
2000 |
1300 |
|
|
Aircrafth |
na |
na |
|
Sum Consumption |
2000 |
2000 |
|
|
ZONE (Offshore) |
|
A |
B |
|
Sum Seepsa |
|
na |
na |
|
|
Platforms |
na |
na |
|
|
Atmospheric |
na |
na |
|
|
Produced |
na |
na |
|
Sum Extraction |
|
na |
na |
|
|
Pipelines |
na |
na |
|
|
Tank vessel |
na |
na |
|
|
Atmosphericd |
trace |
trace |
|
Sum Transportationb |
trace |
trace |
|
|
|
Land-basedi |
na |
na |
|
|
Recreational vesselsj |
na |
na |
|
|
Vessels >100GT (spills) |
na |
trace |
|
|
Vessel >100GT (op discharge) |
trace |
trace |
|
|
Vessel <100GT (op discharge) |
trace |
trace |
|
|
Atmospheric |
220 |
230 |
|
|
Aircraft |
20 |
50 |
|
Sum Consumption |
240 |
270 |
|
|
Grand Total |
2300 |
2300 |
|
|
Sum of Anthropogenic |
2300 |
2300 |
|
|
aNo known seeps in these regions bNo known oil and gas production in these regions cEstimated loads of less than 10 tonnes per year reported as “trace” dSmall number of tankers carrying fuel to coastal areas assumed ePristine waters in this region assumed to carry some fraction of petroleum bearing sediment eroded from exposed sources rocks (see Chapter 3 and Appendix I) fPopulations of recreational vessels were not available for these regions (see Chapter 3 and Appendix F) gNo spills from vessels greater than 100 GT were reported in these regions for the reporting period (see Chapter 3 and Appendix E) hPurposeful jettisoning of fuel not allowed within 3 nmiles of land (see Chapter 3 and Appendix E) iLand-based inputs are defined in this study as being limited to the coastal zone (see Chapter 3 and Appendix I) jRecreational vessels are defined in this study as being limited to operations within 3 miles of the coast (see Chapter 3 and Appendix F) |
|||
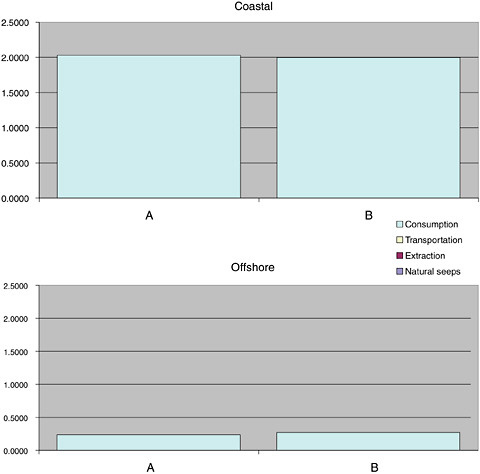
FIGURE 2-12 Average, annual input (1990-1999) of petroleum hydrocarbons (kilotonnes) for the Canadian Arctic.
Effort to reduce the frequency and size of such spills should continue to be undertaken.
Alaska
Alaska was divided into two regions, divided by the Aleutian Islands. Inputs to these regions are presented in Table 2-9 and Figure 2-16, showing dramatically different sources and loads for coastal and offshore waters. Surprisingly, aircraft dumping is estimated to be one of the largest sources of oil into offshore areas, and inputs from spills from non-tank vessels are small but one-two orders of magnitude greater than spills from tankers. In coastal waters, seeps in south-central Alaska are responsible for over 40 percent of the calculated inputs3 during the reporting period (1990-1999; Table 2-9).
|
3 |
As discussed in Chapter 3 and Appendix I, erosion of organic rich source rocks can yield petroleum-bearing sediment in locally significant amounts. However, this material is largely bound within sediment particles, thus suggesting it is largely not biologically available. |
TABLE 2-6 Average Annual Input (1990-1999) of Petroleum Hydrocarbons (tonnes) for Atlantic Seaboard of North America
|
ZONE (Coastal) |
C |
D |
E |
|
Sum Seepsa |
na |
na |
na |
|
Platforms |
ndb |
tracec |
na |
|
Atmospheric |
ndb |
trace |
na |
|
Produced |
ndb |
trace |
na |
|
Sum Extraction |
ndb |
trace |
nad |
|
Pipelines |
0 |
150 |
36 |
|
Tank vessel |
0 |
740 |
14 |
|
Coastal facilities |
trace |
500 |
79 |
|
Atmospheric |
trace |
trace |
trace |
|
Sum Transportation |
11 |
1400 |
130 |
|
Land-based |
500 |
29000 |
2500 |
|
Recreational vessels |
nd |
1500 |
1600 |
|
Vessels >100GT (spills) |
trace |
88 |
22 |
|
Vessel >100GT (op discharge) |
trace |
trace |
trace |
|
Vessel <100GT (op discharge) |
trace |
19 |
trace |
|
Atmospheric |
93 |
160 |
120 |
|
Aircrafte |
na |
na |
na |
|
Sum Consumption |
1400 |
31000 |
4200 |
|
ZONE (Offshore) |
C |
D |
E |
|
Sum Seeps |
na |
na |
na |
|
Platforms |
28a |
na |
na |
|
Atmospheric |
trace |
na |
na |
|
Produced |
62 |
na |
na |
|
Sum Extraction |
90 |
nad |
nad |
|
Pipelines |
na |
na |
na |
|
Tank vessel |
na |
17 |
trace |
|
Atmospheric |
tracef |
trace |
trace |
|
Sum Transportation |
trace |
19 |
trace |
|
Land-basedg |
na |
na |
na |
|
Recreational vesselsh |
na |
na |
na |
|
Vessels >100GT (spills) |
trace |
trace |
40 |
|
Vessel >100GT (op discharge) |
trace |
17 |
trace |
|
Vessel <100GT (op discharge) |
trace |
trace |
trace |
|
Atmospheric |
160 |
1700 |
3500 |
|
Aircraft |
120 |
525 |
90 |
|
Sum Consumption |
290 |
2300 |
3600 |
|
Grand Total |
1800 |
34000 |
8000 |
|
Sum of Anthropogenic |
1800 |
34000 |
8000 |
|
aNo known seeps in these regions bAll oil production is offshore; so, it is assumed that all releases are to offshore waters. cEstimated loads of less than 10 tonnes per year reported as “trace” dNo known oil and gas production in this region. ePurposeful jettisoning of fuel not allowed within 3 nmiles of land (see Chapter 3 and Appendix F) fSmall number of tankers carrying fuel to coastal areas assumed gLand-based inputs are defined in this study as being limited to the coastal zone (see Chapter 3 and Appendix I) hRecreational vessels are defined in this study as being limited to operations within 3 miles of the coast (see Chapter 3 and Appendix F) |
|||
Alaska represents a unique challenge to understanding petroleum hydrocarbons in the marine environment. Anthropogenic sources of petroleum hydrocarbons are dominated by spills occurring during the extraction or transportation of petroleum. Unlike regions that have undergone a greater degree of urbanization, low-level, chronic releases of petroleum are not significant in Alaska, thus the erosion of petroleum-bearing rock can be significant at a local scale. Conversely, the ecosystems in the coastal and offshore areas of Alaska have had no need to adapt to elevated concentrations of petroleum hydrocarbon and may, therefore, be even more sensitive to future exposures. Continued efforts by the extraction and transportation industries to minimize the potential for spills will be a key component to ensure the health of natural resources in this area.
SUMMARY OF MAJOR FINDINGS AND RECOMMENDATIONS
In addition to the general conclusions discussed above, several specific actions have to be taken to address the issues raised in this report (see Chapters 3, 4, and 5 for greater detail). This study was largely funded by U.S. entities, especially federal agencies. Many of the following recommendations are therefore focused on actions that can be taken by the United States. This does not mean, however, that they are not broadly applicable to the international community. On the contrary, both individual nations and groups of nations should consider how these recommendations could be implemented worldwide.
Inputs
Diffuse sources (natural seeps and runoff from land-based sources) are responsible for the majority of petroleum hydrocarbon inputs into North American waters, with contributions of 61 percent and 21 percent, respectively. In contrast, discharges from extraction and marine transportation of petroleum are responsible for less than 3 percent of the hydrocarbon inputs. Natural seeps represent the largest single petroleum hydrocarbon input but there is a great range in the uncertainty estimation. Federal agencies especially the U.S. Geological Survey (USGS), the Minerals Management Service (MMS), and the National Oceanic and Atmospheric Administration (NOAA) should work to develop more accurate techniques for estimating inputs from natural seeps, especially those adjacent to sensitive habitats. Likely techniques will include remote sensing and ground truthing. This will aid in distinguishing the effects of natural processes from those of anthropogenic activities. Urban runoff and recreational boating require attention because the spills are chronic and often occur in sensitive ecosystems. For example, the range of uncertainty in estimates of land-based petroleum hydrocarbons is four orders
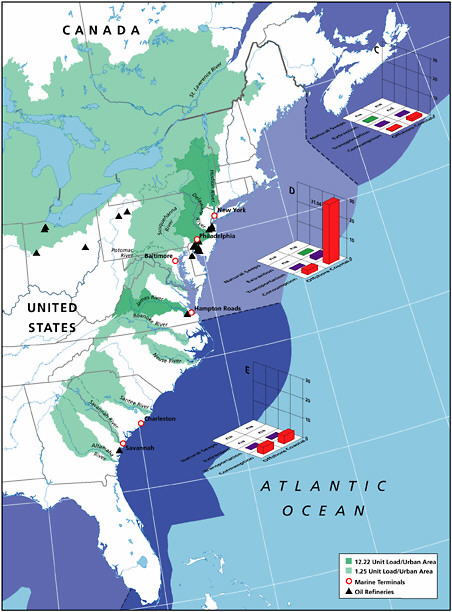
TABLE 2-7 Average Annual Input (1990-1999) of Petroleum Hydrocarbons (tonnes) for the Gulf of Mexico and Puerto Rico
|
ZONE (Coastal) |
F |
G |
H |
I |
|
Sum Seepsa |
na |
na |
na |
na |
|
Platforms |
traceb |
90 |
ndc |
na |
|
Atmospheric |
trace |
trace |
ndc |
na |
|
Produced |
trace |
590 |
trace |
na |
|
Sum Extraction |
trace |
680 |
tracec |
nad |
|
Pipelines |
trace |
890 |
trace |
trace |
|
Tank vessel |
140 |
770 |
80 |
trace |
|
Coastal facilities |
10 |
740 |
nde |
130 |
|
Atmospheric |
trace |
trace |
trace |
trace |
|
Sum Transportation |
160 |
2400 |
90 |
130 |
|
Land-based |
1600 |
11000 |
1600 |
tracef |
|
Recreational vessels |
770 |
770 |
ndg |
ndg |
|
Vessels >100GT (spills) |
30 |
100 |
trace |
trace |
|
Vessel >100GT (op discharge) |
trace |
trace |
trace |
trace |
|
Vessel <100GT (op discharge) |
trace |
trace |
trace |
trace |
|
Atmospheric |
60 |
90 |
100 |
50 |
|
Aircrafth |
na |
na |
na |
na |
|
Sum Consumption |
2500 |
12000 |
1700 |
50 |
|
ZONE (Offshore) |
F |
G |
H |
I |
|
Sum Seeps |
70000 |
70000 |
naa |
naa |
|
Platforms |
trace |
50 |
61c |
na |
|
Atmospheric |
trace |
60 |
40 |
na |
|
Produced |
trace |
1700 |
130 |
na |
|
Sum Extraction |
trace |
1800 |
231 |
nad |
|
Pipelines |
trace |
60 |
ndi |
na |
|
Tank vessel |
10 |
1500 |
ndi |
490 |
|
Atmospheric |
trace |
trace |
trace |
trace |
|
Sum Transportation |
10 |
1600 |
trace |
490 |
|
Land-basedj |
na |
na |
na |
na |
|
Recreational vesselsk |
na |
na |
na |
na |
|
Vessels >100GT (spills) |
70 |
120 |
trace |
10 |
|
Vessel >100GT (op discharge) |
trace |
25 |
trace |
trace |
|
Vessel <100GT (op discharge) |
trace |
trace |
trace |
trace |
|
Atmospheric |
1600 |
1200 |
3600 |
70 |
|
Aircraft |
80 |
80 |
20 |
20 |
|
Sum Consumption |
1800 |
1400 |
3600 |
100 |
|
Grand Total |
74000 |
91000 |
5600 |
790 |
|
Sum of Anthropogenic |
4400 |
21000 |
5600 |
790 |
|
aNo known seeps in these regions bEstimated loads of less than 10 tonnes per year reported as “trace” cLack of precise locations for platforms in this zone precluded determining whether spills or other releases occurred less than 3 nmiles from shore (see Chapter 3 and Appendix D). Thus, all values for this zone reported as “offshore.” dNo known oil and gas production in this region eNo information on the existence of coastal facilities was available for this region (see Chapter 3 and Appendix G). fInsufficient water quality data exist to calculate input in this region, but existence of some urban landscape suggests it is a non-zero number (see Chapter 3 and Appendix I). gPopulations of recreational vessels were not available for these regions (see Chapter 3 and Appendix F) hPurposeful jettisoning of fuel not allowed within 3 nmiles of land (see Chapter 3 and Appendix E) iNo information on transportation-related spills was available for this region (see Chapter 3 and Appendixes D, E, and G) jLand-based inputs are defined in this study as being limited to the coastal zone (see Chapter 3 and Appendix I) kRecreational vessels are defined in this study as being limited to operations within 3 miles of the coast (see Chapter 3 and Appendix F)1 |
||||
of magnitude, and the upper limit, if reasonable, would dominate all other inputs. This uncertainty reflects a variety of limitations, including a lack of adequate background data. To refine estimates associated with non-point sources, Federal agencies, especially EPA and the USGS, should work with state and local authorities to routinely collect and share data on the concentration of petroleum hydrocarbons in major river outflows and harbors in storm-and wastewater streams.
The estimates presented here demonstrate the important role of air-sea exchange of hydrocarbons in (1) the persistence of petroleum hydrocarbons in surface waters and (2) the potential degradation of coastal air quality. These estimates are limited both by the lack of detailed field measurements of hydrocarbons in seawater and the coastal atmosphere under a variety of conditions and by the relatively poor knowledge of the fundamental physics of air-sea exchange. Directed research is needed that (1) conducts specific coupled field studies of air-sea interaction and (2) applies these studies to the modeling of petroleum hydrocarbon exchange at regional and global scales. On-going and growing investigations of air-sea exchange of carbon dioxide, conducted to better understand global climate change, provide a significant opportunity to improve the estimates of petroleum hydrocarbon exchange between the atmosphere and the surface ocean.
During 1990-1999, spillage from vessels in U.S. waters was less than 40 percent of that during the prior decade, and it now represents less than 2 percent of the petroleum hydrocarbon inputs into North American waters. Significant reductions in spillage were also realized worldwide. Improvements in vessel operation and design and the introduction of related federal and international regulations contributed to this decline in oil spills. In U.S. marine waters, the largest spills come from vessels, followed by pipelines and facilities. Vessels have produced 109 spills of greater than 34 tonnes (10,000 gallons) in size since 1990, and these larger spills had an average size of about 400 tonnes. During the 1990s, tanker vessels were responsible for about 89 percent of the spillage from vessels. The comprehensive port control regime, administered by the U.S. Coast Guard, cooperative programs with ship owners and the boating community, and active participation of the International Maritime Organization in developing effective international regulatory standards have contributed to the decline in oil spills and operational discharges. These efforts and relationships should be continued and further strengthened where appropriate.
Estimated operational discharges from vessels contribute very significant inputs. More than 99 percent of the estimated volume of operational discharge is related to non-compliance, because existing regulations restrict operational discharges of oil or limit them to not more than 15 ppm. The extent of non-compliance is difficult to assess, and therefore these estimates have a high level of uncertainty. Federal
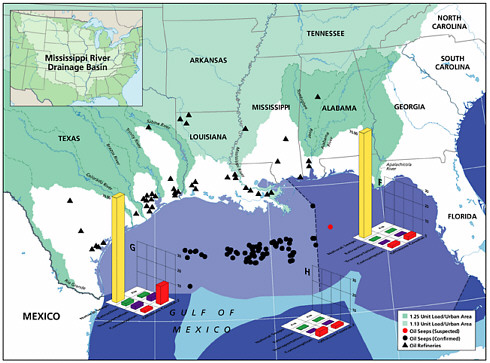
TABLE 2-8 Average Annual Input (1990-1999) of Petroleum Hydrocarbons (tonnes) for the Pacific Seaboard of North America (plus Hawaii)
|
ZONE (Coastal) |
J |
K |
L |
M |
N |
O |
|
Sum Seepsa |
na |
na |
na |
na |
na |
na |
|
Platforms |
na |
traceb |
trace |
na |
na |
na |
|
Atmospheric |
na |
trace |
na |
na |
na |
na |
|
Produced |
na |
trace |
na |
na |
na |
na |
|
Sum Extraction |
nac |
trace |
trace |
nac |
nac |
nac |
|
Pipelines |
ndd |
39 |
trace |
trace |
trace |
0 |
|
Tank vessel |
nd |
150 |
trace |
10 |
trace |
0 |
|
Coastal facilities |
trace |
62 |
26 |
10 |
31 |
69 |
|
Atmospheric |
trace |
trace |
trace |
trace |
trace |
trace |
|
Sum Transportation |
trace |
250 |
35 |
23 |
42 |
73 |
|
Land-based |
860 |
1900 |
2300 |
1600 |
29 |
65 |
|
Recreational vessels |
nde |
280 |
320 |
1600 |
36 |
nd |
|
Vessels >100GT (spills) |
ndf |
28 |
trace |
35 |
26 |
trace |
|
Vessel >100GT (op discharge) |
trace |
trace |
trace |
trace |
trace |
trace |
|
Vessel <100GT (op discharge) |
trace |
trace |
trace |
trace |
trace |
trace |
|
Atmospheric |
420 |
14 |
44 |
120 |
150 |
280 |
|
Aircraftg |
na |
na |
na |
na |
na |
na |
|
Sum Consumption |
1300 |
2200 |
2700 |
3400 |
240 |
350 |
|
ZONE (Offshore) |
J |
K |
L |
M |
N |
O |
|
Sum Seeps |
na |
20000 |
na |
na |
na |
na |
|
Platforms |
na |
trace |
na |
na |
na |
na |
|
Atmospheric |
na |
trace |
na |
na |
na |
na |
|
Produced |
na |
85 |
na |
na |
na |
na |
|
Sum Extraction |
nac |
92 |
nac |
nac |
nac |
nac |
|
Pipelines |
ndh |
trace |
0 |
0 |
0 |
0 |
|
Tank vessel |
trace |
0 |
12 |
trace |
trace |
0 |
|
Atmospheric |
trace |
trace |
trace |
trace |
trace |
trace |
|
Sum Transportation |
trace |
trace |
12 |
trace |
trace |
trace |
|
Land-basedi |
na |
na |
na |
na |
na |
na |
|
Recreational vesselsj |
na |
na |
na |
na |
na |
na |
|
Vessels >100GT (spills) |
trace |
trace |
16 |
13 |
87 |
52 |
|
Vessel >100GT (op discharge) |
trace |
trace |
trace |
trace |
trace |
trace |
|
Vessel <100GT (op discharge) |
trace |
trace |
trace |
trace |
trace |
trace |
|
Atmospheric |
140 |
na |
40 |
33 |
390 |
38 |
|
Aircraft |
15 |
230 |
75 |
30 |
45 |
75 |
|
Sum Consumption |
160 |
240 |
130 |
82 |
520 |
170 |
|
Grand Total |
1500 |
23000 |
2800 |
3500 |
700 |
590 |
|
Sum of Anthropogenic |
1500 |
2100 |
2800 |
2100 |
700 |
590 |
|
aNo known seeps in these regions bEstimated loads of less than 10 tonnes per year reported as “trace” cNo known oil and gas production in this region dNo information on transportation-related spills was available for this region (see Chapter 3 and Appendixes D, E, and G) ePopulations of recreational vessels were not available for these regions (see Chapter 3 and Appendix F) fInsufficient information on spills from cargo vessels was available for this region (see Chapter 3 and Appendix E) gPurposeful jettisoning of fuel not allowed within 3 nmiles of land (see Chapter 3 and Appendix E) hInsufficient information on spills from pipelines was available for this region (see Chapter 3 and Appendix E) iLand-based inputs are defined in this study as being limited to the coastal zone (see Chapter 3 and Appendix I) jRecreational vessels are defined in this study as being limited to operations within 3 nmiles of the coast (see Chapter 3 and Appendix F) |
||||||
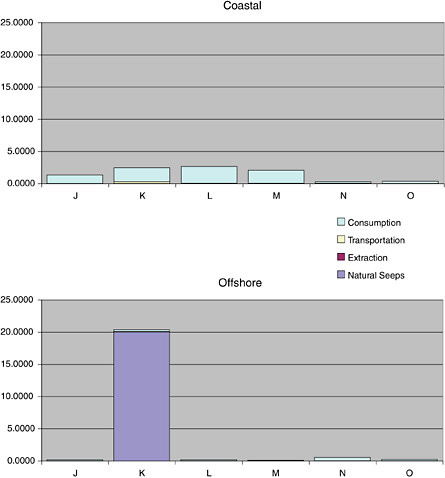
FIGURE 2-15 Average, annual input (1990-1999) of petroleum hydrocarbons (kilotonnes) for the Pacific Seaboard of North America (plus Hawaii).
agencies, especially the U.S. Coast Guard, should work with the transportation industry to undertake a systematic assessment of the extent of noncompliance. If the estimates of noncompliance assumed in this report are essentially correct, more rigorous monitoring and enforcement policies should be developed and implemented.
Gasoline and lube oil inputs from two-stroke recreational vessels are a large marine source of petroleum hydrocarbons. These discharges are primarily gasoline and lube oil, which have high evaporation rates and low PAH levels. However, these inputs frequently occur near ecologically sensitive areas (estuaries, mangroves) during vulnerable stages in the life cycle of organisms. Federal agencies, especially the EPA, should continue efforts to regulate and encourage the phase-out of inefficient two-stroke engines, and a coordinated enforcement policy should be established.
Large quantities of VOC are discharged into the atmosphere from tank vessels and oil and gas operations. How
TABLE 2-9 Average Annual Input (1990-1999) of Petroleum Hydrocarbons (tonnes) for the Coastal and Territorial Waters of Alaska
|
ZONE (Coastal) |
P |
Q |
|
Sum Seeps |
400 |
tracea |
|
Platforms |
trace |
na |
|
Atmospheric |
trace |
na |
|
Produced |
110 |
na |
|
Sum Extraction |
120 |
nab |
|
Pipelines |
trace |
nac |
|
Tank vessel |
20 |
trace |
|
Coastal facilities |
30 |
10 |
|
Atmospheric |
trace |
trace |
|
Sum Transportation |
60 |
20 |
|
Land-based |
80 |
traced |
|
Recreational vessels |
50 |
20 |
|
Vessels >100GT (spills) |
70 |
trace |
|
Vessel >100GT (Op Discharge) |
trace |
trace |
|
Vessel <100GT (Op Discharge) |
trace |
trace |
|
Atmospheric |
890 |
580 |
|
Aircrafte |
na |
na |
|
Sum Consumption |
110 |
600 |
|
ZONE (Offshore) |
P |
Q |
|
Sum Seeps |
na |
na |
|
Platforms |
na |
na |
|
Atmospheric |
na |
na |
|
Produced |
na |
na |
|
Sum Extractionb |
na |
na |
|
Pipelinesc |
na |
na |
|
Tank vessel |
trace |
trace |
|
Atmospheric |
trace |
trace |
|
Sum Transportation |
trace |
trace |
|
Land-basedf |
na |
na |
|
Recreational vesselsg |
na |
na |
|
Vessels >100GT (spills) |
30 |
50 |
|
Vessel >100GT (Op Discharge) |
trace |
trace |
|
Vessel <100GT (Op Discharge) |
trace |
trace |
|
Atmospheric |
210 |
220 |
|
Aircraft |
45 |
15 |
|
Sum Consumption |
290 |
300 |
|
Grand Total |
980 |
910 |
|
Sum of Anthropogenic |
580 |
910 |
|
aEstimated loads of less than 10 tonnes per year reported as “trace” bNo known oil and gas production in this region (North Slope production is limited to terrestrial fields) cNo known coastal or offshore pipelines in this region (North Slope production is limited to terrestrial fields) dLoad in this region limited to petroleum hydrocarbons derived from eroded source rocks (see Chapter 3 and Appendix I) ePurposeful jettisoning of fuel not allowed within 3 nmiles of land (see Chapter 3 and Appendix E) fLand-based inputs are defined in this study as being limited to the coastal zone (see Chapter 3 and Appendix I) gRecreational vessels are defined in this study as being limited to operations within 3 nmiles of the coast (see Chapter 3 and Appendix F) |
||
ever, the VOC consist mostly of methane and ethane, which tend to oxidize rather than deposit in the oceans. These emissions may represent a “greenhouse gas” concern, but their atmospheric deposition into North American waters is less than 0.5 percent of all inputs, and inputs of VOC into the oceans worldwide are less than 4 percent of the estimated total. The U.S. Coast Guard should work with the International Maritime Organization to assess the overall impact on air quality of VOC from tank vessels and establish design and/or operational standards on VOC emissions where appropriate.
On the basis of limited data, aircraft inputs from deliberate dumping of jet fuel in the sea appear to be locally significant. Federal agencies, especially the Federal Aeronautics Administration (FAA), should work with industry to more rigorously determine the amount of fuel dumping by aircraft and to formulate appropriate actions to limit this potential threat to the marine environment.
Fates
The effect of petroleum hydrocarbon is not directly related to the volume released. It is instead a complex function of the rate of release, the nature of the released hydrocarbon, and the local physical and biological ecosystem. Some progress has been made in understanding the basic processes affecting fates such as evaporation. Much more needs to be learned about oil-sediment interaction, vertical dispersion and entrainment, dissolution, Langmuir cells, and hydrate formation (as related to deep subsurface releases of gas). Furthermore, the priorities for research into petroleum hydrocarbon fate and transport have historically been driven by large spills. Thus, resource allocation to support these efforts tends to wane in periods during which a large spill has not recently occurred. Federal agencies, especially NOAA, MMS, the U.S. Coast Guard, and the USGS, should work with industry to develop and support a systematic and sustained research effort to further basic understanding of the processes that govern the fate and transport of petroleum hydrocarbons released into the marine environment from a variety of sources (not just spills).
Response plans depend heavily on site-specific modeling predictions of the behavior of spills of various sizes and types, under a variety of environmental conditions. There is a need for both better baseline data, including ambient background levels of hydrocarbons in the sea, and better data for calibrating fate and behavior models. Because experimental release of petroleum is not feasible under most circumstances, comprehensive data on the fate of the oil must be collected during spills. Such efforts are generally neglected, because moving needed equipment and personnel to spill sites to collect data is of lower priority than containing the spill and minimizing damage to the environment and property. Federal agencies, especially the U.S. Coast Guard,
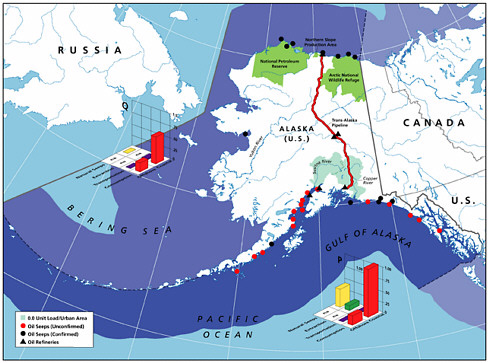
FIGURE 2-16 Average, annual input (1990-1999) of petroleum hydrocarbons (kilotonnes) for the coastal and territorial waters of Alaska. (Additional information provided by Alaska GIS Data Clearinghouse, Alaska Department of Natural Resources Division of Oil and Gas, EIA, EPA, and the U.S. Bureau of Land Management, Alaska.)
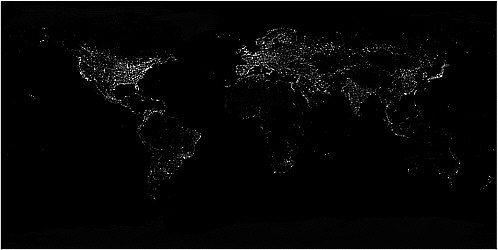
PHOTO 5 The brightest areas of the Earth are the most urbanized, but not necessarily the most populated. (Compare western Europe with China and India.) Cities tend to grow along coastlines and transportation networks. (Image courtesy of NASA.)
NOAA, and EPA should work with industry to develop a more comprehensive database of environmental information and ambient hydrocarbon levels, and should develop and implement a rapid response system to collect in situ information about spill behavior and impacts.
Natural seep systems and sites of historical spills offer good opportunities for field studies of the fate and effect of the release of crude oil and (in the case of spills) refined products, especially to understand dissolution and long-term weathering. Federal agencies, especially the USGS, NOAA, EPA, and MMS, should develop and support targeted research into the fate and behavior of hydrocarbons released to the environment naturally through seeps or past spills.
Effects
Ecosystems and their components vary at time scales ranging from seasons to decades and longer. Therefore, in the absence of ongoing monitoring, it is exceedingly difficult to quantify the effects of oil in the sea, or to establish when recovery from a pollution event is complete. The establishment of monitoring programs in selected regions with an elevated risk of petroleum spills or discharges would enhance the ability to determine effects and recovery and to understand the processes controlling ecosystem responses to pollution. Existing databases on the distribution, frequency, and size of petroleum spills and existing petroleum distribution routes could be used to identify locations most appropriate for monitoring. Federal agencies, especially the USGS and EPA, should work with state and local authorities to establish or expand efforts to monitor vulnerable components of ecosystems likely to be exposed to petroleum releases.
The inputs and long-term fate of land-based sources (due both to runoff and to atmospheric deposition) are poorly understood. The range of uncertainty of land-based runoff of petroleum hydrocarbons is four orders of magnitude. The upper limit, if correct, would dwarf all other inputs. The loads from rivers and air inputs are not being monitored consistently, and the background inputs from rivers are virtually unknown. To assess the impacts attributable to different sources including oil spills and non-point sources, federal agencies, especially the USGS and EPA should work with state and local authorities to undertake regular monitoring of Total Petroleum Hydrocarbon (TPH) and PAH inputs from air and water (especially rivers and harbors) to determine background concentrations.
There are demonstrable effects of acute oiling events at both small and large spatial scales. These effects result from physical fouling of organisms and physiological responses to the toxic components of oil. Although there is now considerable information on the toxicological effects of individual components of oil, there is a lack of information about the synergistic interactions in organisms between hydrocarbons and other classes of pollutants. This problem is particu
larly acute in areas subject to chronic pollution, (e.g., urban runoff). Research on the cumulative effects of multiple types of hydrocarbons in combination with other types of pollutants is needed to assess toxicity and organism response under conditions experienced by organisms in polluted coastal zones. Federal agencies, especially the USGS, MMS, NOAA, and EPA, should work with industry to develop or expand research efforts to understand the cumulative effects on marine organisms. Furthermore, such research efforts should also address the fates and effects of those fractions that are known or suspected to be toxic in geographic regions where their rate of input is high.
There are demonstrable sublethal physiological effects of long-term, chronic releases of hydrocarbons into the marine environment. These have been found in areas affected by urban runoff, in areas where oil has been incorporated in sediments and then released back to the water column, and in production fields. Chronic sources of hydrocarbon pollution remain a concern, and their effects on populations and ecosystems require further assessment. Federal agencies, especially the USGS, EPA, and NOAA, should work with state and local authorities and industry to implement comprehensive laboratory and field based investigations of the impact of chronic releases of petroleum hydrocarbons.
Biogenically structured habitats, such as coastal marshes and mangrove forests, are subject to destruction or alteration by acute oiling events. Because the structure of these habitats depends on living organisms, when they are killed, the structure of the habitat, and sometimes the substrate on which it grows, is lost. Depending on the severity of oiling, and particularly if oil is incorporated in the sediments or structure of the habitat, recovery of the habitat and the organisms dependent on it may be exceptionally slow. In areas of sensitive environments or at-risk organisms, federal, state, and local entities responsible for contingency plans should develop mechanisms for higher levels of prevention, such as avoidance, improved vessel tracking systems, escort tugs, and technology for tanker safety.
Although there is now good evidence of the toxic effects of oil pollution on individual organisms and on the species composition of communities, there is little information on the effects of either acute or chronic oil pollution on populations or on the function of communities or ecosystems. The lack of understanding of population-level effects lies partly in the fact that the structure of populations of most marine organisms is poorly known because of the open nature of communities and the flow of recruits between regions. Also, in some populations (e.g., bony fish) the relationships between numbers of juveniles produced and recruitment to the spawning adult population are unknown. The U.S. Departments of Interior and Commerce should identify an agency, or combination of agencies, to develop priorities for continued research on the following:
-
the structure of populations of marine organisms and the spatial extent of the regions from which recruitment occurs;
-
the potential for cascades of effects when local populations of organisms that are key in structuring a community are removed by oiling; and
-
the basic population biology of marine organisms, which may lead to breakthroughs in understanding the relationship between sublethal effects, individual mortality and population consequences.
There is a tremendous need for timely dissemination of information across state, federal, and international boundaries about the environmental effects of oil in the sea. Although the United States has experience that might benefit the international community, this nation might benefit greatly from lessons learned in other countries with offshore oil production, heavy transportation usage, and diffuse inputs of petroleum from land- and air-based sources. Therefore, the federal agencies identified above, in collaboration with similar international institutions, should develop mechanisms to facilitate the transfer of information and experience.


