
CHAPTER 2
PATTERNS OF CHILDHOOD DEATH IN AMERICA
A simple child, that lightly draws its breath, And feels its life in every limb, What should it know of death?
William Wordsworth, 1798
In 1999, children aged 0 to 19 accounted for 29 percent, or 77.8 million, of the U.S. population of 272.7 million (U.S. Census, 2001). Reflecting their generally good health, children accounted for only 2 percent of all deaths—about 55,000 compared to more than a half million deaths for adults aged 20 to 64 and 1.8 million for those age 65 and over (NCHS, 2001a).1 Wordsworth’s implicit hope is far more a reality today than during the time 200 years past when the poet’s two youngest children died.
This chapter summarizes information about the death rates and leading causes of death for children of different ages. It also reviews information about where children die. The discussion begins, however, by briefly putting life-threatening illness and death during childhood in the broader context of child health and illness in the United States. The chapter ends with a short discussion of conclusions and implications for health care providers and policymakers.
CHILDHOOD DEATH IN THE CONTEXT OF IMPROVED CHILD HEALTH
Any discussion of death in childhood and the experience of children
and families living with life-threatening medical problems has to be put in the context of child health as it has improved during the last century. First, in the United States, death in childhood is now rare rather than commonplace. Second, causes of death in childhood have changed. Third, children have different patterns of mortality than adults. Fourth, although most children are now healthy, a significant fraction lives with serious health problems.
Death in Childhood Is No Longer Expected
In 1900, 30 percent of all deaths in the United States occurred in children less than 5 years of age compared to just 1.4 percent in 1999 (CDC, 1999a; NCHS, 2001a). Infant mortality dropped from approximately 100 deaths per 1,000 live births in 1915 (the first year for which data to calculate an infant mortality rate were available) to 29.2 deaths per 1,000 births in 1950 and 7.1 per 1,000 in 1999 (CDC, 1999b; NCHS, 2001a).2
This decrease in mortality reflects a century’s worth of advances in public health, living standards, medical science and technology, and clinical practice. Many infants who once would have died from prematurity, complications of childbirth, and congenital anomalies (birth defects) now survive. Children who previously would have perished from an array of childhood infections today live healthy and long lives thanks to sanitation improvements, vaccines, and antibiotics. In the United States, the average life expectancy at birth rose from less than 50 years in 1900 to more than 76 years in 1999, due in considerable measure to continuing reductions in infant and child mortality (NCHS, 2001c).
Nonetheless, each year in this country, thousands of parents lose their children to conditions such as prematurity, congenital anomalies, injuries, and diseases such as cancer and heart disease. Thousands more siblings, grandparents, other family members, friends, neighbors, schoolmates, and professional caregivers are touched by these deaths. Instead of being a sad but common family experience, death in childhood now stands out as a particular tragedy, at least in developed nations such as the United States.
Leading Causes of Death in Childhood Have Changed
In 1900, pneumonia and influenza, tuberculosis, and enteritis with diarrhea were the three leading causes of death in the United States, and children under 5 accounted for 40 percent of all deaths from these infections (CDC, 1999a). Today, only pneumonia (in combination with influenza) is among the top 10 causes of death overall or for children. Substantial declines in mortality have continued in recent decades. During the past 40 years, infant deaths due to pneumonia and influenza fell from 314 per 100,000 live births in 1960 to 8 per 100,000 in 1999 (Singh and Yu, 1995; NCHS, 2001b). As infectious disease mortality has declined in significance, unintentional and intentional injuries have emerged as leading causes of death, especially for children past infancy.
In 1960, infant deaths from short gestation/low birth weight and congenital anomalies (described in federal reports as “congenital malformations, deformations, and chromosomal abnormalities”) occurred at rates of 457 and 361 per 100,000 live births, respectively (Singh and Yu, 1995). By 1999, these rates had dropped to 111 and 138 per 100,000, respectively (NCHS, 2001b).
More recently, mortality from sudden infant death syndrome (SIDS), which was first reported as a separate cause of death in 1973, has dropped substantially—by more than a third between 1992 and 1996, with continuing decreases since then (Willinger et al., 1998; NCHS, 2000b). SIDS is still, however, the third leading cause of infant death in this country.
Children Have Different Patterns of Mortality Than Adults
As shown in Table 2.1 (which uses broader age categories than those used later in this chapter) the leading causes of death differ considerably for children compared to adults, especially elderly adults. For infants, the leading causes of death include congenital anomalies (a highly diverse group of malformations and other conditions), disorders related to short gestation and low birth weight, and sudden infant death syndrome. For older children and teenagers, mortality from unintentional and intentional injuries grows in importance. Among adults, as age increases, the relative contribution of injuries decreases, and death rates related to chronic conditions such as heart disease increase sharply. Beginning in adolescence, increasing age also brings increases in causes of death linked to individual behaviors involving diet, exercise, smoking, alcohol use, and similar factors.
Figure 2.1 shows the percentages of all deaths in childhood accounted for by leading causes of child mortality. Table 2.2 shows the proportion of all deaths for given age groups accounted for by the top five leading causes of death. For most age groups, a few causes of death account for two-thirds
TABLE 2.1 Top Ten Causes of Death, Numbers of Deaths by Cause and Total, and Total Death Rates, by Age Group (1999)
|
|
Age Group (years) |
||
|
Rank |
Infant (<1) |
1–4 |
5–14 |
|
1 |
Congenital anomaliesa 5,473 |
Accidentsb 1,898 |
Accidents 3,091 |
|
2 |
Short gestation and LBWc 4,392 |
Congenital anomalies 549 |
Malignant neoplasms 1,012 |
|
3 |
SIDS 2,648 |
Malignant neoplasms 418 |
Homicide 432 |
|
4 |
Complications of pregnancy 1,399 |
Homicide 376 |
Congenital anomalies 428 |
|
5 |
Respiratory distress syndrome 1,110 |
Diseases of the heart 183 4 |
Diseases of the heart 277 |
|
6 |
Placental cord membranes 1,025 |
Pneumonia and influenza 130 |
Suicide 242 |
|
7 |
Accidents 845 |
Perinatal periode 92 |
Chronic lower respiratory diseases 139 |
|
8 |
Newborn Sepsis 691 |
Septicemia 63 |
Benign neoplasms 101 |
|
9 |
Diseases of the circulatory system 667 |
Benign neoplasms 63 |
Pneumonia and influenza 93 |
|
10 |
Atelectasisf 647 |
Chronic lower respiratory diseases 54 |
Septicemia 77 |
|
|
|||
|
15–24 |
25–44 |
45–64 |
>65 |
|
Accidents 13,656 |
Accidents 27,121 |
Malignant neoplasms 135,748 |
Diseases of the heart 607,265 |
|
Homicide 4,998 |
Malignant neoplasms 20,737 |
Diseases of the heart 99,161 |
Malignant neoplasms 390,122 |
|
Suicide 3,901 |
Diseases of the heart 16,666 |
Accidents 18,924 |
Stroke 148,599 |
|
Malignant neoplasms 1,724 |
Suicide 11,572 |
Stroke 15,215 |
Chronic lower respiratory disease 108,112 |
|
Disease of the heart 1,069 |
HIV infection 8,961 |
Chronic lower respiratory diseases 14,407 |
Pneumonia and influenza 57,282 |
|
Congenital anomalies 434 |
Homicide 7,437 |
Diabetes mellitus 13,832 |
Diabetes mellitus 51,843 |
|
Chronic lower respiratory diseases 209 |
Diseases of the liver 3,709 |
Diseases of the liver 12,005 |
Alzheimer's Disease 44,020 |
|
HIV 198 |
Stroke 3,154 |
Suicide 7,977 |
Accidents 32,219 |
|
Stroke 182 |
Diabetes mellitus 2,524 |
HIV 5,056 |
Nephritis 29,938 |
|
Pneumonia and influenza 179 |
Pneumonia and influenza 1,402 |
Septicemia 4,399 |
Septicemia 24,626 |
|
|
Age Group (years) |
||
|
Rank |
Infant (<1) |
1–4 |
5–14 |
|
Total deaths (all causes) |
27,937 |
5,249 |
7,595 |
|
Death rate per 100,000 (all causes) |
705.6g |
34.7 |
19.2 |
|
NOTE: The rank order of leading causes of death changed somewhat between 1998 and 1999, reflecting in part changes in the coding rules for selecting underlying cause of death between the ninth and tenth editions of the International Classification of Diseases. aCongenital malformations, deformations, and chromosomal abnormalities. bMost vital statistics reports now use the term “unintentional injury” rather than accidents. cLBW = low birth weight. |
|||
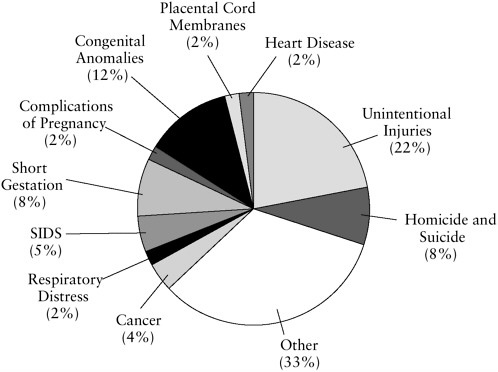
FIGURE 2.1 Percentage of total childhood by major causes (1999).
SOURCE: NCHS, 2001a.
|
|
|||
|
15–24 |
25–44 |
45–64 |
>65 |
|
30,656 |
130,322 |
391,953 |
1,797,331 |
|
81.2 |
157.5 |
662.2 |
5,203.6 |
|
dDeaths related to congenital malformations of the heart are included with congenital anomalies. e Certain conditions originating in the perinatal period. f Pulmonary collapse or, more generally, absence of gas from part or all of the lung. g Death rate calculated per 100,000 population (under 1 year) rather than per 1,000 live births, which is the infant mortality rate (see Table 2.4) SOURCE: NCHS, 2001a, b. |
|||
to three-quarters of all deaths. The major exception involves infants who die from a broader array of medical problems, as discussed in more detail below.
Most Children Are Healthy, but Many Live with Serious Health Problems
Although experts worry about the long-term health consequences of common problems such as juvenile obesity and lack of exercise, most children are healthy. Nonetheless, many children live with special health care needs, in part because medical and clinical advances make it possible to save and prolong the lives of children who in earlier times would have died from prematurity, congenital anomalies, injuries, and other problems.
As defined by the Maternal and Child Health Bureau of the U.S. Department of Health and Human Services, children with special health care needs “have or are at increased risk for a chronic physical, developmental, behavioral or emotional condition and . . . also require health and related services of a type or amount beyond that required by children generally” (McPherson et al., 1998, p. 138).3 These conditions include cerebral palsy,
|
3 |
The definition is not yet consistently used, even by the government. For example, one federal government web site (www.childstats.gov) uses the term to describe children who are “limited in their activities because of one or more chronic health conditions.” |
TABLE 2.2 Percentage of All Deaths Due to Top Five Leading Causes, by Age (1999)
|
Age (years) |
Percentage of Total |
|
<1 |
53 |
|
1–4 |
65 |
|
5–9 |
71 |
|
10–14 |
69 |
|
15–19 |
84 |
|
20–24 |
81 |
|
25–44 |
66 |
|
45–64 |
74 |
|
>65 |
73 |
|
SOURCE: NCHS, 2001a,b. |
|
vision loss, sickle cell anemia, asthma, mental retardation, autism, and serious learning disorders (NRC, 1996; Newacheck et al., 1998).
Newacheck (2000) has estimated that some 18 percent of children (more than 12 million) have special health care needs, which range from modest to extraordinary. Most have conditions that are not expected to lead to death in childhood. Of the estimated 12.8 million individuals with needs for long-term care at home or elsewhere, approximately 384,000 were children (National Academy on Aging, 1997).
A study by Feudtner and colleagues (2001) found that complex chronic conditions such as cancer and cardiovascular problems accounted for nearly 15,200 deaths among individuals 0 to 24 years of age in 1997. (Note that this estimate spans an additional five years beyond the 0 to 19 age range discussed in this chapter.) The researchers estimated that on any given day, about 5,000 of these individuals were in their last six months of life and potentially could have benefited from hospice care based on restrictive Medicaid eligibility criteria.
A working group on pediatric palliative care has estimated that about 8,600 children would benefit on any given day from palliative care services because of their limited life expectancy and serious needs (ChIPPS, 2001). This estimate did not link the potential for benefit to an assumed life expectancy of six months or less, a criterion for Medicare or Medicaid hospice benefits.
Some children who die from critical acute problems might need intensive palliative or hospice services for a few days or even hours, whereas children with complex chronic problems might need mostly intermittent services over a period of months or years. A substantial percentage of
children would not benefit from palliative or hospice services because they die suddenly and unexpectedly, leaving caregivers to tend to the bereaved family.
The next three sections of this chapter review death rates and major causes of death for children by broad age groups. Later sections consider socioeconomic and other disparities in death rates and causes of death.
INFANT, FETAL, AND PERINATAL DEATHS
Because so many deaths occur during pregnancy and in the first year after birth and because understanding the causes of such deaths is of particular interest, a number of terms have been developed to describe and differentiate these deaths. Table 2.3 lists the most widely used terms and their definitions and also includes other common terms and definitions relating to this period.
Death Rates and Numbers
Table 2.4, which shows trends in infant, fetal, and perinatal mortality rates since 1950, reveals continuing mortality decreases in the last half-century. In 1999, the infant mortality rate in the United States reached a low of 7.1 infant deaths per 1,000 live births, or 28,371 total infant deaths. After infancy, the mortality rate drops significantly and does not rise again to similar rates until people reach their mid-50s.
More children die in the first year of life than in all other years of childhood combined (27,937 infants compared to 26,622 children aged 1 to 19 years in 1999) (see Figure 2.2). Two-thirds of infant deaths occur in the neonatal period (18,728 of 27,937 deaths).
Of some 6.2 million pregnancies each year, about 63 percent result in a live birth, 20 percent in an induced abortion, and 15 percent in a fetal death (Martin and Hoyert, 2001). Ninety percent of spontaneous fetal losses occur within the first 20 weeks of pregnancy. A large percentage of these end so early that the pregnancy is unrecognized. Most of the decline in fetal death rates in recent decades has occurred in the late fetal period.
Leading Causes of Infant Death
Understanding the common causes of infant death is important in understanding the potential role of supportive care for these children and their families. Table 2.5 reports the five leading causes of infant, neonatal, and postneonatal death. These causes account for approximately 54 percent of all infant deaths. In contrast, the next five causes (complications of placenta, cord, and membranes; infections; unintentional injuries; intrauterine
TABLE 2.3 Terminology Relating to Infants and Fetuses
|
Term |
Definition |
|
Infant |
Child less than 1 year of age |
|
Full-term infant |
Infant born between 37 and 42 weeks’ gestation |
|
Premature |
infant Infant born before 37 weeks of gestation |
|
Neonatal |
period First 27 days of lifea |
|
Early neonatal period |
First 6 days of lifea |
|
Postneonatal period |
Days 28–365 of lifea |
|
Low birth weight |
Birth weight less than 2,500 grams (5.5 pounds) at birth |
|
Very low birth weight |
Birth weight less than 1,500 grams (3.3 pounds) at birth |
|
Extremely low birth weight |
Birth weight less than 1,000 grams (2.2 pounds) at birth |
|
Miscarriage or spontaneous abortion |
Naturally occurring, spontaneous expulsion of a human fetus, especially between the twelfth and twenty-seventh weeks of gestation |
|
Antepartum fetal death |
Death of a fetus before labor begins |
|
Intrapartum fetal death |
Death of a fetus during labor |
|
Fetal death |
Death of fetus prior to complete expulsion or extraction from the mother of a product of human conception (irrespective of duration of pregnancy) that is not an induced termination of pregnancy.b Some states use the term “stillbirth” for such fetal deaths |
|
Late fetal deaths |
Fetal deaths of 28 weeks’ or more gestationb |
|
Perinatal mortality |
Late fetal deaths plus infant deaths within 7 days of birth. (definitions of perinatal mortality vary and sometimes include fetal and infant deaths from the twentieth or the twenty-eighth week of gestation through the seventh or twenty-seventh day of life) |
|
Infant mortality rate |
Number of infant deaths per 1,000 live births |
|
aNCHS, 2001c, Table 23. bNCHS, 1997. The federal government recommends that state governments, for vital statistics reporting purposes, report fetal deaths of 350 grams or more or, if the weight is unknown, 20 weeks’ or more gestation; 13 U.S. jurisdictions follow this recommendation, but the majority (25) use only the 20 weeks’ gestation criterion. Fetal mortality rates are based on deaths of 20 or more weeks’ gestation. |
|
hypoxia and birth asphyxia; and pneumonia and influenza) account for approximately 14 percent of deaths.
Congenital anomalies and disorders relating to short gestation and unspecified low birth weight dominate as causes of neonatal deaths. During the postneonatal period, SIDS and unintentional injuries and intentional
TABLE 2.4 Infant, Fetal, and Perinatal Mortality Rates, Selected Years 1950–1999
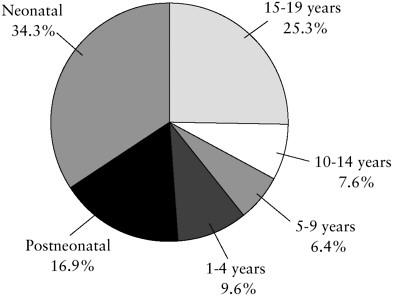
FIGURE 2.2 Percentage of total childhood deaths by age group (1999).
SOURCE: NCHS, 2001b.
injuries increase in relative importance, although the mortality rate overall is substantially lower. Congenital anomalies also cause deaths among children past infancy, but they do so to a lesser extent because most children with problems likely to prove fatal have already died.
Feudtner and colleagues (2001) reported that about one-quarter of all infant deaths in Washington state during 1980 to 1998 were linked to complex chronic conditions such as cardiac, brain, and spinal malformations, with the rest relatively evenly divided between injuries and other acute events (e.g., extreme prematurity, SIDS, respiratory distress syndrome). For the entire group of children, approximately one-fifth of all deaths were linked to chronic complex conditions.
Congenital Anomalies
Congenital anomalies, whether detected before or after birth, can involve any part of an infant. (Federal mortality reports refer to “congenital malformations, deformations, and chromosomal abnormalities” [NCHS, 2001b, p. 71].) Definitions vary. For example, one source defines them as “structural defects present at birth” (Merck Manual, 2001, Chapter 261). Another definition is “existing at birth, referring to certain mental or physical traits, anomalies, malformations, diseases, etc. which may be either
TABLE 2.5 Top Five Causes of Infant, Neonatal, and Postneonatal Mortality and Total Deaths (1999)
|
Rank |
Infant Mortality |
No. |
Neonatal Mortality |
No. |
Postneonatal Mortality |
No. |
|
1 |
Congenital anomalies |
5,473 |
Short gestation and LBW |
4,320 |
SIDS |
2,440 |
|
2 |
Short gestation and LBW |
4,392 |
Congenital anomalies |
3,892 |
Congenital anomalies |
1,581 |
|
3 |
SIDS |
2,648 |
Complications of pregnancy |
1,391 |
Accidents and adverse effects |
743 |
|
4 |
Complications of pregnancy |
1,399 |
Respiratory distress syndrome |
1,050 |
Pneumonia and influenza |
399 |
|
5 |
Respiratory distress syndrome |
1,110 |
Complications of placenta, cord, membrane |
1,010 |
Homicide |
288 |
|
Total (all causes) |
27,937 |
|
18,728 |
|
9,209 |
|
|
SOURCE: NCHS, 2001b. |
||||||
hereditary or due to an influence occurring during gestation up to the moment of birth” (Stedman’s Medical Dictionary, 1995). Congenital anomalies may be inherited or sporadic (for example, arising de novo during embryonic development). Some are readily evident during physical examination at birth, whereas others are detectable only by radiologic, genetic, or other testing. Many defects may be detected before birth by ultrasound examination or examination of fluid or tissue samples.
Congenital anomalies can arise from fetal environmental causes (e.g., drug exposure, infection, maternal nutritional deficiencies, injury) or from chromosomal or genetic abnormalities (which may be inherited or spontaneous). About one newborn in 100 has a hereditary malformation, and about 1 in 200 has an inherited metabolic disorder or an abnormality of the sex chromosomes (Shapiro, 2000). Most anomalies are not lethal, and most (for example, an extra finger, toe, or nipple) have little effect on infant
health. The most serious structural anomalies affect the formation of the heart, brain, or other vital organs, and many fatal inherited disorders involve neuromuscular or metabolic functions.
Congenital heart disease is the major cause of death in children with congenital anomalies, but it still occurs in only 0.5 to 0.8 percent of live births. The incidence of cardiac anomalies is higher in fetal deaths (10 to 25 percent) and premature infants (about 2 percent, excluding patent ductus arteriosis, a common heart problem that results from the persistence of a fetal circulatory pattern, not from a malformation) (Bernstein, 2000). Advances in surgical procedures, in particular, have significantly improved outcomes for infants with congenital heart problems, but survival is still limited for infants with uncorrectable malformations or coexisting defects in other vital organs.
Congenital disorders of the nervous system that are often or always fatal include anencephaly (absence of all or a major part of the brain) and severe spina bifida (especially rachischisis, a completely open spine) among others. Anencephaly and spina bifida (all degrees of severity) each occur in approximately 1 in 1,000 live births. Virtually all children with anencephaly die within days after birth. The overall risk of mortality for children with spina bifida is 10 to 15 percent, and death usually occurs within the first 4 years of life. Children with severe spinal cord defects who survive often have major chronic care needs (e.g., assistance in eating, bathing, toileting, and dressing). Even with surgical repair of the spinal opening, the spinal cord injury is permanent. The extent of paralysis or mental retardation depends on the location and extent of the defect (Haslam, 2000). Congenital anomalies can also affect the gastrointestinal tract, skeletal system, genitourinary system, circulatory system, and pulmonary system, with varying prognoses depending on the severity of the anomaly and its susceptibility to surgical correction.
Genetic abnormalities may be inherited or arise sporadically. For example, trisomy 13 (Pateau syndrome), trisomy 18 (Edward’s syndrome), and trisomy 21 (Down syndrome), conditions in which an extra chromosome is present, are typically not inherited in the usual sense but tend to arise from age-linked errors in the division of ova. Trisomy 13 and 18 are almost always fatal, with less than 10 percent of children surviving more than one year (Merck Manual, 2001, Chapter 261). In contrast, trisomy 21 (Down syndrome) rarely leads to death in childhood, but associated problems (e.g., cardiac and skeletal anomalies and a propensity to leukemia) generally cause death by middle age. Duchenne muscular dystrophy and Tay-Sachs disease are among a number of nonchromosomal genetic disorders that are inherited and usually or always lead to death in childhood.
Low Birth Weight and Prematurity
Short gestation and low birth weight are the leading causes of neonatal mortality and handicaps in infants (Stoll and Kliegman, 2000b; see also Sowards, 1999). Most very low birth weight infants are premature, rather than simply small for their gestational age. Only 20 percent of infants weighing 500 to 600 grams at birth survive, compared to 85 to 90 percent of those weighing between 1,250 and 1,500 grams. Similarly, very few infants born at 22 weeks’ gestation survive, but more than 95 percent of those born at 30 weeks do.
Most extremely low birth weight (<1,000 grams at birth) infants who die do so within a few days of birth, although some survive for weeks or months before dying (see, e.g., Meadow et al., 1996; Lemons et al., 2001; Tommiska et al., 2001). A study by Meadow and colleagues (1996) reported that the survival rate at birth for these infants was 47 percent but rose to 81 percent by the fourth day of life. After the fourth day of life, an infant’s overall severity of illness was a more important factor in survival than the original birth weight. Mortality for premature infants results primarily from conditions associated with immature organs (e.g., respiratory distress related to immature lungs and intraventricular hemorrhage, bleeding into the brain related to underdeveloped cerebral blood vessels) or infection (e.g., sepsis [infection of the blood], necrotizing enterocolitis [an inflammation that causes injury to the bowel], pneumonia) that are complicated by an insufficiently developed immune system.
Sudden Infant Death Syndrome
SIDS is the most common cause of death in infants after 1 month of age. It is a diagnosis of exclusion when a postmortem examination, death scene investigation, and review of case records fail to reveal a specific cause of death. Deaths typically occur between 2 and 4 months of age, and 90 percent of SIDS deaths occur before the child is 6 months old (AAP, 2001c). Environmental factors such as the baby’s sleeping position, soft bedding, and cigarette smoke have been implicated as risk factors. An immaturity of the infant’s innate ability to control his or her breathing, heartbeat, blood pressure, or arousal level may also contribute to these deaths (AAP, 2001c). Educational programs encouraging parents to put infants to sleep on their backs (the “Back to Sleep” campaign) have been credited as an important factor in the reduction of SIDS rates (Willinger et al., 1998; AAP, 2000b).
The vast majority of unexpected and unexplained infant deaths are caused by SIDS. Experts estimate, however, that between 1 and 5 percent of deaths that are diagnosed as SIDS may actually result from intentional suffocation or other abuse (AAP, 2001c). For this reason and, more generally, to learn more about sudden unexplained infant deaths, death scene
investigations of all such deaths are recommended (AAP, 1999c), although no uniformly accepted standards for such investigations now exist (NMRP, 1999). Autopsies are performed in approximately 90 percent of sudden infant deaths that occur without evident explanation (Iverson, 1999). In addition, although the details vary, an increasing number of jurisdictions routinely require an assessment of child deaths by multidisciplinary child fatality review teams that attempt to determine the circumstances surrounding child deaths and identify preventable causes of death, including child abuse and neglect. As discussed later, police investigations, although necessary when the cause of a child’s death is unexplained, add extra stress for parents and warrant extra sensitivity by investigators who meet parents.
MORTALITY FOR CHILDREN AGED 1 TO 4 AND 5 TO 9
Death Rates and Numbers
Children in these age groups are much less likely to die than infants. The death rate for infants is more than 751 per 100,000 population (and 7.2 per 1,000 live births) whereas the death rate for children aged 1 to 4 is 34.6 per 100,000 and for children aged 5 to 9 is 17.7 per 100,000 (Tables2.2 and 2.6). Of the age groups reviewed in this chapter, children aged 5 to 9 have the lowest death rate, with lower rates of death from most leading causes including unintentional and intentional injuries.
TABLE 2.6 Top Five Causes of Death in Children Aged 1–4 and 5–9 Years, Death Rates, and Total Deaths (1999)
|
Rank |
Mortality Ages 1–4 |
No. |
Ratea |
Mortality Ages 5–9 |
No. |
Ratea |
|
1 |
Unintentional injury |
1,898 |
12.6 |
Unintentional injury |
1,459 |
7.3 |
|
2 |
Congenital anomalies |
549 |
3.6 |
Malignant neoplasms |
509 |
2.6 |
|
3 |
Malignant neoplasms |
418 |
2.8 |
Congenital anomalies |
207 |
1.0 |
|
4 |
Homicide |
376 |
2.5 |
Homicide |
186 |
0.9 |
|
5 |
Diseases of the heart |
183 |
1.2 |
Diseases of the heart |
116 |
0.6 |
|
Total (all causes) |
5,249 |
34.7 |
|
3,474 |
17.4 |
|
|
aPer 100,000 population in age group. SOURCE: NCHS, 2001a. |
||||||
Leading Causes of Death for Children 1 to 4 and 5 to 9
Not only death rates but also causes of death differ significantly for children who survive their first year. In particular, unintentional and intentional injuries become more important. The diseases that kill so many older adults—heart disease and cancer—kill relatively few children in these age groups. As shown in Table 2.6, more children aged 1 to 4 were murdered in 1999 than died of heart disease.
Unintentional Injuries
Unintentional injuries are the leading cause of death in children ages 1 to 9. In 1999, they accounted for 36 percent of deaths in the 1 to 4 age group and 42 percent of deaths in the 5 to 9 age group.
Among children aged 1 to 4, motor vehicle occupant injury is the leading cause of unintentional injury-related death, followed by drowning, fire and burns, airway obstruction injuries (choking and suffocation), and motor vehicle pedestrian injuries. Among children aged 5 to 9, motor vehicle occupant injury is again the leading cause of unintentional injury-related death, followed by drowning, fire and burns, airway obstruction injuries, and other transportation fatalities (NCHS, 2001b). Failure to wear seat belts is an important factor in motor vehicle deaths. Nearly 6 out of 10 children under the age of 15 killed in a motor vehicle crash in 2000 were not restrained by a seat belt or child safety seat (NHTSA, 2000).
Congenital Anomalies
Congenital anomalies continue to be a leading cause of death for children in the 1 to 4 age group and, to a lesser extent, the 5 to 9 age group. The total deaths from this cause were, however, slightly more than 800 in 1999 for both age groups combined compared to more than 5,000 for the infant group.
Malignant Neoplasms
Cancer is the leading disease-related cause of death for children more than 1 year of age.4 In 1999, 2,244 children aged 0 to 19 died of malignant neoplasms (NCHS, 2001a). Analyses by the National Cancer Institute show
|
4 |
Cancer is not a leading cause of infant death (see Table 2.1). Nonetheless, although it causes only 0.2 percent of infant deaths, the peak incidence of childhood cancer occurs in the first year of life. Infants fare worse than older children for some diagnoses (e.g., acute lymphoblastic leukemia) but better for others (e.g., neuroblastoma) (Ries et al., 1999, 2001). |
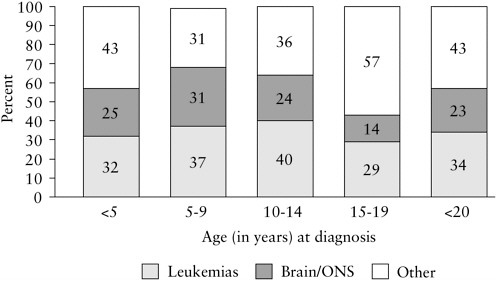
FIGURE 2.3 Percentage distribution of childhood cancer mortality by type and age group, age <20 (1995).
NOTE: ONS = other nervous system.
SOURCE: Ries et al., 1999.
that leukemias and cancers of the brain and central nervous system are the most frequent causes of cancer-related deaths in those under age 20 (Figure 2.3) (Ries et al., 1999, 2001). For adults, lung cancer, breast cancer, and prostate cancer dominate as cancer-related causes of death (Reis et al., 2001).
Survival rates for most childhood cancers have improved dramatically over the past three decades. Age-adjusted mortality dropped by nearly 44 percent from 1975 to 1998 (Ries, 2001). For leukemias in childhood, the decrease was more than 55 percent, but for brain and other nervous system tumors, it was considerably smaller, 24 percent.
According to the National Cancer Institute, the death rate between 1994 and 1998 from all cancers was 2.7 per 100,000 for children aged 0 to 4 and 5 to 9 years (Ries, 2001). Leukemias and brain and other nervous system cancers were the most common types of cancer in these two age groups (as well as in the 10- to 14-year group). They also accounted for more than half the cancer mortality for these age groups. Five-year relative survival rates for children in all age groups for these cancers were fairly similar—between 76 and 79 percent—for the period 1992 to 1997.
Intentional Injuries
In 1990 to 1995, the homicide rate for children aged 1 to 14 in the United States was five times the rate in other industrialized countries (CDC, 1997). The rate of suicide was twice as high for the United States. Although the overall death rate for children decreased substantially during 1950 to 1993, homicide rates tripled and suicide rates quadrupled. More recently, child deaths due to homicide have been declining (NCHS, 2001c). Firearms are the major cause of homicide deaths among children in the United States. Gunshot wounds account for 5 percent of pediatric injuries seen in emergency departments and produce the highest death rate due to injury (NPTR, 2001).5
In 1999, homicide was the fourth leading cause of death for children aged 1 to 4 years and was also the fourth leading cause for 5- to 9-year-olds, who had the lowest rate among children. Homicide mortality was nearly threefold higher (2.5 deaths per 100,000, or 376 deaths) for children aged 1 to 4 years than for the 5 to 9 age group (0.9 per 100,000, or 186 deaths). As discussed below, homicide mortality rates vary not only by age but by sex and other characteristics.
Although young children are less likely to be victims of violence than are adolescents, when they are victims, parents and other caretakers are more likely than acquaintances and strangers to have inflicted the abuse, especially for children aged 1 to 4. Within the category of parents and other caretakers, analyses of data from the Federal Bureau of Investigation indicate that parents accounted for 60 percent of the abuse reported to the police, and stepparents and boyfriends or girlfriends of parents accounted for 19 percent (Finkelhor and Ormrod, 2001). As discussed in Chapter 8, such abusive situations present ethical and legal problems related to normal parental responsibilities for decisions about children’s medical care.
MORTALITY FOR CHILDREN AGED 10 TO 14 AND 15 TO 19
Death Rates and Numbers
The age groups 10 to 14 and 15 to 19 include the adolescent years. Adolescents can, however, be categorized differently based on social, biological, or developmental criteria. For example, those age 18 and older are legally adults. In most states, they can obtain a driver’s license at age 16. Still, pediatricians may continue to care for patients with complex chronic conditions even after they have entered early adulthood.
TABLE 2.7 Top Five Causes of Death for Adolescents (1999)
|
Rank |
Mortality Ages 10–14 |
No. |
Ratea |
Mortality Ages 15–19 |
No. |
Ratea |
|
1 |
Unintentional injury |
1,632 |
8.3 |
Unintentional injury |
6,688 |
33.9 |
|
2 |
Malignant neoplasms |
503 |
2.6 |
Homicide |
2,093 |
10.6 |
|
3 |
Homicide |
246 |
1.3 |
Suicide |
1,615 |
8.2 |
|
4 |
Suicide |
242 |
1.2 |
Malignant neoplasms |
745 |
3.8 |
|
5 |
Congenital anomalies |
221 |
1.1 |
Heart Disease |
463 |
2.3 |
|
Total (all causes) |
4,121 |
21.1 |
Total (all causes) |
13,778 |
69.8 |
|
|
aPer 100,000 population in the age group. SOURCE: NCHS, 2001b. |
||||||
Leading Causes of Death for Children 10 to 14 and 15 to 19
Table 2.7 reports the leading causes of death for children aged 10 to 14 and 15 to 19. Overall, 10- to 14-year-olds have death rates similar those of 5- to 9-year-olds. For older teenagers, however, death rates rise sharply— more than tripling compared to the 10 to 14 age group. This increased mortality reflects developmental changes, including increased risk-taking behaviors as adolescents accelerate their independence from their parents.
Unintentional Injuries
Unintentional injuries are the leading cause of death for both younger and older adolescents, but the rate for older adolescents is almost four times that of the younger group. Not surprisingly, given that younger children are not legally allowed to drive, the rate of unintentional deaths involving motor vehicles increases dramatically with age, from 5.0 deaths per 100,000 children aged 10 to 14 to 26.3 deaths per 100,000 in those aged 15 to 19 in 1999 (NCHS, 2001e). Almost three-quarters of all unintentional traumatic deaths in the older adolescent group involved motor vehicle crashes, including collisions between vehicles, single-car crashes, collisions with fixed objects (e.g., telephone poles, trees), pedestrians, and trains. Older teens also have higher death rates for other kinds of injuries (7.3 per 100,000 for those aged 15 to 19 compared to 3.5 per 100,000 for those aged 10 to 14 in 1998) (NCHS, 2001e).
The teens who die in motor vehicle crashes are passengers 86 percent of the time, but in 68 percent of those crashes, the driver is also a teenager. Alcohol is a significant factor when teens are killed in motor vehicle crashes, with more than half of the teenaged victims found to have blood alcohol levels 0.1 mg/dL or greater (Jones et al. 1992).
Intentional Injuries
Homicide and suicide mortality rates increase as children move through adolescence, with greater than an eight-fold difference between the younger and older adolescent groups for homicide and about seven-fold difference for suicide. Among 10- to 14-year-olds, homicide was the third leading cause of death in 1999, and suicide ranked fourth. For those aged 15 to 19, homicide was the second leading cause of death with suicide ranking third. The majority of suicide and homicide deaths in both age groups were linked to firearms (NCHS, 2001e).
Malignant Neoplasms
Adolescents tend to suffer from different types of cancers than younger children (Ries et al., 1999). Embryonal cancers (e.g., neuroblastoma, Wilms’ tumor) are uncommon cancer diagnoses in this age group; germ cell cancers (e.g., testicular cancer) are more common. In 1995, the top four causes of cancer mortality in 10- to 14-year-olds were leukemia, brain and central nervous system (CNS) tumors, bone and joint tumors, and non-Hodgkin’s lymphoma (Ries et al., 1999). In 15- to 19-year-olds, the top causes of mortality due to malignant neoplasm were brain and CNS tumors, leukemia, bone and joint tumors, sarcomas, and non-Hodgkin’s lymphoma.
Overall, malignant neoplasms are the second leading cause of death in 10- to 14-year-olds and the fourth leading cause of death in 15- to 19-year-olds. The cancer death rate is, however, slightly higher in the older teens than in the younger group (3.8 per 100,000 versus 2.6 per 100,000 in 1999) (NCHS, 2001b). Between 1973 and 1992, the incidence of cancer rose the most and the death rate decreased the least in the 15- to 19-year age category compared to any other child or adult age group (Bleyer et al. 1997).
GENDER, SOCIOECONOMIC, AND OTHER DIFFERENCES AND DISPARITIES IN CHILD MORTALITY
Whether the objective is preventing deaths or planning programs to improve palliative and end-of-life care for children and their families, one useful step is examining demographic and other data for risk factors or
variables associated with different rates or causes of child death. Variables typically examined include geographic location, age, sex, socioeconomic and ethnocultural characteristics, and community characteristics such as density, average income or income inequality, and rates of violence.6
Differences and Disparities by Region
Reflecting social, economic, physical, and other differences, states and regions show considerable variation in child mortality by cause. One stark contrast involves infant mortality. In 1999, the District of Colombia had the highest infant mortality rate (15.0 per 1,000 live births), followed by South Carolina (10.2 per 1,000 live births). Maine and Utah had the lowest rate in 1999 at 4.8 deaths per 1,000 live births (NCHS, 2001e).
In 1999, for those aged 0 to 19, Wyoming led the nation in motor vehicle fatality rates (23.5 per 100,000), followed by Mississippi (20.9 per 100,000). The lowest fatality rates were for Hawaii (3.6 per 100,000) and Rhode Island (3.8 per 100,000) (NCHS, 2001e). For motor vehicle fatalities involving all ages, factors contributing to differences in rates appear to include population density, proportions of light and heavy trucks in use, alcohol use, and delayed medical care (see, e.g., Muelleman and Mueller, 1996). Two single-state studies, one in Colorado (Hwang et al., 1997) and one in Alabama (King et al. 1994), reported higher death rates from motor vehicle crashes and unintentional injuries for children in rural areas. Another study reported that rural children ages 1 to 19 had a 44 percent higher death rate from injuries than their urban counterparts in 1992, with the greatest differences found in the 15 to 19 age group (Ricketts, 2000). (Reported differences in urban and rural death rates may vary depending on how rural and urban are defined [Farmer et al., 1993]).
Juvenile homicide rates also differ substantially among states. Maryland led the nation in 1999 with a homicide rate of 7.8 per 100,000, followed by Illinois at 7.25 per 100,000. Hawaii and Utah had the lowest
TABLE 2.8 Death Rates for Selected Causes by Geographic Region (1999)
rates at 0.6 and 0.75 per 100,000, respectively7 (NCHS, 2001e). For homicide rates across all age groups, factors contributing to variations appear to include level of urbanization and socioeconomic conditions (see, e.g., Cubbin et al., 2000).
On a regional basis (Table 2.8), the South led the nation in infant mortality, homicides, and motor vehicle-related mortality rates for ages 15 to 19. The West Coast led in suicide rates for this age group. The Northeast region had the lowest death rates for all categories reported here.
Gender Differences
Across all age ranges and for most causes of death, boys have a higher death rate than girls. The disparity increases with age and ranges from a 20 percent higher death rate for male children less than 5 to a 130 percent greater death rate for older adolescent boys compared to girls (NCHS, 2001a).
Male gender is a major risk factor for all injury-related deaths (NPTR, 2001; Hussey, 1997). The most dramatic gender difference is seen in the homicide rate for older adolescents. Boys are more than five times as likely
to be victims of homicide than girls (1,748 boys aged 15 to 19 were killed compared to 345 teen girls in 1999 aged 15 to 19). Thus, homicide prevention efforts typically focus on young males. For those concerned about support for survivors, special attention to the psychological impact on young male siblings and friends of teen homicide victims may serve dual goals of support for the grieving and preventing further violence.
Socioeconomic and Ethnocultural Differences
A number of studies have examined the association between socioeconomic variables—including income, education, and social status—and variations in mortality among geographic areas and population subgroups (see, e.g., IOM, 2002). Nonetheless, the validity of racial categories and their relevance in clinical and health care research and decisionmaking are sometimes controversial.8 Concerns about the appropriate use of such categories without adequate attention to underlying differences in access to health care, poverty, and other factors are reasonable. Nonetheless, racial and ethnic disparities in health outcomes and health care access are troubling and cannot be ignored in health care research, planning, and delivery. For example, in addition to considering underlying sources of disparities and developing programs to counter them, advocates of palliative care must consider disparities in the help available to and desired by families for themselves and their children.
At all ages, the death rate for black children is higher than for white or Hispanic children. Even before birth, black fetuses have higher mortality rates than white fetuses. In 1998, the fetal mortality rate was more than twice as high for blacks as for whites (12.3 versus 5.7 per 1,000)9 (NCHS, 2001, Table 23).
In the United States, disparities in infant mortality rate are related to maternal variables such as the mother’s age, level of education, amount of prenatal care, marital status, or smoking habits and also differ depending on the infant’s age at death, sex, birth weight, or period of gestation. Nonetheless, even when adjusted for these risk factors, racial disparities in mortality remain (Guyer, 2000).
Black infants have a 150 percent higher mortality rate than white infants (1,456 compared to 577 deaths per 100,000 live births, respectively) (NCHS, 2001b). Puerto Rican, Hawaiian, and American Indian infants also experienced higher mortality rates than white infants (26, 33, and 55 percent higher, respectively) (Singh, 1995). In contrast, Chinese, Japanese, and Filipino infants had 30 percent, 23 percent, and 16 percent lower infant mortality rates, respectively, than white infants. Cuban, Central and South American, and Mexican infants had mortality rates that were 12 percent, 10 percent, and 6 percent lower, respectively, than those of whites (Singh, 1995).
Low birth weight is the primary cause of infant mortality in black infants and occurs at a rate of 280.9 per 100,000 live births compared to 72 per 100,000 for white infants.10 Infants born to black American women are more likely to have low birth weights than those born to either white American women or African-born black women in the United States, which suggests the role that social and cultural factors may play in this difference (Stoll and Kliegman, 2000a,b).
Over the past 50 years, infant mortality has declined at a relatively lower rate for black than for white infants (2.9 percent per year for the former compared to 3.2 percent per year for the latter [Singh and Yu, 1995]). The result is lower rates for both but a greater relative difference. Between 1964 and 1987, racial disparity in infant mortality generally increased across all levels of education and was wider at the highest levels of education (Singh, 1995).
A study of injury-related mortality attempted to identify socioeconomic factors linked to racial differences in injury rates (Hussey, 1997). When compared to white children, black children were twice as likely to live with a head of household who had not completed high school, more than four times as likely to live in a household in the lowest income bracket, almost four times as likely to live in a female-headed household, and almost three times as likely to live in an inner city. Of these socioeconomic factors, however, the educational attainment of the head of household was the single independent factor related to mortality of children related to injuries. When the head of household had less than a high school diploma, the injury-related death rate of children in the family was 3.5 times greater than for children living with a college-educated head of household. Income and other disparities interact to account statistically for almost two-thirds of the overall difference in injury-related death rates.
Older black children have higher death rates than whites for both injury-related and other causes of death (Table 2.9). For other causes of death, in 1999, HIV/AIDS was not among the top 10 among white children, but it ranked tenth among causes of death for black children 1 to 4 years old, seventh for those aged 5 to 14, and sixth for ages 15 to 24 (NCHS, 2001e).
The greatest disparity in death rates between races is seen in the adolescent homicide rate. Black adolescents between the ages of 15 and 19 years are killed at six times the rate for white adolescents (37.5 per 100,000 versus 5.7 per 100,000). In contrast, suicide and motor vehicle death rates are almost half again as high among white adolescents, ages 15 to 19, compared to black adolescents in this age group (8.6 per 100,000 versus 5.9 per 100,000 for suicide and 28.4 versus 18.2 per 100,000 for motor vehicle deaths) (NCHS, 2001e).
A number of factors appear to underlie racial differences in homicide rates including socioeconomic disparities and age structure of racial subgroups. For example, in a study of domestic homicides in black and white neighborhoods in New Orleans and Atlanta, Centerwall (1995) reported that differences in relative risk of homicide essentially disappeared when controlled for socioeconomic variables such as household crowding. As noted earlier, the United States has substantially higher homicide mortality for children than other developed countries, and explanations for this difference (and similar differences across all age groups) generally focus on handgun availability (CDC, 1997).
WHERE CHILDREN DIE
Based on analysis of 1997 national mortality data, more than 56 percent of child deaths (under age 19) occurred in inpatient hospital settings
TABLE 2.9 Deaths Due to Injury Compared to Other Conditions, by Age and Race (1999)
|
|
Injury Rate (number)a |
Other Conditions Rate (number)b |
||||
|
Age (years) |
Black |
White |
Black/White Ratio |
Black |
White |
Black/White Ratio |
|
1–4 |
27.4 (609) |
13.4 (1,605) |
2.0 |
30.6 (693) |
16.1 (1,936) |
1.9 |
|
5–9 |
14.8 (465) |
7.2 (1,129) |
2.1 |
13.2 (418) |
8.2 (1,278) |
1.6 |
|
10–14 |
13.8 (426) |
10.7 (1,650) |
1.3 |
13.9 (416) |
9.1 (1,385) |
1.5 |
|
15–19 |
69.6 (2,119) |
51.2 (8,009) |
1.4 |
22.9 (692) |
13.9 (2,156) |
1.6 |
|
aUnintentional and intentiona injuries. bAll noninjury causes. SOURCE: NCHS, 2001e. |
||||||
and another 16 percent in outpatient hospital sites (primarily the emergency department).11 Approximately 5 percent of children were declared dead on arrival at a hospital. Almost 11 percent of children died in home, and the site of death was unknown for a similar percentage. Only a tiny fraction of children (0.36 percent) died in nursing homes. For the population overall, an estimated 52 percent of deaths occurred in hospitals, 22 percent at home, and 21 percent in nursing homes. The percentage of those dying in nursing homes rises steeply with age, increasing from 11 percent among those aged 65 to 74 to 43 percent among those aged 85 or older.
For children who died of cancer in 1997, about 58 percent of deaths occurred in hospital inpatient units, about 36 percent occurred at home, and 2.8 percent occurred in hospital outpatient settings (see footnote 11). In contrast to these national data, a study at Boston Children’s Hospital and Dana-Farber Cancer Center found that of 103 child patients who died of cancer during the period September 1997 to August 1998, about half (49 percent) died in the hospital and about half died at home (Wolfe et. al., 2000b). Of those who died in the hospital, nearly half died in the pediatric intensive care unit (PICU) and an additional third in the oncology ward. Regional variations in medical practice, health care resources, urban or rural place of residence, and other factors could account for the different pattern in the national data.
A recent analysis of deaths of individuals less than 25 years old in Washington state from 1980 to 1998 found that 52 percent occurred in the hospital, 17 percent at home, 8 percent in the emergency department or during transport, and 22 percent at other sites (Feudtner et al., 2002). When only deaths from complex chronic conditions and only individuals between ages 1 and 24 were considered, the picture changes. Between 1980 and 1998, the proportion of these deaths occurring at home rose from 21 to 43 percent. Although those who resided in more affluent areas and those with congenital, genetic, neuromuscular, and metabolic conditions were more likely to die at home, considerable regional variation in site of death remained unexplained.
Nearly all SIDS deaths occur in the home. In contrast, most babies who die during the neonatal period never leave the hospital. Some die in the delivery suite shortly after birth; others die within hours to months after being transferred to the neonatal or pediatric intensive care unit. A few
|
11 |
This information was provided by Joan Teno, M.D., and Sherry Weitzen, M.H.A., Center for Gerontology and Health Care Research, Brown University, based on an analysis of a database of all deaths in 1997 reported to the National Center for Health Statistics. For more detailed information on site of death data, see http://www.chcr.brown.edu/dying/siteofdeath.htm. |
hospitals and hospices have worked together so that families, if they wish and the infant survives long enough after birth, can take infants with fatal conditions home, if only for a day or two before the child’s expected death (Sumner, 2001).
According to the National Pediatric Trauma Registry, the most common sites for injuries to children are the road (41 percent) and the home (31 percent). One study of children who died of injuries in an urban county during 1995 and 1996 found that most were pronounced dead at hospitals (although some of these deaths actually occurred outside the hospital) (Bowen and Marshall, 1998), but 10 percent of the children were pronounced dead at home and 4 percent on roads.
Although data are limited, children who die of complex chronic conditions such as AIDS, cystic fibrosis, and muscular dystrophy usually die in the hospital, typically following several earlier hospitalizations for crises that they survived. One multicenter study of children with AIDS who died reported that nearly 65 percent died in the hospital and almost one-quarter died at home (Langston et al., 2001). Another study of children with AIDS reported that nearly three-quarters died in the hospital, either in the pediatric ward (38 percent), the PICU (29 percent), or the emergency department (7 percent) (Oleske and Czarniecki, 1999). Forty percent of these children were orphans living in foster care, adoptive care, or with extended families prior to their deaths.
Clinicians from cystic fibrosis centers in Canada and the United States have reported that the majority of their patients with cystic fibrosis died in the hospital. Of the 45 patients who were reported to have died of the disease in Canada in 1995, 82 percent died in the hospital (Mitchell et al., 2000). A U.S. study, which examined 44 deaths over a 10-year period (1984–1993) in a children’s hospital, found that 43 of the children died in the hospital (5 in intensive care) and 1 died at home under hospice care (Robinson et al., 1997). The typical length of stay in the hospital prior to death was two to three weeks, with a range of several hours to several months.
Very few studies describe the deaths of children who suffer from other congenital or genetic conditions. Records of patients admitted to Helen House, the first pediatric hospice in England, between 1982 and 1993 indicate that the largest group of child patients (127 children, 41 percent) had a neurodegenerative disease. By the end of the study period, 77 (58 percent) of the children had died: 49 percent at home, 23 percent at Helen House, and 20 percent in the hospital (8 percent died in “other situations”) (Hunt and Burne, 1995). A very small Australian study indicated that six of the nine patients who died from muscular dystrophy and spinal muscular atrophy died in the hospital, some in the emergency department (Parker et al., 1999). The majority of children with congenital heart disorders die in
an intensive care setting, often after or while awaiting a heart transplant (Rees in Goldman, 1999).
Regardless of the specific cause of death, many patients who die in the hospital die in the PICU after a short hospitalization for an acute problem. In a study of a diverse set of 16 pediatric intensive care units, Levetown and colleagues (1994) found that of 5,415 consecutive admissions to the PICUs, 265 (5 percent) of the patients died. Of the group that died, 248 (94 percent) died in the PICU. The average length of stay in the PICU before death was 3 days (range 0 to 82 days), and the average total length of stay in the hospital prior to death was only 4 days (range 0 to 305 days). The majority (61 percent) of children who died in the PICU suffered from an acute condition such as brain damage due to lack of oxygen (for instance, in drowning), infection, and trauma. Thirty-five percent of the children who died in the PICU had chronic conditions such as congenital malformations, acquired neurologic problems, cancer, metabolic disease, immune deficiency, and respiratory disease. A recent Canadian study, which examined end-of-life care for children who died anticipated deaths (77 of 236 deaths) following admission to one hospital, reported that more than 80 percent died in intensive care (McCallum et al., 2000).
IMPLICATIONS
The profile of childhood death presented in this chapter has a number of implications for those providing or supporting care for children who die and their families. First, children who die and their families are clearly a diverse group. Many children die suddenly and unexpectedly from injuries. Many others die in infancy from complications of prematurity or congenital defects. Some children need care for a few days, whereas others, particularly those with severe neurological deficits, require care for years before death. Further, some children have conditions that are inevitably fatal, whereas other children die from conditions that may be survivable. These differences suggest that palliative and end-of-life care must be flexible if it is to meet child and family needs. Chapter 3 further illustrates the differences in the paths that lead to death in childhood and the different challenges presented by these varied pathways.
Second, unintentional and intentional injuries are important contributors to death in childhood. Emergency medical services dominate in these situations, but many children die before care arrives or without awareness of care. They leave shocked and bereft parents, siblings, grandparents, and others needing support in their bereavement.
Third, particularly for infants and very young children, a varied array of rare, fatal disorders generates a relatively small number of deaths individually, although collectively their impact is more significant. The combi-
nation of diversity and small numbers adds to the complexity of determining prognosis, recognizing the end stage of illness, assessing the appropriateness of shifts in the emphasis and goals of care, and helping children and their families prepare for death. Small numbers and diversity can also complicate the development of successful programs to provide and fund palliative and end-of-life care for children and their families. Further, the combination of these characteristics with children’s changing developmental needs suggests that palliative care and hospice programs designed for adults will require significant modifications to help children and their families.
Fourth, many important causes of death in childhood—including those due to injuries, low birth weight, and SIDS—are linked to socioeconomic disparities. In addition to encouraging preventive health services and other policies and programs to counter or reduce socioeconomic inequalities, advocates of pediatric palliative care need to consider how their programs can best serve disadvantaged and troubled families and how they can best identify the kinds of support desired by these families for themselves and their children.
Fifth, hospitals, especially their neonatal and pediatric intensive care units, play a particularly important role in care for children who die of complex chronic problems. Discussions of end-of-life care for older adults tend to emphasize practices and policies intended to allow more people to die at home without unwanted “rescue” efforts. Although similar efforts adapted to children and their families may be desirable, more flexible attitudes about the role of hospital care including intensive care at the end of life may be appropriate for this young population.
Sixth, no single protocol for palliative and end-of-life care will fit the varied needs of children who die and their families, and no single focus of research will build the knowledge base to guide such care. The diversity of circumstances and the relatively small numbers of child deaths will challenge researchers and policymakers as well as clinicians.
Chapter 3 builds on this chapter’s epidemiologic and quantitative focus by adding a more qualitative perspective on the pathways to death in childhood. It reinforces the conclusion that care for children who die and their families must be adjusted to their specific circumstances and needs, although the fundamental principles outlined in Chapter 1 will broadly apply.


