
10
Barriers to Research and Promising Approaches
Given its unique nature, research on suicide faces a series of obstacles that limit progress in the understanding, prevention, and treatment of the problem. Because the field is a conglomeration of several disciplines that grew up independently, issues of interdisciplinary research pose problems of communication, jargon, and disciplinary rivalries (see IOM, 2000). Furthermore, recruiting researchers to the field is difficult because of the many obstacles that the field faces, as discussed in this chapter. As indicated in Chapter 1, the terminology used among suicide researchers is inconsistent. Consequently, it is difficult to obtain reliable numbers about the incidence and prevalence of suicide and suicide attempts. Working with patients that present a risk of suicide presents ethical and safety concerns that can be difficult to resolve. Special measures must be taken to increase the statistical power of intervention and prevention studies, since suicide is a relatively infrequent event. These approaches range from using alternate endpoints such as suicidal ideation to finding ways to increase the size of the population under study. Each has limitations.
This chapter first explores the methodological issues that affect the collection of data. Next, it addresses the ethical and safety issues surrounding research protocols with suicidal participants. Statistical approaches to addressing some of these barriers are presented. Options for working with the limitation of suicide’s low base-rate are presented at various points in the chapter. Finally, the chapter presents a center-based approach that can be used to advance the study of suicide.
METHODOLOGY
Research on suicide is plagued with many methodological problems that limit progress in the field. Definitions lack uniformity, proximal measures are not always predictive of suicide, reporting of suicide is inaccurate, and its low frequency exacerbates all of these problems.
Terminology
There is a need for researchers and clinicians in suicidology to use a common language or set of terms in describing suicidal phenomena. Thirty years ago, NIMH convened a conference on suicide prevention at which a committee was charged with recommending a system for defining and communicating about suicidal behaviors (Beck et al., 1973). As a result of this committee’s work, operational definitions for basic terms such as suicidal ideation, suicide attempts, and completed suicide were proposed. Definitional issues were revisited in the mid-1990s at workshops held by the American Association of Suicidology, NIMH, and the Center for Mental Health Services, and through informal discussions among suicidologists (O’Carroll et al., 1996). Once again, the difficulties caused by lack of efficient communication and cross-talk were described, and a specific nomenclature with objective definitions of suicidal behaviors was proposed. Interestingly, many of the definitions proposed in this article were not appreciably different from those proposed for researchers more than a quarter of a century ago by the NIMH committee. Despite this seeming consensus, terminology continues to be an obstacle (see also Chapter 1). For example, “suicide attempt” does not uniformly include the intent to die. Since some who harm themselves do not actually intend to die (Linehan, 1986), assessing suicidal behavior is difficult. Not only are terms used differently across the field, they only infrequently are operationally defined in studies. Furthermore, often researchers do not reliably assess behavioral intent, since interviews can be unreliable (Linehan, 1997). Comparisons across studies also are complicated by differences in scales and instruments used to measure suicidality (see also Chapter 7). Many studies use only selected questions from questionnaires instead of the complete validated tool. Many of the studies do not report validity and reliability of instruments used.
Low Base-Rate Event
The base-rate of completed suicide is sufficiently low to preclude all but the largest of studies. When such studies are performed, resultant comparisons are between extremely small and large groups of individu-
als (suicide completers versus non-suicide completers, or suicide attempters versus non-suicide attempters). Use of suicidal ideation as an outcome can increase incidence and alleviate the problem to some extent; however, it is unclear whether suicidal ideation is a strong predictor of suicide completion. Using both attempts and completions can confound the analysis since attempters may account for some of the suicides completed within the study period. Because the duration of the prevention studies is frequently too brief to collect sufficient data on the low frequency endpoints of suicide or suicide attempt, proximal measures such as changes in knowledge or attitude are used. Yet the predictive value of these variables is unconfirmed. Statistical approaches (see Appendix A) and proximal endpoints may provide solutions, but a large population base is preferable.
Psychological Autopsy
A psychological autopsy is the reconstruction of the events leading up to the death; ascertainment of the circumstances of the death, including suicidal intent; and an in-depth exploration of other significant risk factors for suicide (Beskow et al., 1991; Brent et al., 1988; Brent et al., 1993; Cooper, 1999; Hawton et al., 1998; Kelly and Mann, 1996; Velting et al., 1998). The psychological autopsy is the standard approach to augmenting the information obtained from a death certificate. Information is gathered through a semi-structured interview with key informants, and discrepancies are resolved by re-interviewing informants and through a case conference using “best estimate” procedures (Mitchell, 1982). Among the key issues and risk factors addressed are:
-
Circumstances and method of suicide
-
Psychopathology
-
Family history of psychopathology and suicidal behavior
-
Social adjustments and functioning
-
Personality characteristics, especially aggression/impulsivity
-
Life stressors and supports, including religion
-
Characteristics of treatment, especially in the 90 days prior to death.
-
Physical health and medical history
-
Socioeconomic background and family constellation
-
Communication of suicidal intent
-
Other record linkage (birth records, child welfare, school, criminal justice)
Most studies have found that the optimal time to conduct this kind of investigation is between 2 and 6 months after the death. Informants’ emo-
tions may be too raw to conduct an extensive interview prior to 2 months after the death. Longer than 6 months after the death, many informants want closure on the suicide and no longer are willing to open up and discuss emotionally difficult topics. The quality of information, measured by the number of diagnoses generated, did not vary as a function of the amount of time since the death (Brent et al., 1988). Caution should be used when interpreting information gathered from friends and relatives; one experimental study found that subjects’ descriptions of psychological distress varied with characteristics of the deceased and aspects of the manner of death (Telcser, 1996). Use of a comparison group of individuals who died accidentally by similar means could strengthen validity of findings. In general, when case-control methods are used in psychological autopsy studies, the comparisons are made to individuals who died by natural causes matched on demographic variables or psychiatric diagnoses.
The psychological autopsy has many similarities to the Family History-Research Diagnostic Criteria or any other indirect interview. The interview is less informative than a direct interview (Andreasen et al., 1977; 1986) but improves with the number of informants. Certain informants may provide specific information that may not be available from others. For example, friends of adolescent suicide victims may be more aware of substance use and abuse than parents (Brent et al., 1988). Employers and co-workers may be able to describe the victim’s functional ability on the job; for younger victims, interview of teachers and review of school records may play an analogous role.
Certain types of information are very difficult, or even impossible, to obtain with a psychological autopsy approach. For example, sexual orientation is information that the victim may have been subliminally aware of, or may not have confided to a friend or parent. Information processing style, or other laboratory-based measures obviously cannot be obtained without the victim’s self-report. However, psychological autopsy studies can help to identify living individuals whose characteristics closely resemble suicide victims who can then be studied using more dynamic assessments.
Combining biological findings with information about psychopathology, personality, family history, treatment history, and history of family adversity may provide a much more complete picture about the neurobiology of suicidal behavior. For example, altered serotonin in the brain may be a consequence of adverse rearing environments (Kaufman et al., 1998; Kraemer et al., 1989; Pine et al., 1997), and may very well be a consistent finding across different mental disorders. Conversely, psychological autopsy data may allow for the selection of relatively homoge-
neous sub-samples that can be subjected to genetic analyses. Complementary concurrent methods with intense, highly focused ethnography can improve knowledge about setting, process, motivations, and outcome, and thereby increase validity of data.
SURVEILLANCE OF SUICIDE AND SUICIDE ATTEMPTS
To address suicide as a public health problem requires the sustained and systematic collection, analysis and dissemination of accurate information on the incidence, prevalence and characteristics of suicide and suicide attempts. Surveillance is a cornerstone of public health, allowing realistic priority setting, the design of effective prevention initiatives, and the ability to evaluate such programs (IOM, 1999). Official suicide rates have been used to chart trends in suicide; monitor the impact of change in legislation, treatment policies, and social change; and to compare suicides across regions, both within and across countries. In addition, suicide rates have offered a way to assess risk and protective factors for geographical areas (counties, states and countries). However, there exist serious inadequacies in the availability and quality of information. The sources of data that are currently available remain “fragmentary and unlinked” (Berman, 2001). The need for improved and expanded surveillance systems is highlighted as one of the central goals of the National Strategy for Suicide Prevention (PHS, 2001).
Completed Suicide: Sources of Variability in Suicide Statistics
The suicide rate information available on a national level is derived from state vital records systems that collect data from local death certificate registries. States forward the information to the National Center for Health Statistics of the CDC which maintains the National Vital Statistics System (Davies et al., 2001). The utility and accuracy of these data are constrained by the variability in suicides statistics. As described in Chapter 2, there are at least four sources of this variability (Jobes et al., 1987; O’Carroll, 1989), including:
-
regional differences in the definition of suicide and how ambiguous cases are classified
-
regional differences in the requirements and political arrangements for the office of coroner or medical examiner
-
differences in terms of the extent to which cases are investigated
-
variations that have to do with the quality of data management involved in preparing official statistics.
Ambiguous Cases
Classifications of deaths vary regionally (see also Chapter 6). Some jurisdictions, for example, require a suicide note in order to render a verdict of suicide, yet fewer than half of all suicide victims leave a note. Russian roulette deaths are called suicides in some jurisdictions but accidents in others (Keck et al., 1998). Religious traditions, life insurance policies, or actual legal sanctions may motivate underreports of suicide. Some jurisdictions tend to call any deaths with prominent intoxication an accident. All of these differences interfere in cross-site comparisons (Brent et al., 1987; McCarthy and Walsh, 1975).
The verdict of “undetermined” (also known as “open verdict” in the United Kingdom) harbors many unreported suicides, with estimates ranging from 50–100 percent of all undetermined cases being true suicides (Brent et al., 1987; Cavanagh et al., 1999; Holding and Barraclough, 1975; 1978; Ovenstone, 1973). Undetermined verdicts appear to be more likely if the victim is older, died by poisoning, and is female, perhaps because this profile may not fit the archetypal suicide completer (Ohberg and Lönnqvist, 1998; Ovenstone, 1973). Studies suggest that the official suicide rate underestimates the true rate by about 30 percent, but that time trends are unaffected by classification errors (Brent et al., 1987; Gist and Welch, 1989; Sainsbury and Jenkins, 1982).
There are other types of ambiguous cases that may be misclassified as accidents or homicides. For instance, some controversy exists about the degree to which vehicular deaths might be due to suicide (Jenkins and Sainsbury, 1980; Phillips and Ruth, 1993; Schmidt et al., 1977). “Victim precipitated suicides,” often in the context of “suicide by cop,” (Mohandie and Meloy, 2000; Wolfgang, 1958) are difficult to determine definitively, but may contribute to the underestimation of suicide. The availability of routine toxicology, physical evidence, autopsy, and psychological data can influence the classification of suicide. Larger jurisdictions may be able to investigate most comprehensively, making inter-jurisdiction comparisons unreliable (Nelson et al., 1978). Differential investigation by ethnic group and differences in willingness to share information with an investigator can also distort the picture of suicide.
Training and Background of Coroner/Medical Examiner
There are marked differences in the training and background of the persons who by law certify a death as a suicide among states within the United States (O’Carroll, 1989) and internationally (see also Chapter 6). In the United States, the qualifications range from simply having an interest in the job (e.g., Indiana) to specialized training in forensic pathology (e.g.,
Oklahoma). Medico-legal officials may be elected, appointed or serve exofficio (e.g., elected county sheriffs). Investigations may be centralized within a state (e.g., Rhode Island) or organized by each county (e.g., Utah). Each of these factors affects the nature, extent, and quality of the investigation and the classification of deaths as suicide.
Danish and English coroners differ significantly by their threshold for certification of suicide (Atkinson et al., 1975). Yet, one British study showed that changes in coroners (within a country) did not result in significant changes in certification practices (Sainsbury and Jenkins, 1982). While some have reported that examiners with a medical background are more willing to certify a suicide as such, others found that more highly trained medical examiners were more likely to classify a death as “undetermined” (Murphy et al., 1986; Pescosolido and Mendelsohn, 1986). More recent studies have suggested substantial variability between different coroners’ courts and even within courts (O’Donnell and Farmer, 1995). Furthermore, reported rates in countries that are predominantly Catholic, such as Ireland, may be artificially lower because of a greater stigma associated with suicide and consequent greater reluctance to certify a death as a suicide (Jobes et al., 1987; Myers and Farquhar, 1998). Similarly, the low rates of suicide reported by Muslim countries may reflect possible diagnosis or reporting bias due to stigma (Wasserman and Varnik, 1998). Ongoing concern exists about the lack of quality monitoring of the persistently idiosyncratic death certification process (Maudsley and Williams, 1996).
Local, State, and National Surveillance
National data provide perspective on the scale of the problem of suicide, and permit the evaluation of the impact of federal laws. Given the low-base rate of completed suicide, national level data are necessary to aggregate enough cases to identify patterns of suicide across populations. National data also allow for the analysis of variations in the suicide rate by regions of the country and by different environments (e.g., urban vs. rural). However, state and local data are essential in order to examine suicide as it occurs in specific communities. The map found later in this chapter (Figure 10.1) demonstrates how suicide rates can vary widely across relatively small geographical areas. Understanding which specific qualities of the areas and populations tend to influence the suicide rate is critical for designing programs to enhance protective factors and reduce risk factors. Since many suicide prevention programs are implemented in community and school settings, more precise data are needed at these levels to be able to evaluate their effectiveness, recognize what services
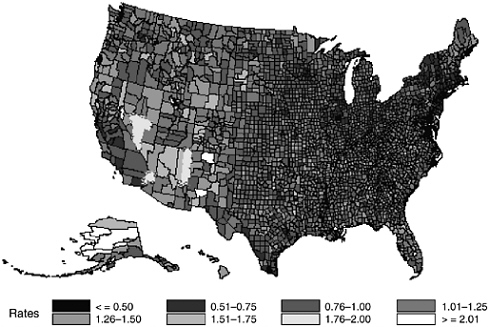
FIGURE 10-1. Bayes Estimates of County-Level Deviations from the National Annual Suicide Rates per 100,000 (1996–1998). Adjusted for Age, Sex, and Race.
may still be needed, and identify populations that have not been targeted. In addition, the evaluation of state and local policies and laws can only occur through state and local data collected over time.
There is no precedent for federal law to require the reporting of health conditions to the national government. However, state regulations frequently mandate that details of various diseases and conditions be reported to the Centers for Disease Control and Prevention (CDC). For example, confirmed diagnoses of tuberculosis and various sexually transmitted diseases including AIDS are required by law to be reported in all states (Bunk, 1997). In the case of AIDS reporting, the CDC encouraged the states to pass such statutes by requiring the existence of surveillance regulation in order to receive funding for state AIDS prevention and treatment programs (Gostin et al., 1997). Similarly, for suicide surveillance, data should be collected at the local and state levels in a standardized manner so that it can be aggregated for a national reporting system.
Fatality Analysis Reporting System (FARS)
The potential benefits of a state-based, national reporting system for suicides are great. Such systems have successfully been used to monitor the incidence and characteristics of public health concerns such as infectious diseases and motor-vehicle injuries. For example, the National Highway Traffic Safety Administration (NHTSA) maintains the longstanding Fatality Analysis Reporting System (FARS) to track the circumstances and incidence of motor-vehicle related deaths, which are similar to suicide in number (~40,000/year) (Barber et al., 2000; NHTSA, 2001). The system collects detailed information from the 50 states, the District of Columbia, and Puerto Rico within 30 days of the occurrence. A FARS report includes over 100 coded pieces of data on each crash and the vehicle and people involved (Davies et al., 2001). A state employed FARS analyst collects the required information from a variety of sources: police accident reports, state vehicle registration files, state driver licensing files, state highway department data, vital statistics death certificates, coroner/ medical examiner reports, hospital medical records and emergency medical service reports (NHTSA, 2001).
Since its inception in 1975, surveillance data from FARS has improved our understanding of motor-vehicle injuries and the state and federal laws that affect traffic safety. For example, FARS data and vital statistics data were used to assess the effects of establishing 21 (vs. 18) as the minimum age to purchase alcoholic beverages (Cook and Tauchen, 1984; GAO, 1987). Based on their results, a federal law was passed that made federal highway funding to states contingent upon the establishment of 21 as the minimum age for purchasing alcohol (Wagenaar, 1993), and this policy is estimated to have saved 16,513 lives between 1975 and 1996 (NHTSA, 1996).
National Violent Death Reporting System (NVDRS)
A National Violent Death Reporting System (NVDRS) has been designed by researchers at the Harvard Injury Control and Research Center to collect information on homicides and suicides as well as other firearm deaths. It is based on FARS and on a pilot called the National Violent Injury Statistics System (NVISS) (Azrael et al., 2001).
Currently 11 states and metropolitan areas are collaborating with NVISS to design and pilot test NVDRS. Ten sites have received grants from the project and collect data covering the states of Connecticut, Maine, Maryland, Michigan, Utah, and Wisconsin and in Allegheny County (PA), Miami-Dade County, metropolitan Atlanta, and San Francisco (HICRC, 2001). Legislation for Fiscal Year 2002 funding programs under the De-
partments of Labor, Health and Human Services, and Education (P.L. 107-116) included designated funding to the CDC’s National Center for Injury Prevention and Control of $1.5 million for continued planning and preliminary implementation of the NVDRS in selected states (AAST, 2002). It is estimated that a fully implemented system covering every state would require approximately $20 million per year (AAST, 2002).
NVDRS collects information from four sources: death certificates, coroner/medical examiner reports, police Uniform Crime Reports (and, in some jurisdictions, police incident reports), and crime laboratories (HICRC, 2001). This diversity of sources is expected to allay some of the quality of data limitations that exist due to the irregular information available from the medical examiner/coroner system (see above, and IOM, 1999). NVDRS will collect detailed information on both victims and offenders, including basic demographics, substance use, relationship to one another, the circumstances leading to the injury, whether the event occurred at their home or work, specific of the incidents (e.g., date and location), and weapon type. For suicide deaths, this information will be supplemented by data on physical and mental health, treatment status, and possible precipitating life stresses. In the case of firearm involvement, the weapon’s type, make, model, and caliber will also be collected, and for deaths involving under-age shooters, information regarding how the weapon was obtained will be sought (HICRC, 2001). The researchers and pilot sites have developed uniform data elements, reporting protocols, and software for the reporting system (NFFIRS Workgroup, 2001; NVISS Workgroup, 2002). These technical details are centrally important to the future success of implementing this system on a national level; other concerns that must be addressed include ongoing technical assistance and extensive training to ensure quality and consistency of data (Gallagher, 2001).
Surveillance of Attempted Suicides
The quality of the data on suicide attempts is even more tenuous than that of completed suicides. The concerns about nomenclature (Garrison et al., 1991; O’Carroll et al., 1996) and accurate reporting (PHS, 2001) apply here even more than with suicide deaths. There is neither systematic nor mandatory reporting of suicide attempts in the United States. The two major sources of data on suicide attempts comes from the National Comorbidity Survey conducted between 1990 and 1992 (Kessler et al., 1999) and the Epidemiological Catchment Area study conducted in the 1980s (Moscicki et al., 1988). Other epidemiological data on attempts are available from small surveys in localized areas. Risk factors for attempts,
especially clinical factors, are surveyed, but often not through population-based surveys that would avoid the bias and lack of generalizability of clinical populations (Feinstein, 1977). Most information regarding suicide attempts must be collected from data systems designed for other purposes (PHS, 2001). This section describes a few of the potential models and sources of information on suicide attempts: the National Electronic Injury Surveillance System, the Youth Risk Behavior Survey, and the Oregon State Adolescent Suicide Attempt Data System.
National Electronic Injury Surveillance System (NEISS).
The NEISS has been operated by the U.S. Consumer Product Safety Commission (CPSC) for almost 30 years. In 2000, the system was expanded to collect data on all injuries, and since 1992 NEISS has collected information on all nonfatal firearm-related injuries seen in NEISS emergency rooms (Annest et al., 1995; Davis et al., 1996); some of these incidences may represent suicide attempts. NEISS is based on injury data gathered from the emergency departments of 100 representative hospitals selected as a probability sample of all 5,300+ U.S. hospitals with emergency departments (EDs) (grouped into 5 “strata,” four representing EDs of differing sizes and one from children’s hospitals) (CPSC, 2001).
Given its current sampling system, the utility of NEISS is limited; the data can only be used for national estimates and are invalid at regional, state and local levels (GAO, 1997). In addition, because it does not use the International Classification of Diseases (ICD) coding system both the detail of data collected and the ease with which the data can be shared with other systems are limited (AdvanceMed, 2001).
Youth Risk Behavior Survey (YRBS).
The YRBS is managed by the CDC and includes national, state, territorial, and local school-based surveys of representative samples of students in grades 9–12 in participating jurisdictions. Its intent is to monitor risk behaviors associated with the leading causes of injury and death among adolescents (Kann et al., 1998). In 1997, the YRBS was conducted by 38 states, 4 territories and 17 large cities, in addition to the national-level representative survey (STIPDA, 1999). Concerns regarding the validity of self-reports presents particular problems for collecting information on suicide attempts by the YRBS (Ivarsson et al., 2002). In addition, some jurisdictions, especially less populous ones, choose not to include the items about suicidality out of concerns for liability and imitation. This introduces bias into the results when comparing geographical areas. How-
ever, given that some suicide attempts may never come to medical attention or result in hospitalization, self-report measures like YRBS remain a valuable source of information.
Oregon State Adolescent Suicide Attempt Data System (ASADS)
In 1987, Oregon became the only state with a law requiring the reporting of suicide attempts by youth under 18 to the state health department (Hopkins et al., 1995). Failure to comply with this regulation is a Class A misdemeanor; however, it has been unnecessary to charge any hospital thus far (personal communication, D. Hopkins, Oregon Department of Human Services, April 19, 2002). Oregon law also specifies that the treating hospital must refer attempters to “in-patient or out-patient community resources, crisis intervention or other appropriate intervention by the patient’s attending physician, hospital social work staff or other appropriate staff1”.
ASADS contains information such as demographics, date, county, method, place of attempt, living arrangement, psychological history, drug/alcohol use, previous attempt(s), reason(s), and seriousness and intent of attempt. Data are collected from emergency department records for all youth treated for a suicide attempt. Under-reporting is thought to occur. Training of staff and consistency of information is also an issue since only the information included in the patient’s medical chart can be collected. The system could be improved through better documentation by the health care provider (personal communication, L. Millet, Oregon Department of Human Services, April 22, 2002).
Limitations of the Model Systems
There exist many potential sources of information, but most often these are unlinked and in some cases represent redundant efforts. Most of what is available is based on hospitalization records or self-reports; however, studies have shown that injury surveillance based on hospitalization information alone may underestimate incidence by as much as 65 percent (Washington Department of Health, 1997). Currently, there is no systematic way of following repeat attempters over time. Elderly patients have among the highest rates of suicide completion, yet they are not included in some of the attempt surveillance systems that exist. Addi-
tional sources of information that could be consulted include emergency medical services data, school health services records, community and private health care providers data, etc. However, there are serious technical and practical limitations to integrating these sources.
Coding
External Cause of Injury codes (E-codes) were developed by the World Health Organization (WHO) as a supplemental code for use with the International Classification of Diseases (ICD). These codes provide a systematic way to classify diagnostic information that health care providers have entered into the medical record. They are standardized internationally and thus permit comparisons of data among communities, states, and countries (Educational Development Center, 1999). Since 1999 mortality data in the United States has been coded using the 10th Revision of the ICD (ICD-10), while morbidity data is coded using a clinical modification of the 9th Revision of the ICD (ICD-9CM) (Annest et al., 1998). ICD-10CM is currently being developed, and is expected to improve the specificity and accuracy for descriptions of non-fatal injuries (Annest et al., 1998). Currently, 26 states either mandate or have rates over 90 percent for use of E-codes in their Hospital Discharge Data Systems (ICRIN, 2001), and 11 states require their use in Emergency Department Data Systems (Annest et al., 1998).
The usefulness of E-codes for a surveillance system rests on the consistency of their use, and technical concerns regarding the compatibility of the format and type of different systems (CDC, 1995). For example, the number of permitted fields on reporting forms would need to be standardized since more than one field allows much more detailed and informative coding. The CDC is currently pilot-testing its National Electronic Disease Surveillance System (NEDSS), an initiative that will standardize public health data systems for infectious disease to allow integrated and electronically compatible national, state, and local surveillance systems. NEDSS also will support surveillance of other public health concerns including causes of injury (CDC, 2001b). In the future, use of a NEDSS compatible system will be a requirement for CDC surveillance funding of infectious diseases (CDC, 2001a). An ongoing international effort seeks to develop a new multi-axial classification system for external causes of injury which is intended to be used in both mortality and morbidity databases (Annest and Pogostin, 2000). Such a system needs to be compatible with existing data coding systems in order to maintain consistency of monitoring and to increase the feasibility of large-scale implementation (IOM, 1999).
Issues of Confidentiality
Surveillance systems are usually organized either by the name of the individuals, by a unique identification number, or by a record identification number for each incident. Each of these approaches presents methodological and ethical concerns. With a name-based system concerns of privacy and the possibility of reluctance to report could limit effectiveness and compliance. To avoid this, the Oregon ASADS system (discussed above) assigns a record number to each attempt (personal communication, D. Hopkins, Oregon Department of Human Services, April 19, 2002). Surveillance for HIV/AIDS provides a valuable precedent for use of a name-based system. The organization of the HIV/AIDS reporting system was and remains a highly contentious issue. This debate echoes a larger ongoing discussion regarding the privacy of health information in the computerized age. Unique identification numbers presented particular problems in pilot programs for expanding from AIDS to HIV/AIDS reporting with the recounting of cases at diagnosis and again with onset of the syndrome, and with incomplete reporting due to technical and operational difficulties (for review, see CDC, 1999). Critics of name-based systems cite concerns about the stigma of HIV/AIDS and the ensuing discrimination. Anecdotal evidence is cited that providing names would discourage individuals from getting tested. However, the CDC and six state health departments determined that rates of testing did not decrease when name-based testing was instituted (Nakashima et al., 1998).
Many of the same issues exist with suicide attempts, particularly with regard to tracking individuals over time. Because a previous suicide attempts is one of the strongest predictors of completed suicide, and repeat attempters are at higher risk for completed suicide, it is important to be able to track individuals over time.
All of these factors contribute to the tension that exists between the need for quality surveillance to promote the public’s health and an individual’s right to privacy. In the surveillance of many other health conditions (e.g., HIV/AIDS), state health departments remove identifying information prior to sending the data to the CDC for national reporting (CDC, 1995). The CDC also maintains specific administrative policies and technical program procedures to protect the security of both paper-based and electronic records. Reports are reviewed before public dissemination to ensure that potential individual identifiers are not released (CDC, 1995). Oregon’s ASADS does not collect identifying information such as the name or school of the attempter. In addition, data from ASADS are not released when there is a possibility of identification of a particular individual; more explicitly, data from a jurisdication are withheld if it reports fewer than 10 attempts or if the population at risk numbers less
than 50. There is limited staff access to the database, and they have not experienced any inappropriate releases of information (personal communication, D. Hopkins, Oregon Department of Human Services, April 19, 2002).
ETHICS AND SAFETY
Since suicide, by definition, involves intent to die, including people at risk of suicide in research on prevention and intervention presents a number of unique and complex ethical dilemmas. Ethical arguments can be made for both inclusion and exclusion of those at risk for suicide in clinical trials. Excluding suicidal participants has been standard industry practice for trials of psychoactive medicines in an effort to reduce the risk of death. On the other hand, excluding those at risk for suicide can be considered unethical since it precludes evaluation of treatments for this population. Furthermore, such screening is impractical since it is not possible to totally screen out people at risk for suicide.
Intervention research with suicidal patients is a complex and risky undertaking. The elements required for ethical intervention research with suicidal patients are similar to those for other types of clinical research: social and scientific value, scientific rigor and validity, fair participant selection, favorable risk–benefit ratio, independent review by a data and safety monitoring board, informed consent, and respect for potential and enrolled participants (Emanuel et al., 2000).
This section reviews the issues of informed consent and safe conduct of clinical trials and presents a statistical approach that can facilitate clinical research with suicidal participants.
Informed Consent
As reviewed earlier (Chapter 3), most suicide is associated with a diagnosis of a major mental disorder. The National Bioethics Advisory Commission (1998) recently issued a report providing guidelines for research on persons with impaired decision making that focused on those with mental disorders. Depression, for example, was included because of the resultant impairment in information processing (Hartlage et al., 1993), reasoning (Baker and Channon, 1995) and possibly decision making (Elliot, 1997; Lee and Ganzini, 1992). Before a person can consent to be part of a clinical trial, they must understand the purpose, the risks, and the possible benefits of the research (National Bioethics Advisory Commission, 1998). To give informed consent requires the ability to express choice, to understand, to reason, and to appreciate the relevance to oneself of the research and any intervention it entails (Appelbaum and Grisso,
1995). It has been argued that a depressed person might understand the risks of a research protocol but may not care about, or may even welcome, the risks. (Elliot, 1997). On the other hand, one might argue that a desperately ill cancer patient or a patient with end-stage cardiac disease awaiting mechanical assistance may be equally unconcerned about the risks. We have no direct data regarding the decision-making capacity of suicidal patients. For some people, as seen with depressed patients, the hopelessness and despair may impair their reasoning about risks and benefits. There is a clear need for empirical research to test hypotheses on the capacity of suicidal patients to give informed consent.
Some mental disorders are accompanied by fluctuating decision-making ability (like bipolar disorder) or by progressive impairment (such as Alzheimer’s dementia). It is important to note that suicidal ideation also fluctuates and that suicidal acts, especially in the young, are often impulsive (Brent et al., 1999; Hawton et al., 1982). There are alternatives to providing consent at the time of the clinical trial (National Bioethics Advisory Commission, 1998). These options include advance directives2 or the consent of a legally authorized representative. Another option is assent/ objection, which means that a person who may be partially impaired but still functional can enroll in a low-risk study from which he/she could withdraw at any time. Such approaches would be useful in studies with suicidal participants. Here, it may be appropriate and reasonable to utilize advance research directives or to reevaluate the patient’s understanding of the research at some point after the patient has entered the trial and is better able to understand, reason, and appreciate what is being asked of him/her.
In the absence of direct, empirical research on decision-making capacity in suicidal patients, additional safeguards to ensure safety and ethical conduct of research must entail involving family members or other surrogates. This is especially true in cases where there may be reduced capacity for consent such as with highly suicidal participants and/or members of special populations, including minors and elders, patients who are severely mentally ill or psychotic, and prisoners. Community consultation, the process of conferring with representatives who can adequately reflect the concerns of the prospective research participants, is also important under these circumstances. As risk rises, increased formality, objectivity, and documentation of capacity assessment and the informed consent process is wise.
No Undue Risk
Conducting clinical trials with suicidal patients involves managing risk at many levels and in many ways. As with all clinical trials, investigators need to take appropriate precautions to protect their participants in order to prevent exposure to unnecessary risk. Risk should not be greater than under ordinary, usual, or standard care. Commonly used precautions in clinical trials include frequent and ongoing team-based clinical monitoring of participants, an explicit protocol to follow in the face of acutely increased risk, the specification of rules for participant withdrawal (either temporarily or permanently), and the use of Data and Safety Monitoring Boards to assess: (1) the risk to benefit ratio for participants, (2) investigator adherence to protocol, and (3) the need for and appropriateness of study continuation versus termination (National Bioethics Advisory Commission, 2001). Other standards of protocol safety should include a process of informed consent and avoidance of coercion (see above), documentation of discussions about the clinical and protocol management of participants, adherence to national and local standards of care as appropriate, provision of a safety net for participants and their care givers, avoidance of conflict of interest on the part of investigators, and clarity about who pays the costs of care and injury (e.g., sponsor, institution, insurer; National Bioethics Advisory Commission, 2001). Finally, other risk reduction strategies may include experimental procedures such as the use of adaptive randomization,3 as well as early termination of a study when the null hypothesis has been disconfirmed. These practices are standard for all clinical trials and can apply to suicidal patients as well. To address some of these concerns, NIMH issued a report on “Issues to Consider in Intervention Research with Persons at High Risk for Suicidality” (Pearson et al., 2000).
One example of how safety and ethical concerns for patients at risk for suicide can be addressed in an intervention trial is the PROSPECT study (Reynolds et al., 2001). In this study, primary care practices are randomly assigned to either the intervention arm of the study (which utilizes depression care managers to improve the recognition and treatment of depression) or to the usual care arm of the practice (which provides screening and assessment services, but no treatment; treatment re-
mains the prerogative of the primary care physician [PCP]). Treatment as usual in older primary care patients has been linked to under-recognition of depression and elevated rates of suicide completion. Although treatment as usual is a necessary and credible control condition, the ethical requirement not to expose participants to undue risk requires that patients and their PCP’s be informed of the results of psychiatric assessments performed as part of the PROSPECT protocol. Thus, if a patient in a treatment as usual practice is found to have suicidal and/or homicidal ideation, the patient’s PCP is promptly informed, as are the patient’s caregivers. Although this type of information enhances what is actually and usually available in usual care, it is necessary to meet the ethical demand to do no harm by withholding such crucial information. At the same time, however, this ethically necessary practice potentially prejudices a fair test of the main study hypothesis (intervention practices will lower rates of suicidal ideation, hopelessness, and suicidal behavior to a greater extent than treatment as usual practices). Nonetheless, ethical issues inevitably attend the conduct of intervention studies addressing life and death issues like suicide and must be dealt with forthrightly.
Exclusion from Trials
Because of the concerns about death by suicide, however, people who exhibit suicidal behaviors are often excluded from clinical trials (Pearson et al., 2000). The practice of excluding these patients from trials limits the opportunity for this population to benefit from such research. The Food and Drug Administration’s (FDA) requirement to prevent undue risk is frequently noted as the reason for the exclusion. However, suicidal behavior is not expressly excluded by the regulations (personal communication, P. David, FDA, November 15, 2001).
Institutional review boards (IRBs)4 are charged with protecting participants in research trials to ensure that they are provided with all the information they need for informed consent, protected from unnecessary harm, provided with maximal benefit possible, and provided with appropriate (or usual) medical care if not part of the experimental arm of the protocol.5 All research protocols using human participants are required to
|
4 |
IRBs are comprised of at least five members who are primarily clinical and/or scientific professionals. The board must include at least one non-scientific member, often a legal professional or a clergy member. At least one person must be unaffiliated with the institution at which the work is being done. |
|
5 |
Protection of Human Subjects, Code of Federal Regulations, Title 45, Part 46 (1991). Available: http://ohrp.osophs.dhhs.gov/humansubjects/guidance/45cfr46.htm |
have IRB approval. In carrying out this charge, IRBs often require patients at risk for suicide to be excluded from trials (Ethical considerations, 2001). The concerns are that the participants’ risk exceeds their benefit and that the investigators and/or the treatment protocols are inadequate to monitor and address suicide (Pearson et al., 2000).
Excluding suicidal patients from clinical trials has serious repercussions. The number of studies that assess changes in suicidal behavior with new pharmacological treatments is extremely limited (Linehan, 1997). Treatments for suicidality have not been, for the most part, subject to controlled clinical trials. The evidence base for care is lacking. Linehan in 1997 could locate only 20 clinical trials that selected suicidal participants. Among the 13 outpatient studies in this list, 6 excluded those at high risk for suicide. These 6 studies showed no significant effects of experimental treatment. In contrast, 6 of the 7 remaining studies that included high-risk patients were able to demonstrate effectiveness of an intervention. This analysis clearly demonstrates how critical it is to include suicidal patients in a trial if we are to develop effective treatment protocols for those at risk.
As discussed in Chapter 3, suicide is, unfortunately, a medically expectable outcome of many mental illnesses. Death in a cancer clinical trial may be predictable, or even inevitable, but trials do not exclude terminally ill patients. Likewise, suicide attempts and completed suicide are also expectable, if unpredictable, events in severely mentally ill persons. One might logically reframe the perspective in this way: the outcome of suicide is a result of the mental illness, not the research or therapeutic intervention. Similarly, one might argue that a suicide attempt (or relapse) should not automatically exclude continuing participation, since it is necessary and desirable from a public health perspective to establish whether a particular intervention is effective in preventing further attempts or completed suicide in high-risk participants.
RESEARCH DESIGN AND ANALYSIS ISSUES
Statistical analysis and display of suicide data are complex problems, and there are many different approaches to their solution. This section considers several statistical issues in the design and analysis of studies of suicide. Many of the issues presented are well known in the suicide literature (e.g., estimating prevalence) whereas some are new to the study of suicide (e.g., use of empirical Bayes estimates in studying geographic variation in suicide rates). Throughout the chapter, a distinction is made between the analysis of suicide rates, where the unit of observation is typically a geographic area (e.g., a county) and the analysis of suicide as an outcome where the unit of analysis is an individual. The section dis-
cusses 1) the problem of computing lifetime risk of suicide and describes an appropriate methodology, 2) the problem of identifying suicide clusters, 3) statistical approaches that can inform suicide research, and 4) issues in the design of suicide studies. These issues include, case-control studies, risk-based allocation, and sample size and statistical power. Technical details of the statistical models are presented in Appendix A. The methods described here are by no means an exhaustive list of potentially useful approaches in the analysis of suicide data. It is hoped that these examples will provide a perspective on the power of appropriate statistical methodologies in suicide research.
Lifetime Risk of Suicide
Based on the work of Guze and Robins (1970), much of the psychiatric literature purports that 15 percent of depressed patients will die by suicide. To better understand the foundation of this estimate it is important to understand the various ways in which lifetime risk can be computed. In the case of Guze and Robins (1970), lifetime risk is defined as the proportion of the dead who died by suicide, often termed “proportionate mortality” (see also Goodwin and Jamison, 1990). As pointed out by Bostwick and Pankratz (2000), proportionate mortality is a reasonable estimator of lifetime risk only when the participants are followed until death. In general, however, the studies synthesized in the report by Guze and Robins, typically followed patients for no more than a few years. Furthermore, the participants were hospitalized psychiatric patients, often hospitalized as a precaution for suicide. Both this selection effect and the use of proportionate mortality as an estimator of lifetime risk, lead to an increase in the estimated lifetime prevalence. To obtain a more accurate assessment, Inskip, Harris, Barraclough (1998) calculated percent death by suicide to percent dead overall in a large number of studies. Analyses were stratified by diagnostic group (alcohol dependence, affective disorder, schizophrenia). Unfortunately, the majority of these studies had overall mortality rates of less than 50 percent, so the estimates of lifetime risk (i.e., 100 percent mortality) were extrapolated from the available data. Nevertheless, the lifetime suicide risk estimates were 7 percent for alcohol dependence, 6 percent for affective disorder, and 4 percent for schizophrenia.
In the most statistically rigorous approach to date, Bostwick and Pankratz (2000) compared proportionate mortality to “case fatality prevalence,” which is the number of suicides divided by the total number of patients at risk. Based on a synthesis of 29 studies of hospitalized affective disorder inpatients (19,723 patients), the pooled estimate of proportionate mortality prevalence was 20.0 percent, but only 4.1 percent for case fatal-
ity prevalence. As one might expect, in outpatients the rate for case fatality prevalence decreased to 2.0 percent in the analysis of 7 studies of 7,444 affective disorder outpatients. In contrast, the rate actually increased slightly to 24.6 percent for proportionate mortality prevalence.
Bostwick and Pankratz (2000) computed lifetime risk of suicide, using Bayes theorem, as the probability of suicide given death times the probability of death. For example, the overall probability of death in the 29 studies of affective disorder inpatients was 20 percent and of those, 20 percent died by suicide. The product of these two probabilities (i.e., the conditional probability of suicide given death and the prior probability of death) is the Bayes estimate of lifetime risk, which in this case is 4 percent. The Bayes estimate is remarkably close to the case fatality prevalence of 4.1 percent. This finding was consistent for all of the groups examined in their study (affective disorder outpatients = 2.2 percent, affective disorder inpatients = 4.0 percent, Guze and Robins data = 4.8 percent, Goodwin and Jamison data = 3 percent, and the general population = 0.5 percent).
Suicide Clustering
Suicidal behavior in adolescents is a major public health problem (NCHS, 1988). Data suggest that teen suicides often occur in temporal and geographic proximity of one another. This phenomenon is not unlike the concept of an outbreak of a disease in a particular community. Naturally, some clustering of suicides occurs by chance alone even if suicides occur at random. In the study of suicide clusters, the goal is to determine whether or not the outbreaks are occurring to an extent greater than would be expected by chance variation. Past studies have used various populations, such as psychiatric in-patients, high school and college students, marine troops, prison inmates, religious sects etc. (Gould et al., 1990). However, county of residence may be a more sensitive space unit to define a cluster (Gould et al., 1990).
Several statistical methods have been used to detect and statistically assess the time-space clustering of disease (see Gould et al., 1990). The Ederer-Myers-Mantel method (Ederer et al., 1964) is found to be sensitive to temporal clustering as well as time-space clustering. A method proposed by Knox (1964) considers all possible pairs of cases and the time and space distances between them. It establishes clustering by demonstrating a positive relation between the time and space distances of a pair, but required specification of the critical values for time and space to define closeness. This approach was modified by Smith (1982) to define “close in space” as occurring within the same geographic area. Wallenstein and colleagues (1989) provided a formula to assess the practical significance of clusters as well as the statistical significance. Gibbons et al. (1990)
took this further to decompose the overall distribution of suicide rates into a mixture of two Poisson distributions, the first to characterize the normal rate and the second to characterize the elevated rate, possibly due to one or more “suicide epidemics.” When they fit the model to 10 years (1977–1987) of monthly suicide rate data from Cook County (Chicago area), they found no evidence for a contribution of the second distribution. However, as described in Appendix A, using this analysis on the spatial distribution of suicide has identified qualitatively distinct geographic groupings of suicide rates across the United States. During the past decade, statistical research on finite mixture distributions has developed greatly (for review, see Böhning, 1999) and holds great promise for application to suicide. Appendix A describes the general statistical theory and developments.
Statistical Models for Assessment of Suicide Rates
Poisson Regression Models
In the analysis of suicide rate data, Poisson regression models are a natural choice. With this approach, the data are modeled as Poisson counts whose means are expressed as a function of covariates. For example, the data may consist of yearly county-level suicide rates, broken down by age, sex, and race for that year. For these type of rate estimates a fixed-effects model is usually used. When there is a mixture of fixed (e.g., age, sex, and race) and random effects (e.g., unobservable county-specific effects), the more general mixed-effects Poisson regression model is used. In the case of suicide, the rates are considered to be nested within geographic locations (e.g., counties) and can represent multiple rates obtained over time (e.g., yearly suicide rates for a given county) or rates for different strata within a given county (e.g., males and females) or both. The random effects would modify the rate for each county from the population average.
Often, it is of interest to estimate values of the random effects within a sample. In the present context, these estimates would represent the deviation of the suicide rate for a given county from the national mean suicide rate, conditional on model covariates such as age, race, and sex, which may be either fixed or random effects. This can be done by using an empirical Bayes estimator of cluster-specific effects.6 Thomas et al. (1992)
have used this kind of analysis to describe hospital mortality rates where cluster-specific (hospital-specific) effects represent how much the death rates for patients at a particular hospital differ from the national rates for patients with the same covariate values (i.e., matched patients). Longford (1994) provides extensive references to applications involving empirical Bayes estimates of random effects.
An alternative approach to the analysis of suicide rate data is based on Generalized Estimating Equations (GEEs) models, which were introduced by Liang and Zeger (1986) and Zeger and Liang (1986). The GEE method models the marginal expectation (i.e., average response for observations having the same covariates) of outcomes as a function of the explanatory variables. In this approach, the coefficients measure differences in the average response for a unit change in the predictor; in contrast the mixed-effect model produces predictions that are cluster-specific. An important property of the GEE method is that the parameter estimates are consistent even if the working correlation matrix is misspecified as long as the model for the mean is correct. A disadvantage of GEE is that it does not provide cluster-specific (e.g., county-level) suicide rate estimates adjusted for case mix (i.e., covariate effects). Appendix A outlines the statistical foundations of both fixed-effects and mixed-effects Poisson regression models, as well as the alternative approach based on GEE.
To illustrate how Poisson regression models can be used to estimate the effects of age, race, and sex on clustered (i.e., within counties) suicide rate data, this example considers the effects of age divided into five categories (5–14, 15–24, 25–44, 45–64, and 65 and older), sex, and race (African American versus Other) in the prediction of suicide rates across the United States for the period of 1996–1998. These categories were used so that there would be sufficient sample sizes available to compare observed and expected annual suicide rates for both GEE and mixed-effects Poisson regression models. In general, the GEE and mixed effect parameter estimates were remarkably similar.
Table 10-1 displays observed and expected annual suicide rates for both methods of estimation, broken down by age, sex, and race calculated from the parameter estimates. Inspection of Table 10-1 reveals several interesting results. In general, suicide increases with age, is higher in males, and is lower in African Americans. Black females have the lowest suicide rates across the age range. In non-Black males, the suicide rate increases with age whereas in all other groups, the suicide rate either is constant or decreases after age 65. Comparison of the expected frequencies for the GEE and mixed-effects models reveal that they are quite similar and the GEE does a slightly better job of predicting the observed rates.
A special feature of the mixed-effects model is the ability of estimating county-specific rates using empirical Bayes estimates of the random
TABLE 10-1 Observed and Expected Suicide Rates by Age, Race, and Sex
|
Age Group |
Race |
Sex |
Number of Suicides |
Population |
Observed Rate |
Expected Ratea |
Expected Rateb |
|
05–14 |
Black |
Male |
79 |
9,256,227 |
0.000009 |
0.000010 |
0.000009 |
|
05–14 |
Black |
Female |
28 |
8,978,221 |
0.000003 |
0.000003 |
0.000002 |
|
05–14 |
Other |
Male |
620 |
50,356,003 |
0.000012 |
0.000014 |
0.000012 |
|
05–14 |
Other |
Female |
206 |
47,847,778 |
0.000004 |
0.000005 |
0.000004 |
|
15–24 |
Black |
Male |
1,333 |
8,389,386 |
0.000159 |
0.000177 |
0.000160 |
|
15–24 |
Black |
Female |
191 |
8,352,196 |
0.000023 |
0.000024 |
0.000021 |
|
15–24 |
Other |
Male |
9,482 |
47,906,710 |
0.000198 |
0.000222 |
0.000198 |
|
15–24 |
Other |
Female |
1,673 |
45,396,608 |
0.000037 |
0.000042 |
0.000037 |
|
25–44 |
Black |
Male |
2,546 |
15,274,935 |
0.000167 |
0.000184 |
0.000164 |
|
25–44 |
Black |
Female |
474 |
17,191,095 |
0.000028 |
0.000033 |
0.000030 |
|
25–44 |
Other |
Male |
27,209 |
109,106,670 |
0.000249 |
0.000283 |
0.000250 |
|
25–44 |
Other |
Female |
6,977 |
108,864,081 |
0.000064 |
0.000072 |
0.000064 |
|
45–64 |
Black |
Male |
861 |
7,741,680 |
0.000111 |
0.000124 |
0.000111 |
|
45–64 |
Black |
Female |
224 |
9,633,227 |
0.000023 |
0.000026 |
0.000023 |
|
45–64 |
Other |
Male |
17,358 |
72,740,945 |
0.000239 |
0.000267 |
0.000239 |
|
45–64 |
Other |
Female |
5,307 |
76,289,629 |
0.000070 |
0.000078 |
0.000070 |
|
65+ |
Black |
Male |
415 |
3,295,133 |
0.000126 |
0.000142 |
0.000131 |
|
65+ |
Black |
Female |
83 |
5,140,632 |
0.000016 |
0.000014 |
0.000013 |
|
65+ |
Other |
Male |
14,074 |
38,889,596 |
0.000362 |
0.000398 |
0.000361 |
|
65+ |
Other |
Female |
2,814 |
55,229,051 |
0.000051 |
0.000057 |
0.000051 |
|
aMixed-effect model bGEE model |
|||||||
effects as described in the previous section. This allows an estimate of county-specific, expected suicide rates, which directly incorporate the effects race, sex, and age of that county. Table 10-2 provides a comparison of observed and expected numbers of suicides (1996-1998) for 100 randomly selected counties. Inspection of Table 10-2 reveals remarkably close agreement between observed and expected numbers of suicides.
This approach also allows the use of Bayes estimates directly to obtain county-level suicide rates adjusted for the effects of race, sex, and age. For example, a Bayes estimate of 1.0 represents an adjusted rate that is equal to the national rate, while a Bayes estimate of 2.0 represents a doubling of the national rate, and a Bayes estimate of 0.5 represents one-half of the national rate. Figure 10-1 (found on page 382) displays the Bayes estimates by county across the United States and reveals that even after accounting for these important demographic variables, considerable spatial variability remains. This map provides a useful tool for qualitative research into the etiology of suicide through an assessment of the spatial
TABLE 10-2 Observed and Expected Number of Suicides for 100 Randomly Selected Counties
|
State |
County |
Observed # of Deaths |
Expected # of Deaths |
State |
County |
Observed # of Deaths |
Expected # of Deaths |
|
56 |
7 |
16 |
10.3 |
51 |
75 |
5 |
5.9 |
|
53 |
63 |
169 |
170.4 |
20 |
159 |
6 |
4.5 |
|
5 |
91 |
14 |
13.6 |
21 |
103 |
14 |
8.7 |
|
47 |
111 |
13 |
9.4 |
40 |
45 |
1 |
1.6 |
|
54 |
93 |
1 |
2.8 |
31 |
61 |
1 |
1.5 |
|
28 |
5 |
9 |
5.5 |
31 |
91 |
0 |
0.3 |
|
27 |
141 |
22 |
21.7 |
40 |
73 |
9 |
6.3 |
|
38 |
47 |
0 |
1.0 |
20 |
203 |
1 |
1.0 |
|
21 |
59 |
25 |
27.5 |
1 |
5 |
8 |
8.2 |
|
48 |
451 |
54 |
50.2 |
38 |
51 |
0 |
1.4 |
|
48 |
87 |
3 |
1.4 |
38 |
39 |
2 |
1.3 |
|
18 |
97 |
391 |
385.3 |
21 |
95 |
11 |
12.0 |
|
35 |
7 |
8 |
6.2 |
48 |
73 |
32 |
25.8 |
|
48 |
383 |
2 |
1.5 |
23 |
11 |
38 |
39.6 |
|
31 |
41 |
3 |
4.3 |
55 |
101 |
58 |
59.5 |
|
18 |
7 |
2 |
3.4 |
17 |
107 |
9 |
10.8 |
|
45 |
61 |
6 |
5.9 |
47 |
127 |
1 |
1.9 |
|
19 |
1 |
4 |
3.4 |
55 |
55 |
28 |
28.1 |
|
8 |
119 |
13 |
9.9 |
21 |
223 |
5 |
3.4 |
|
36 |
3 |
22 |
20.9 |
30 |
97 |
1 |
1.4 |
|
19 |
93 |
2 |
2.9 |
19 |
51 |
2 |
3.0 |
|
12 |
95 |
303 |
314.1 |
47 |
129 |
4 |
6.4 |
|
49 |
49 |
89 |
91.1 |
48 |
9 |
2 |
3.0 |
|
28 |
45 |
30 |
24.1 |
19 |
5 |
9 |
6.7 |
|
18 |
107 |
19 |
16.9 |
28 |
69 |
3 |
3.0 |
|
5 |
1 |
6 |
6.8 |
46 |
19 |
6 |
4.1 |
|
17 |
167 |
64 |
64.8 |
27 |
171 |
31 |
30.8 |
|
39 |
89 |
43 |
44.7 |
28 |
53 |
1 |
2.4 |
|
28 |
1 |
9 |
9.5 |
20 |
31 |
2 |
3.1 |
|
53 |
23 |
0 |
0.9 |
51 |
47 |
18 |
15.0 |
|
48 |
213 |
30 |
28.8 |
46 |
123 |
3 |
2.7 |
|
55 |
107 |
9 |
7.1 |
12 |
81 |
135 |
129.6 |
|
31 |
177 |
6 |
6.7 |
2 |
122 |
22 |
20.4 |
|
17 |
49 |
12 |
12.2 |
21 |
61 |
0 |
3.4 |
|
55 |
75 |
18 |
17.5 |
21 |
25 |
7 |
6.3 |
|
8 |
55 |
3 |
2.7 |
26 |
13 |
6 |
4.0 |
|
29 |
121 |
4 |
5.4 |
18 |
157 |
42 |
44.1 |
|
40 |
125 |
34 |
30.2 |
21 |
165 |
2 |
2.2 |
|
20 |
73 |
3 |
3.2 |
48 |
447 |
2 |
0.8 |
|
21 |
109 |
7 |
5.5 |
13 |
265 |
3 |
0.6 |
|
29 |
197 |
2 |
1.8 |
2 |
100 |
2 |
1.0 |
|
51 |
133 |
7 |
5.0 |
55 |
11 |
4 |
5.2 |
|
29 |
105 |
8 |
10.0 |
48 |
81 |
0 |
1.3 |
|
47 |
181 |
14 |
9.7 |
21 |
229 |
6 |
4.6 |
|
51 |
103 |
9 |
5.5 |
55 |
35 |
32 |
32.3 |
|
16 |
15 |
3 |
2.2 |
39 |
151 |
112 |
113.5 |
|
38 |
55 |
2 |
3.5 |
28 |
89 |
17 |
18.4 |
|
39 |
17 |
91 |
93.6 |
19 |
167 |
4 |
8.2 |
|
55 |
51 |
3 |
2.8 |
23 |
27 |
17 |
15.7 |
|
19 |
119 |
3 |
4.2 |
38 |
1 |
0 |
1.1 |
distribution of Bayes estimates for outliers. For example, in the western continental United States and Alaska where suicide rates are typically high, a few counties have Bayes estimates consistent with the national average. Similarly, in the central United States where there is a high concentration of counties with the lowest suicide rates, a few counties exhibit the highest suicide rates. What are the risk and protective factors that have produced these spatial anomalies? Are these spatial anomalies simply due to reporting bias or some other unmeasured characteristic? Based on a review of the literature, it does not appear that this type of statistical approach to this problem has been previously considered. Examining these spatial anomalies in greater detail is a fruitful area for further research.
Mixed-effects Ordinal Regression Models
To study suicidal ideation, attempts, and completion in individual participants under various conditions, mixed-effects ordinal and nominal regression models can be used. The basic concept is to develop an ordinal scale of suicidal behavior, ranging from no suicidal ideation, low, medium, and high suicidal ideation, suicide attempt, and ending at suicide completion. Several authors have described models including both random and fixed effects (e.g., Agresti and Lang, 1993; Ezzet and Whitehead, 1991; Harville and Mee, 1984; Hedeker and Gibbons, 1994; Jansen, 1990; Ten Have, 1996). Statistical details are presented in Appendix A.
A reanalysis of the longitudinal data from Rudd et al. (1996) on suicidal ideation and attempts in a sample of 300 suicidal young adults (personal communication, Dr. M. David Rudd, Professor of Psychology, Baylor University) serves as an illustration of an application of the mixed-effects ordinal logistic regression model. In the original study, 180 participants were assigned to an outpatient intervention group therapy condition and 120 participants received treatment as usual. This re-analysis assigns the ordinal outcome measure of 0=low suicidal ideation, 1=clinically significant suicidal ideation, and 2=suicide attempt. Suicidal ideation was defined as a score of 11 or more on the Modified Scale for Suicide Ideation (MSSI, Miller et al., 1986). Model specification included main effects of month (0, 1, and 6) and treatment (0=control, 1=intervention), and the treatment by month interaction. Although data at 12, 18 and 24 months were also available, the dropout rates at these later months were too large for a meaningful analysis. In addition, to illustrate the flexibility of the model, depression as measured by the Beck Depression Inventory (BDI, Beck and Steer, 1987) and anxiety as measured by the Millon Clinical Multiaxial Inventory (MCMI-A, Millon, 1983) were treated as time-varying covariates in the model, to relate fluctuations in depressed
mood and anxiety to shifts in suicidality. Details of the analysis are in Appendix A.
Briefly, the analysis reveals that both of the time-varying covariates, depression and anxiety, were significantly associated with suicidality. By contrast, the treatment by time interaction was not significant, indicating that the intervention did not significantly effect the rate of suicide ideation or attempts over time. Treatment was found to be ineffective even after excluding the effects of anxiety and depression, which could mask treatment and treatment by time interactions. The random month effect was significant, indicating appreciable inter-individual variability in the rates of change over time.
Interval Estimation
Three types of statistical intervals, confidence intervals, prediction intervals, and tolerance intervals, can provide information relevant to suicide. A confidence interval can be used to describe our uncertainty in the overall suicide rate. A prediction limit can estimate an upper bound on a future rate. A statistical tolerance limit can set an upper bound on a specified proportion of all future monthly or yearly suicides incidences, with a specified level of confidence. General discussion of Poisson confidence, prediction, and tolerance limits are presented in Hahn and Meeker (1991) and Gibbons (1994), and in Appendix A.
As an example, consider the case in which after 61 months of observation for a particular county, with a population of 100,000 people, 123 suicides are recorded. The 95 percent confidence interval for the true population suicide rate is between 1.659 and 2.373 suicides per month per 100,000 (details of this computation are provided in Appendix A). In contrast, a 95 percent upper prediction limit for the actual number of suicides in the next month is 4 suicides. Finally, to have 95 percent confidence that the limit will not be exceeded in 99 percent of all future months (not just the next single month), the 95 percent confidence 99 percent coverage tolerance limit is 7 suicides per month (see Appendix A for computational details). These calculations are useful to determine if an event (e.g., a television program about teen suicide) has an impact on suicide rates. If the number of suicides in the month following the event exceeds the calculated prediction (in the example, 4 suicides), then the television program may have been related to an increase in the suicide rate that is inconsistent with chance expectation based on the previous 61 months of data. If the tolerance limit is exceeded (in the example 7 suicides in the month), there is evidence that the rate is beyond chance expectations given the 61 months of historical data. The advantage of the
tolerance limit over the prediction limit is that the tolerance limit preserves the confidence level over a large number of future comparisons, whereas the prediction limit applies to a single future time period. Complete computational details are provided in Appendix A.
Study Design Issues
The following sections touch on some experimental design issues that may be useful in future studies of suicide either at the level of the individual or at the population level.
Case-Control Studies
Retrospective case-control studies are often used to examine risk factors of completed suicide. Logistic regression is typically the standard method for analysis of these case-control studies where multiple risk factors are assessed. For low-base rate conditions such as suicide, risk factors such as previous suicide attempts are often not seen in matched controls. For example, in a study by Brent et al. (1999) that attempted to relate past suicide attempts to completed suicide in female adolescents, 13 of 21 completed suicides, but none of the 39 controls, had a previous suicide attempt. The problem has been termed “complete separation” by Hosmer and Lemeshow (1989). As a consequence, parameter estimation becomes difficult and often the logistic regression model fails to converge. Some investigators (e.g., Shaffer et al., 1996) have simply eliminated previous attempts as a predictor. Chen, Iyengar, and Brent (unpublished) developed a hybrid model to handle the case of zero cells caused by variables like previous suicide attempts. The model is essentially a mixture of a standard logistic regression model estimated from both cases and controls and a risk estimate for previous attempts (or some other low-rate risk factor), which is the conditional probability of suicide given a past attempt. Parameters are estimated by subtracting the risk attributable to previous attempts from the overall risk and then modeling the residual risk over the rest of the risk factors using a logistic regression model. Innovative statistical approaches such as this are needed to deal with some of the special problems associated with the modeling of low-rate events such as completed suicide.
Risk-Based Allocation
Risk-based allocation, a non-randomized design could be quite useful in the study of suicide. It allows participants at higher risk, or with greater disease severity, to benefit from the potentially superior experimental
treatment, assuring that all of the sickest patients will receive the experimental treatment. Consequently, the design is sometimes called an “assured allocation” design (Finkelstein et al., 1996a; 1996b). Because the design is non-randomized, it should only be considered in those situations where a randomized trial would not be possible.
The design first requires a quantitative measure of risk, disease severity, or prognosis, which is observed at or before enrollment into the study, together with a pre-specified threshold for receiving the experimental therapy. All participants above the threshold receive the experimental treatment, while all participants below the threshold receive the standard treatment. The risk-based design also requires a prediction of what the outcomes would have been in the sicker patients if they had received the standard treatment. One example of such a model might be an appropriate regression model of the relationship between pre-treatment suicidal ideation on post-treatment suicidal ideation in a group of depressed patients treated with the standard antidepressant therapy. The validity of this model can then be tested by comparing the observed and predicted levels of the of suicidal ideation in the low-risk control participants that were given the standard treatment. This is the basis of another novel feature of the risk-based design: to estimate the difference in average outcome between the high-risk participants who received the experimental treatment, compared with what the same participants would have experienced on the standard treatment.
The model for the standard treatment (but only the standard treatment) needs to relate the average or expected outcome to specific values of the baseline measure of risk used for the allocation. Because the parameters of the model will be estimated from the concurrent control data and extrapolated to the high-risk patients, only the functional form of the model is required, not specific values of the model parameters. This offers a real advantage over historical estimates. All one needs to assume for the risk-based design is that the mathematical form of the model relating outcome to risk is correctly specified throughout the entire range of the risk measure. This is a strong assumption, to be sure, but with sufficient experience and prior data on the standard treatment, the form of the model can be validated.
The risk-based allocation clearly creates a “biased” allocation and, obviously, the statistical analysis appropriate to estimate the treatment effect is not the simple comparison of mean outcomes in the two groups, as it would be in a randomized trial. Instead, the theory of general empirical Bayes estimation can be applied (Robbins, 1993; Robbins and Zhang, 1988; Robbins and Zhang, 1989; Robbins and Zhang, 1991). There are several cautions to observe. The population of participants entering a trial with risk-based allocation should be the same as that for which the model
was validated, so that the form of the assumed model is correct. Clinicians enrolling patients into the trial need to be comfortable with the allocation rule, because protocol violations raise difficulties just as they do in randomized trials. Finally, the standard error of estimates will reflect the effect of extrapolation of the model predictions for the higher-risk patients based on the data from the lower-risk patients. Because of this, a randomized design with balanced arms will have smaller standard errors than a risk-based design with the same number of patients.
Sample Size Considerations
When designing studies for low-base rate events, such as suicide incidence, attempts, and ideation, statistical power considerations can lead to studies with quite different sample size requirements. The lower the base-rate and the greater the need for precision, the larger the population size necessary to achieve significance. In addition, large samples are required to increase the confidence limits. Table 10-3 provides a summary of required sample sizes for computing incidence rates and corresponding levels of precision, with three levels of confidence. For a 90 percent confidence interval for a rate of 10 per 100,000 (plus or minus 5 per 100,000), approximately 100,000 participants are needed. By contrast, if the assessment is in a high-risk population where the mean incidence is 50 per
TABLE 10-3 Sample Size Estimates for Estimating the Population Proportion of Suicide or Suicide Attempts
|
|
Confidence |
|
|
|
Rate |
80% |
90% |
95% |
|
0.0001 ± 0.00005 |
65,689 |
96,684a |
>100,000 |
|
0.0005 ± 0.00025 |
13,133 |
21,634 |
30,717 |
|
0.001 ± 0.0005 |
6,563 |
10,812 |
15,351 |
|
0.005 ± 0.0025 |
1,308 |
2,154 |
3,058 |
|
0.01 ± 0.005 |
651 |
1,072 |
1,522 |
|
0.05 ± 0.01 |
781 |
1,286 |
1,825 |
|
0.05 ± 0.025 |
125 |
206 |
292 |
|
0.10 ± 0.01 |
1,479 |
2,435 |
3,458 |
|
0.10 ± 0.02 |
370 |
609 |
865 |
|
0.10 ± 0.03 |
165 |
271 |
385 |
|
0.10 ± 0.04 |
93 |
153 |
217 |
|
0.10 ± 0.05 |
60 |
98 |
139 |
|
a88% confidence |
|||
100,000 with a 95 percent confidence interval from 25 to 75 per 100,000, 30,717 participants are required. For measurement of risk of suicide attempts in a high-risk population (estimated at 10 percent, for instance), a sample size of 3458 is required for precision of 1 percent, but only 139 participants are needed for precision of 5 percent.
Study designs frequently compare suicide, or suicide attempts, or suicidal ideation as an outcome in two groups of individuals. Several factors affect the necessary sample size. Table 10-4 illustrates required sample sizes for a two-group comparison of suicide (completion, attempts, or ideation) rates based on a Type I error rate of 5 percent, power of 0.8, for one to ten repeated evaluations, assuming either intra-class (i.e., intrasubject) correlations (ICC) of 0.3, 0.5, or 0.7. The larger the ICC, the less independent information available, and the larger the required sample size for a given effects size. Furthermore, the larger the ICC, the less impact taking multiple repeated measurements has on the required number of participants. If there is only one repeated measurement, the sample
TABLE 10-4 Sample Size Estimates for Comparison of Two Groups
|
|
Number of Repeated Measurements |
|||||||||
|
Difference |
1 |
2 |
3 |
4 |
5 |
6 |
7 |
8 |
9 |
10 |
|
ICC = .3 |
||||||||||
|
1% vs 2% |
1826 |
1187 |
974 |
867 |
803 |
761 |
730 |
708 |
690 |
676 |
|
5% vs 10% |
343 |
223 |
183 |
163 |
151 |
143 |
137 |
133 |
129 |
127 |
|
10% vs 20% |
157 |
102 |
84 |
75 |
69 |
65 |
63 |
61 |
59 |
58 |
|
25% vs 50% |
46 |
30 |
24 |
22 |
20 |
19 |
18 |
18 |
17 |
17 |
|
ICC = .5 |
||||||||||
|
1% vs 2% |
1826 |
1370 |
1217 |
1141 |
1096 |
1065 |
1043 |
1027 |
1014 |
1004 |
|
5% vs 10% |
343 |
257 |
228 |
214 |
206 |
200 |
196 |
193 |
190 |
188 |
|
10% vs 20% |
157 |
118 |
105 |
98 |
94 |
92 |
90 |
88 |
87 |
86 |
|
25% vs 50% |
46 |
34 |
30 |
28 |
27 |
27 |
26 |
26 |
25 |
25 |
|
ICC = .7 |
||||||||||
|
1% vs 2% |
1826 |
1552 |
1461 |
1415 |
1388 |
1369 |
1356 |
1347 |
1339 |
1333 |
|
5% vs 10% |
343 |
291 |
274 |
265 |
260 |
257 |
254 |
253 |
251 |
250 |
|
10% vs 20% |
157 |
133 |
126 |
122 |
119 |
118 |
117 |
116 |
115 |
115 |
|
25% vs 50% |
46 |
39 |
36 |
35 |
35 |
34 |
34 |
34 |
33 |
33 |
|
Suicide completion, suicide attempts, or suicide ideation for a one-tailed test, a =0.05, power of 0.8, 1 to 10 repeated measurements, and intra-class correlation (ICC) of 0.3, 0.5, or 7 (entries are n/group). |
||||||||||
sizes are for a cross-sectional study. For more than one repeated measurement, the strength of the correlation of events over time must be considered and based on preliminary data. Obviously, for completed suicide, there would be only one repeated measurement and consequently the required sample size would be larger. Note that Table 10-4 provides an example of study sizes needed when the incidence of the outcome is at least 1 percent (i.e., 1000/100,000). As demonstrated in both Table 10-3 and Table 10-4, population sizes must be much larger when working with a low base-rate event. The estimates in Table 10-4 are based on the method of Hsieh (1988).
CENTERS
Because of its low base rate, the difficulties in assessment, and the long-term, interdisciplinary nature of the risk and protective factors, the optimal approach to learn about suicide is to use large populations with cultural and genetic diversity for long-duration, interdisciplinary studies. A centrally coordinated, population-based approach would provide the infrastructure necessary to estimate more reliably the incidence of suicidal behavior (including attempts and completions) in different racial and ethnic groups and in different groups of mentally ill persons. Such an approach would also facilitate longitudinal studies of risk and protective factors (biological and psychosocial) and of preventive interventions. Research centers have often been the mechanism used to address similar research objectives. Large research centers have the additional advantage of being able to provide training opportunities and thereby attract new researchers to a difficult field. Furthermore, centers provide the opportunities for tissue banks and registries that are necessary resources to advance the field. At large research centers, the collaboration of researchers from different but complementary disciplines can significantly enhance progress. For example, integration of ethnographic assessments with psychological and biological evaluations can considerably deepen and contextually validate psychological autopsies to provide a better understanding of the interplay between community and individual risk, and to more successfully develop interdisciplinary preventive interventions that can be rigorously assessed.
In the early 1960s, there was a drive to understand the reasons for and the consequences of the rapidly increasing world population. To address these issues, the Ford Foundation funded the creation of several population research centers around the world, including centers at Georgetown University (2001), the University of Michigan (2002), and the University of the Philippines (2002), which are still flourishing today. The scientific questions required a prospective approach with many years of follow up
and a large population base to ensure statistical significance (Garenne et al., 1997). In these characteristics, the study of populations encountered some of the same challenges as the study of suicide. With the creation of the population research centers and ongoing support from the Ford Foundation, Rockefeller Foundation, and the Population Council, the field of demography blossomed. Research efforts created new links among biomedical research, economic analyses, and cultural context. It brought population issues to the attention of policy makers, especially in developing countries (Nagelberg, 1985).
More recently, research centers have been established to tackle difficult public health issues. Many different approaches have been used and some examples are described below.
To study the prevention and treatment of tobacco use, Transdisciplinary Tobacco Use Research Centers were created through a collaborative funding effort of the National Cancer Institute, NIDA and the Robert Woods Johnson Foundation. They created seven academic institutions with a commitment of $84 million over 5 years (NIDA, 1999). Each center is organized around a particular theme, such as Relapse, Tobacco Dependence, or Biobehavioral Basis of Use. Using cultural, genetic, behavioral, and other approaches, scientists at each center focus their research on their particular theme.
The Centers for Disease Control and Prevention (CDC) has established Injury Control Research Centers to explore the prevention, care and rehabilitation needs presented by various types of injury. In fiscal year 2001, the CDC had plans to fund ten centers (Injury prevention, 2001) at an estimated cost of $900,000 each (Grants for injury control, 2001) for up to 5 years each. The Centers are asked to conduct research in prevention, acute care, and rehabilitation and to serve as training centers and information centers for the public. Studies may be organized around a single theme but this is not a requirement. One such center at the University of North Carolina was funded during its first seven years (1987– 1993) at an average of $3 million per year. The CDC provided the core funding, which was 20–25 percent of the total (University of North Carolina, 2001).
The National Institute on Aging (NIA) supports about 30 Alzheimer’s Disease Research Centers to foster basic and clinical studies of Alzheimer’s Disease and related disorders. According to NIA’s request for proposals (NIA, 2000), the Centers are intended to “provide financial, intellectual, patient and tissue resources to support research projects that have been reviewed and supported on an individual basis … [and] to provide an environment that will strengthen research, increase productivity, and generate new ideas through formal interdisciplinary collaborative efforts.” The centers are mandated to include an administrative core, a clinical core
to recruit patients, a neuropathology core to archive specimens, and an educational core. The centers support short pilot projects as well as multiyear research efforts. NIA funds each center at a level up to $1.4 million each year for five years, with competitive renewals (NIA, 1998; NIA, 2000). In 1994, NIA was committing $35 million per year on 28 centers (Benowitz, 1996). By supporting both basic and clinical research, the centers enhance the translation of research advances into improved care and diagnosis. With the advent of the centers, progress in understanding neurodegenerative dementias has been remarkable (see IOM, 2000).
The National Cancer Institute (NCI) has established 60 cancer centers throughout the United States to provide a broad-based, interdisciplinary effort in cancer research (NCI, 2001a). NCI has found that the centers provide the opportunity to apply complex research strategies and to undertake novel multidisciplinary approaches to the critical questions facing prevention, assessment, and treatment of cancer (NCI, 2001b). Because of the long duration of funding and centralized support that centers provide, it is possible to follow through on studies of etiology and treatment that would be difficult to undertake in a different setting (NCI, 2001b). Many of the same issues facing researchers in suicide (assessment of risk factors, the necessity for large clinical studies, multidisciplinary issues, etc.) have been successfully addressed through these centers. The Cancer Centers vary greatly in their structure and scope. The centers might encompass basic science, clinical trials, population studies, and/or clinical care. They might be part of a university, freestanding institutes, or jointly run by multiple institutions (NCI, 2000a). In Fiscal Year 2000, $169 million was allocated for funding these 60 centers through NCI (NCI, 2000b). This averages to almost $2.8 million for each center that year. Because of the many sources from which cancer researchers can obtain funds, the general guideline of NCI is that NCI funding should be no more than 20 percent of the total funding of the center (NCI, 2001c). This means that if NCI provides $2.5 million per year to a center, it is expected that the total annual funding is about $12.5 million. Although the support from NCI is only a small part of the total, it is key to the support of the infrastructure, provides shared resources, and allows flexibility in the use of funds. Through these means, NCI funding of the centers helps to stimulate innovation and collaboration in cancer research (NCI, 2000a).
The Conte Center for the Neuroscience of Mental Disorders, funded by the National Institute of Mental Health, is an example of another approach to research centers. In 2000, there were eleven Conte centers (Hyman, 2000). Each of these centers is organized around a single hypothesis. The Centers are designed to optimize the use of resources to address a specific scientific problem. Center funding is not intended to provide full research support for investigators; they are expected also to have
individual grant support. To coordinate the activities among these centers, the directors are expected to attend an annual meeting (NIMH, 1998). Funding varies with each center’s needs. In 2001, Washington University was awarded $2 million over 3 years to establish a center for brain-mapping projects to enhance understanding of schizophrenia and other psychiatric disorders (Washington University, 2001). In 2000, Emory University received $13 million over 5 years to support their activities on clinical depression (Emory University, 2000).
The committee believes that suicide is best served by a similar mechanism that would allow a nationally coordinated effort that can be extended to global populations through international collaborations. As the discussion above points out, there are many options for organizing centers: core funding, hypothesis, theme, or flexible support. The committee did not find evidence that any one approach was preferable to another. Whatever structure is chosen, such centers would allow better estimates of incidence, improved evaluation of risk and protective factors, longitudinal studies that could assess intervention and prevention, and development of tissue repositories for genetic and other biological analyses. Ancillary benefits of such a center would be the wealth of data that would be collected on mental illness and substance abuse, major risk factors for suicide, and correlation with detailed social data. Because schizophrenia, mood disorders, substance abuse, and personality disorders are associated with increased incidence of suicide, studies of suicide will also address these important psychiatric conditions and lead to a better understanding of and possible interventions for the mental disorders. These are also the appropriate settings to conduct more rigorous evaluation of suicide prevention projects that link community- and individual-level evaluations.
Although suicide is less common than cancer, injury, Alzheimer’s Disease, or tobacco use, suicide research has parallels to these other center-based research efforts. Like these other areas of investigation, suicide centers would focus an effort in an area of high significance for public health but where inroads toward solutions have been heretofore limited. While research in suicide has been stymied by inadequate populations for investigation, there is a wealth of understanding about many risk and protective factors including behavioral, psychological, and cultural aspects of the problem. As with other health areas, integration of multiple perspectives will generate new questions and hypotheses that can be expected to jump-start an understanding of mechanisms and possible interventions. Particularly because of the limits of our current knowledge about suicide, these centers are especially important for future progress. The same benefits that centers have provided to other disease initiatives can be expected for suicide.
Currently there are a small number of suicide research centers around the world. In the United States, for example, these include the Suicide Prevention Research Center at the University of Nevada School of Medicine funded by the CDC (NCIPC, 2002) and the University of Rochester’s Center for the Study and Prevention of Suicide funded by NIMH (University of Rochester, 2001). Internationally there are centers in Oxford, England (University of Oxford, 2002); Gent, Belgium (Ghent University, 2001); Hamburg, Germany (University of Hamburg, 2000); Stockholm, Sweden (IPM, 2001); and others. The scale of these centers is relatively small; their interactions are limited. As proposed, the population research centers would enhance the population database for research among these investigators and provide an integrated network for coordination of effort and collaborative study.
Other alternatives might achieve some of these goals. Broad assessments of risk factors can be accomplished by including suicidal endpoints in all large epidemiological studies and this is an important approach to enhancing the research effort on suicide. Adding suicide cores to centers focussed on mental illness might also increase the collection of data regarding suicide. But these less expensive alternatives will not address the most serious obstacle to understanding suicide: the need for a large, a well-characterized population that would allow links to be made about causes, risks, protective factors, and successful interventions. Such a wellcharacterized and carefully studied population is essential for evaluating biological markers and genetic bases of suicide as well as the social and cultural influences. Currently the database is inadequate. Additionally, individual projects cannot access the large populations necessary to come to significant conclusions regarding this low base-rate event. As the statistical analysis above points out, at a suicide rate of 10 per 100,000 population, approximately 100,000 participants are needed to achieve statistical significance. In studying suicide among low-risk groups, the numbers needed are even greater.
While each center might be able to obtain a sufficiently large sample for studies in the general population, a consortium of centers will be necessary to fully explore differences based on region, economic environment, culture, urbanization, and other factors that vary across the country. In addition, one center might be responsible for coordinating international data to increase the understanding of suicide on a global scale. Furthermore, certain subpopulations may be sufficiently small or low risk to require broader recruitment than one center could access. The coordinated network of centers is an optimal way to achieve these goals. In addition, the centers will allow a comprehensive approach to understanding suicide from a truly interdisciplinary perspective with both cross sectional and longitudinal studies.
Suicide is responsible for over 30,000 deaths each year. Mental illness, the primary risk factor, afflicts over 80 million people in the United States; almost 15 million people have a serious mental illness (i.e, a mental disorder that leads to a functional impairment). For comparison, breast cancer claims the lives of about 40,000 women per year and between 10–15 million people are living with the diagnosis of breast cancer. In 1998 over $400 million from NCI and the Army programs was allocated to research into the prevention, treatment, and cure of breast cancer (IOM, 2001). From estimates of the portfolios of SAMHSA, CDC, and NIMH, the funding for suicide was less than $40 million in 2000. The committee finds that this is disproportionately low, given the magnitude of the problem of suicide. A substantial investment of funds is needed to make meaningful progress.
FINDINGS
-
Suicidology has faced serious methodological limitations, including inconsistencies in definitions and misclassification of deaths by medical examiners or coroners. The quality of the data on suicide attempts is even less reliable than that for completed suicide. The low base-rate of suicide has necessitated the use of proximal endpoints in lieu of suicide itself and has created difficulties in computing the risk of suicide and statistically analyzing results.
The field should endorse common definitions and psychometrically sound measures. Better training of coroners and medical examiners in certification of suicide needs to be developed and provided. Registries of suicide attempts for clinical surveillance and research purposes that have the capacity to foster, among other things, international community-oriented studies that integrate clinical, biological, and social data should be created. Finally, novel applications of statistical analyses and research designs should be employed to advance research on suicide.
-
Large sample sizes are required in order to provide statistical power for studies of events with a low base rate. For example, to determine the overall incidence rate of suicide in a general population within plus or minus 5 per 100,000 with 90 percent confidence, would require about 100,000 participants. Many statistical approaches exist that can be effectively applied to the field of suicide.
Researchers in suicide should seek out appropriate methodologies and statistical consultation to most effectively design protocols and analyze data.
-
Suicidal individuals have been largely excluded from clinical trials. Evidence suggests, however, that high-risk participants can benefit from treatment trials and that certain research designs can increase the safety of participants. Evidence-based treatment protocols for suicidality are seriously lacking, making clinical trials critical.
Clinical trials of drug and psychotherapy treatment should include suicidal patients. Appropriate safeguards, including safe study designs, should be used with such populations.
-
Treatment trials often exclude suicidal individuals because of liability concerns. Re-framing this mortality risk to include comparison with risks in other types of medical trials underscores that suicide is an unfortunately expectable outcome of mental illness for some percentage of afflicted individuals. Suicide is not a consequence of the research or therapeutic intervention.
Inform the public and Institutional Review Boards that mental illnesses are potentially fatal, and that for some percentage of individuals, suicide represents an unfortunately expectable outcome of mental illness.
-
Lack of longitudinal and prospective studies remains a critical barrier to understanding and preventing suicide. Understanding the interactive risk and protective factors and their developmental course necessitates prospective, transactional research. Long-term assessment must occur for preventive interventions to be properly evaluated. Large, interconnected research centers have helped advance the science base regarding other societal problems, and are expected to do so for suicide, as well.
A national network of suicide research population laboratories devoted to interdisciplinary research on suicide and suicide prevention across the life cycle should be developed. Such an approach would redress many of the current methodological limitations and resultant lags in progress.
REFERENCES
AAST (American Association for the Surgery of Trauma). 2002. National Violent Death Reporting System Receives Initial Funding. [Online]. Available: http://www.aast.org/nvdrs.html [accessed April 15, 2002].
AdvanceMed. 2001. Audit of the National Electronic Injury Surveillance System (NEISS) Hospitals. Final System-Wide Analysis Report to the U.S. Consumer Product Safety Commission.
Agresti A, Lang JB. 1993. A proportional odds model with subject-specific effects for repeated ordered categorical responses. Biometrika, 80: 527-534.
Andreasen NC, Endicott J, Spitzer RL, Winokur G. 1977. The family history method using diagnostic criteria. Reliability and validity. Archives of General Psychiatry, 34(10): 1229-1235.
Andreasen NC, Rice J, Endicott J, Reich T, Coryell W. 1986. The family history approach to diagnosis. How useful is it? Archives of General Psychiatry, 43(5): 421-429.
Annest JL, Fingerhut LA, Conn JM, Pickett D, McLoughlin E, Gallagher S. 1998. How States Are Collecting and Using Cause of Injury Data: A Survey on State-Based Injury Surveillance, External Causeof Injury Coding Practices, and Coding Guidelines in the 50 States, the District of Columbia, and Puerto Rico. Washington, DC: American Public Health Association.
Annest JL, Mercy JA, Gibson DR, Ryan GW. 1995. National estimates of nonfatal firearm-related injuries. Beyond the tip of the iceberg. Journal of the American Medical Association, 273(22): 1749-1754.
Annest JL, Pogostin CL. 2000. A Pilot Test of the Centers for Disease Control and Prevention Short Version of the International Classification of External Causes of Injury (ICECI). Report to the World Health Organization Collaborating Centers on the Classification of Disease. Atlanta, GA: Office of Statistics and Programming, National Center for Injury Prevention and Control, Centers for Disease Control and Prevention.
Appelbaum PS, Grisso T. 1995. The MacArthur Treatment Competence Study. I: Mental illness and competence to consent to treatment. Law and Human Behavior, 19(2): 105-126.
Atkinson MW, Kessel N, Dalgaard JB. 1975. The comparability of suicide rates. British Journal of Psychiatry, 127: 247-256.
Azrael D, Barber C, Mercy J. 2001. Linking data to save lives: Recent progress in establishing a National Violent Death Reporting System. Harvard Health Policy Review, 2(2).
Baker JE, Channon S. 1995. Reasoning in depression: Impairment on a concept discrimination learning task. Cognition and Emotion, 9: 579-597.
Barber C, Hemenway D, Hargarten S, Kellermann A, Azrael D, Wilt S. 2000. A “call to arms” for a national reporting system on firearm injuries. American Journal of Public Health, 90(8): 1191-1193.
Beck AT, Davis JH, Frederick CJ, Perlin S, Pokorny AD, Schulman RE, Seiden RH, Wittlin BJ. 1973. Classification and nomenclature. In: Resnick HLP, Hathorne BC, Editors. Suicide Prevention in the Seventies. (pp. 7-12). Washington, DC: U.S. Government Printing Office.
Beck AT, Steer RA. 1987. Beck Depression Inventory: Manual. New York: Psychological Corporation.
Benowitz S. 1996. Gerontologist’s provocative questions: Does NIA spend too much on Alzheimer’s? The Scientist, 10(1): 5.
Berman AL. 2001. Assessing and recording violent injuries: The need for a national violent death reporting system. A panel discussion held at the 20th Annual American Medical Association Science Reporters Conference, October 28-29, 2001, San Francisco, CA. Summary available in: American Medical Association. National Violent Death Reporting System Needed: Data From a National Reporting System Could Help Prevent Deaths [Online]. Available: http://www.ama-assn.org/ama/pub/print/article/4197-5468.html [accessed April 15, 2002].
Beskow J, Runeson B, Asgard U. 1991. Ethical aspects of psychological autopsy. Acta Psychiatrica Scandinavica, 84(5): 482-487.
Böhning D. 1999. Computer-Assisted Anaysis of Mixtures and Applications. Meta-Analysis, Disease Mapping and Others. Boca Raton, FL: Chapman and Hall CRC.
Bostwick JM, Pankratz VS. 2000. Affective disorders and suicide risk: A reexamination. American Journal of Psychiatry, 157(12): 1925-1932.
Brent DA, Baugher M, Bridge J, Chen T, Chiappetta L. 1999. Age- and sex-related risk factors for adolescent suicide. Journal of the American Academy of Child and Adolescent Psychiatry, 38(12): 1497-1505.
Brent DA, Perper JA, Allman CJ. 1987. Alcohol, firearms, and suicide among youth: Temporal trends in Allegheny County, Pennsylvania, 1960 to 1983. Journal of the American Medical Association, 257(24): 3369-3372.
Brent DA, Perper JA, Kolko DJ, Zelenak JP. 1988. The psychological autopsy: Methodological considerations for the study of adolescent suicide. Journal of the American Academy of Child and Adolescent Psychiatry, 27(3): 362-366.
Brent DA, Perper JA, Moritz G, Allman CJ, Roth C, Schweers J, Balach L. 1993. The validity of diagnoses obtained through the psychological autopsy procedure in adolescent suicide victims: Use of family history. Acta Psychiatrica Scandinavica, 87(2): 118-122.
Bunk S. 1997. National HIV reporting approaches, but privacy remains paramount. The Scientist, 11(22): 1.
Cavanagh JT, Owens DG, Johnstone EC. 1999. Suicide and undetermined death in south east Scotland. A case-control study using the psychological autopsy method. Psychological Medicine, 29(5): 1141-1149.
CDC (Centers for Disease Control and Prevention). 1995. Integrating Public Health Information and Surveillance Systems: A Report and Recommendations. [Online]. Available: http://www.cdc.gov/od/hissb/docs/katz.htm [accessed April 24, 2002].
CDC (Centers for Disease Control and Prevention). 2001a. National Electronic Disease Surveillance System: Frequently Asked Questions. [Online]. Available: http://www.cdc.gov/nedss/About/faq.htm#injury_surveillance [accessed April 16, 2002].
CDC (Centers for Disease Control and Prevention). 2001b. Supporting Public Health Surveillance Through the National Electronic Disease Surveillance System. [Online]. Available: http://www.cdc.gov/od/hissb/docs.htm#nedss [accessed April 16, 2002].
CDC (Centers for Disease Control and Prevention). 1999. CDC guidelines for national human immunodeficiency virus case surveillance, including monitoring for human immunodeficiency virus infection and acquired immunodeficiency syndrome. Morbidity and Mortality Weekly Report, 48(RR-13): 1-29.
Chen T, Iyengar S, Brent D. unpublished. A Hybrid Logistic Model for Case-Control Studies. Unpublished manuscript, Bowling Green State University.
Cook PJ, Tauchen G. 1984. The effect of minimum drinking age legislation on youthful auto fatalities. Journal of Legal Studies, 13: 169-190.
Cooper J. 1999. Ethical issues and their practical application in a psychological autopsy study of suicide. Journal of Clinical Nursing, 8(4): 467-475.
CPSC (Consumer Product Safety Commission). 2001. National Electronic Injury Surveillance System. CPSC Document #3002. [Online]. Available: http://www.cpsc.gov/cpscpub/pubs/3002.html [accessed April 15, 2002].
Davies M, Connolly A, Horan J, Editors. 2001. State Injury Indicators Report. Atlanta, GA: Centers for Disease Control and Prevention, National Center for Injury Prevention and Control.
Davis Y, Annest JL, Powell KE, Mercy J.A. 1996. Evaluation of the National Electronic Injury Surveillance System for use in monitoring nonfatal firearm injuries and obtaining national estimates. Journal of Safety Research, 27: 83-91.
Ederer F, Meyers MH, Mantel N. 1964. A statistical problem in space and time: Do leukemia cases come in clusters? Biometrics, 20: 626-638.
Educational Development Center. 1999. E Codes. [Online]. Available: http://www.edc.org/HHD/csn/buildbridges/bb2.2/ECODES.html [accessed April 15, 2002].
Elliot C. 1997. Caring about risks: Are severely depressed patients competent to consent to research? Archives of General Psychiatry, 54: 113-116.
Emanuel EJ, Wendler D, Grady C. 2000. What makes clinical research ethical? Journal of the American Medical Association, 283(20): 2701-2711.
Emory University. 2000. Does Abuse Breed Depression? Emory Magazine, 75(4): [Online]. Available: http://medicine.wustl.edu/~wumpa/news/2001/conte.html [accessed May 10, 2002].
Ethical considerations in suicide research debated. 2001. [Online]. Available: http://www.suicidology.org/newslinksum42001.htm [accessed December 4, 2001].
Ezzet F, Whitehead J. 1991. A random effects model for ordinal responses from a crossover trial. Statistics in Medicine, 10: 901-907.
Feinstein AR. 1977. Clinical biostatistics. XLI. Hard science, soft data, and the challenges of choosing clinical variables in research. Clinical Pharmacology and Therapeutics, 22(4): 485-498.
Finkelstein MO, Levin B, Robbins H. 1996a. Clinical and prophylactic trials with assured new treatment for those at greater risk: II. Examples. American Journal of Public Health, 86(5): 696-705.
Finkelstein MO, Levin B, Robbins H. 1996b. Clinical and prophylactic trials with assured new treatment for those at greater risk: I. A design proposal. American Journal of Public Health, 86(5): 691-695.
Gallagher SS. 2001. Critical Needs in Implementing a National Violent Death Reporting System— Results From a Process Evaluation. Paper presented at the 129th annual meeting of the American Public Health Association in Atlanta, Georgia, October 21-25, 2001.
GAO (General Accounting Office). 1987. Drinking-Age Laws: An Evaluation Synthesis of Their Impact on Highway Safety. GAO/PEMD-87-10. Washington, DC: GAO.
GAO (General Accounting Office). 1997. Consumer Product Safety Commission: Better Data Needed to Help Identify and Analyze Potential Hazards. GAO/HEHS-97-147. Washington, DC: GAO.
Garenne M, Das Gupta M, Pison G, Aaby P. 1997. Introduction. In: Das Gupta M, Aaby P, Garenne M, Pison G, Editors. Prospective Community Studies in Developing Countries. (pp. 1-15). New York: Oxford University Press.
Garrison CZ, Lewinsohn PM, Marsteller F, Langhinrichsen J, Lann I. 1991. The assessment of suicidal behavior in adolescents. Suicide and Life-Threatening Behavior, 21(3): 217-230.
Georgetown University. 2001. History of Demography Department. [Online]. Available: http://www.georgetown.edu/departments/demography/main/AboutDept/history.htm [accessed May 10, 2002].
Ghent University. 2001. Unit for Suicide Research. [Online]. Available: http://allserv.rug.ac.be/~cvheerin/ [accessed May 10, 2002].
Gibbons RD. 1994. Statistical Methods for Groundwater Monitoring. New York: Wiley.
Gibbons RD, Clark DC, Fawcet J. 1990. A statistical method for evaluating suicide clusters and implementing cluster surveillance. American Journal of Epidemiology, 132 (Suppl 1): S183-S191.
Gist R, Welch QB. 1989. Certification change versus actual behavior change in teenage suicide rates, 1955-1979. Suicide and Life-Threatening Behavior, 19(3): 277-288.
Goodwin FK, Jamison KR. 1990. Manic-Depressive Illness. New York: Oxford University Press.
Gostin LO, Ward JW, Baker AC. 1997. National HIV case reporting for the United States. A defining moment in the history of the epidemic. New England Journal of Medicine, 337(16): 1162-1167.
Gould MS, Wallenstein S, Kleinman M. 1990. Time-space clustering of teenage suicide. American Journal of Epidemiology, 131(1): 71-78.
Grants for injury control research centers. Program announcement 01007. 2001. HIVDENT. [Online]. Available: http://www.hivdent.org/infctl/ic1679092000.htm [accessed December 19, 2001].
Guze SB, Robins E. 1970. Suicide and primary affective disorders. British Journal of Psychiatry, 117(539): 437-438.
Hahn GJ, Meeker WQ. 1991. Statistical Intervals: A Guide for Practitioners. New York: Wiley.
Hartlage S, Alloy LB, Vazquez C, Dykman B. 1993. Automatic and effortful processing in depression. Psychological Bulletin, 113(2): 247-278.
Harville DA, Mee RW. 1984. A mixed-model procedure for analyzing ordered categorical data. Biometrics, 40: 393-408.
Hawton K, Appleby L, Platt S, Foster T, Cooper J, Malmberg A, Simkin S. 1998. The psychological autopsy approach to studying suicide: A review of methodological issues. Journal of Affective Disorders, 50(2-3): 269-276.
Hawton K, Cole D, O’Grady J, Osborn M. 1982. Motivational aspects of deliberate self-poisoning in adolescents. British Journal of Psychiatry, 141: 286-291.
Hedeker D, Gibbons RD. 1994. A random effects ordinal regression model for multilevel analysis. Biometrics, 50: 933-944.
HICRC (Harvard Injury Control Research Center). 2001. National Violent Injury Statistics System: Linking Data to Save Lives. [Online]. Available: http://www.hsph.harvard.edu/hicrc/nviss/ [accessed April 15, 2002].
Holding TA, Barraclough BM. 1975. Psychiatric morbidity in a sample of a London coroner’s open verdicts. British Journal of Psychiatry, 127: 133-143.
Holding TA, Barraclough BM. 1978. Undetermined deaths—suicide or accident? British Journal of Psychiatry, 133: 542-549.
Hopkins DD, Grant-Worley JA, Fleming DW. 1995. Fatal and nonfatal suicide attempts among adolescents—Oregon, 1988–1993. Morbidity and Mortality Weekly Report, 44(16): 312-315; 321-323.
Hosmer D, Lemeshow S. 1989. Applied Logistic Regression. New York: Wiley.
Hsieh FY. 1988. Sample size formulae for intervention studies with the cluster as unit of randomization. Statistics in Medicine, 7(11): 1195-1201.
Hyman SE. 2000. Director’s Column. [Online]. Available: http://apu.sfn.org/NL/2000/May-June/articles/director.html [accessed May 10, 2002].
ICRIN (Injury Contol Research Information Network). 2001. Status of Hospital Discharge ECoding by State, U.S. [Online]. Available: http://www.injurycontrol.com/icrin/Ecode%20tracking.htm [accessed April 22, 2002].
Injury prevention and control research and state and community based programs. 2001. Catalog of Federal Domestic Assistance. [Online]. Available: http://aspe.os.dhhs.gov/cfda/P93136.htm [accessed December 19, 2001].
Inskip HM, Harris EC, Barraclough B. 1998. Lifetime risk of suicide for affective disorder, alcoholism and schizophrenia. British Journal of Psychiatry, 172: 35-37.
IOM (Institute of Medicine). 1999. Bonnie RJ, Fulco CE, Liverman CT, Editors. Reducing the Burden of Injury: Advancing Prevention and Treatment. Washington, DC: National Academy Press.
IOM (Institute of Medicine). 2000. Pellmar TC, Eisenberg L, Editors. Bridging Disciplines in the Brain, Behavioral, and Clinical Sciences. Washington, DC: National Academy Press.
IOM (Institute of Medicine). 2001. Nass SJ, Henderson IC, Lashof JC, Editors. Mammography and Beyond: Developing Technologies for the Early Detection of Breast Cancer . Washington, DC: National Academy Press.
IPM (National Swedish Institute for Psychosocial Medicine)/Karolinska Institute. 2001. National Centre for Suicide Research and Prevention of Mental Ill-Health. [Online]. Available: http://www.ki.se/ipm/enheter/engSui.html [accessed May 10, 2002].
Ivarsson T, Gillberg C, Arvidsson T, Broberg AG. 2002. The Youth Self-Report (YSR) and the Depression Self-Rating Scale (DSRS) as measures of depression and suicidality among adolescents. European Child and Adolescent Psychiatry, 11(1): 31-37.
Jansen J. 1990. On the statistical analysis of ordinal data when extravariation is present. Applied Statistics, 39: 75-84.
Jenkins J, Sainsbury P. 1980. Single-car road deaths—disguised suicides? British Medical Journal, 281(6247): 1041.
Jobes DA, Berman AL, Josselson AR. 1987. Improving the validity and reliability of medical–legal certifications of suicide. Suicide and Life-Threatening Behavior, 17(4): 310-325.
Kann L, Kinchen SA, Williams BI, Ross JG, Lowry R, Hill CV, Grunbaum JA, Blumson PS, Collins JL, Kolbe LJ. 1998. Youth Risk Behavior Surveillance—United States, 1997. State and Local YRBSS Coordinators. Journal of School Health, 68(9): 355-369.
Kaufman J, Birmaher B, Perel J, Dahl RE, Stull S, Brent D, Trubnick L, al-Shabbout M, Ryan ND. 1998. Serotonergic functioning in depressed abused children: Clinical and familial correlates. Biological Psychiatry, 44(10): 973-981.
Keck PE Jr, McElroy SL, Strakowski SM, West SA, Sax KW, Hawkins JM, Bourne ML, Haggard P. 1998. 12-month outcome of patients with bipolar disorder following hospitalization for a manic or mixed episode. American Journal of Psychiatry, 155(5): 646-652.
Kelly TM, Mann JJ. 1996. Validity of DSM-III-R diagnosis by psychological autopsy: A comparison with clinician ante-mortem diagnosis. Acta Psychiatrica Scandinavica, 94(5): 337-343.
Kessler RC, Borges G, Walters EE. 1999. Prevalence of and risk factors for lifetime suicide attempts in the National Comorbidity Survey. Archives of General Psychiatry, 56(7): 617-626.
Knox G. 1964. The detection of space-time interactions. Applied Statistics, 3: 25-29.
Kraemer GW, Ebert MH, Schmidt DE, McKinney WT. 1989. A longitudinal study of the effect of different social rearing conditions on cerebrospinal fluid norepinephrine and biogenic amine metabolites in rhesus monkeys. Neuropsychopharmacology, 2(3): 175-189.
Lee MA, Ganzini L. 1992. Depression in the elderly: Effect on patient attitudes toward lifesustaining therapy. Journal of the American Geriatrics Society, 40: 983-988.
Liang KY, Zeger SL. 1986. Longitudinal data analysis using generalized linear models. Biometrika, 73: 13-22.
Linehan MM. 1986. Suicidal people. One population or two? Annals of the New York Academy of Sciences, 487: 16-33.
Linehan MM. 1997. Behavioral treatments of suicidal behaviors. Definitional obfuscation and treatment outcomes. Annals of the New York Academy of Sciences, 836: 302-328.
Longford NT. 1994. Logistic regression with random coefficients. Computational Statistics and Data Analysis , 17: 1-15.
Maudsley G, Williams EM. 1996. “Inaccuracy” in death certification—where are we now? Journal of Public Health Medicine, 18(1): 59-66.
McCarthy PD, Walsh D. 1975. Suicide in Dublin: I. The under-reporting of suicide and the consequences for national statistics. British Journal of Psychiatry, 126: 301-308.
Miller IW, Norman WH, Bishop SB, Dow MG. 1986. The Modified Scale for Suicidal Ideation: Reliability and validity. Journal of Consulting and Clinical Psychology, 54(5): 724-725.
Millon T. 1983. Millon Clinical Multiaxial Inventory. 2nd ed. Minneapolis, MN: National Computer Systems.
Mitchell RE. 1982. Social networks and psychiatric clients: The personal and environmental context. American Journal Community Psychology, 10(4): 387-401.
Mohandie K, Meloy JR. 2000. Clinical and forensic indicators of “suicide by cop”. Journal of Forensic Sciences, 45(2): 384-389.
Moscicki EK, O’Carroll P, Rae DS, Locke BZ, Roy A, Regier DA. 1988. Suicide attempts in the Epidemiologic Catchment Area study. The Yale Journal of Biology and Medicine, 61: 259-268.
Murphy E, Lindesay J, Grundy E. 1986. 60 years of suicide in England and Wales. A cohort study. Archives of General Psychiatry, 43(10): 969-976.
Myers KA, Farquhar DR. 1998. Improving the accuracy of death certification. Canadian Medical Association Journal, 158(10): 1317-1323.
Nagelberg J. 1985. Promoting Population Policy: The Activities of the Rockefeller Foundation, the Ford Foundation and the Population Council: 1959–1966. Dissertation Abstract, Columbia University.
Nakashima AK, Horsley R, Frey RL, Sweeney PA, Weber JT, Fleming PL. 1998. Effect of HIV reporting by name on use of HIV testing in publicly funded counseling and testing programs. Journal of the American Medical Association, 280(16): 1421-1426.
National Bioethics Advisory Commission. 1998. Research Involving Persons With Mental Disorders That May Affect Decisionmaking Capacity. Rockville, MD. [Online]. Available: http://www.bioethics.gov/capacity/TOC.htm [accessed December 19, 2001].
National Bioethics Advisory Commission. 2001. Ethical and Policy Issues in Research Involving Human Participants. Rockville, MD. [Online]. Available: http://bioethics.georgetown.edu/nbac/human/overvol1.html [accessed December 19, 2001].
NCHS (National Center for Health Statistics). 1988. Vital Statistics of the United States, 1985. Volume II. Mortality, Part A. DHHS publication number (PHS) 88-1101. Washington, DC: US Government Printing Office.
NCI (National Cancer Institute). 2000a. The Cancer Center Branch of the National Cancer Institute. Policies and Guidelines Relating to the Cancer–Center Support Grant. [Online]. Available: http://www3.cancer.gov/cancercenters/download.html [accessed May 10, 2002].
NCI (National Cancer Institute). 2000b. Fact Book: National Cancer Institute. Bethesda, MD: U.S. Department of Health and Human Services, National Institutes of Health, Public Health Service. [Online]. Available: http://www.nci.nih.gov/admin/fmb/Factbook2000.pdf [accessed December 19, 2001].
NCI (National Cancer Institute). 2001a. Description of the Cancer Centers Program. [Online]. Available: http://www.nci.nih.gov/cancercenters/description.html [accessed December 19, 2001].
NCI (National Cancer Institute). 2001b. History of the NCI Cancer Centers. [Online]. Available: http://www.nci.nih.gov/cancercenters/ccsg_comp_pt1_1to2.html#1history [accessed December 18, 2001].
NCI (National Cancer Institute). 2001c. Major Policies on Budget. [Online]. Available: http://www.nci.nih.gov/cancercenters/ccsg_comp_pt1_13to15.html#13major [accessed December 19, 2001].
NCIPC (National Center for Injury Prevention and Control). 2002. Suicide Prevention Research Center. Announcement Number 98067. [Online]. Available: http://www.cdc.gov/ncipc/dvp/suinevada.htm [accessed May 9, 2001].
Nelson FL, Farberow NL, MacKinnon DR. 1978. The certification of suicide in eleven western states: An inquiry into the validity of reported suicide rates. Suicide and Life-Threatening Behavior, 8(2): 75-88.
NFFIRS (National Fatal Firearm Injury Reporting System) Workgroup. 2001. Uniform Data Elements: National Fatal Firearm Injury Reporting System. Release 1.1. [Online]. Available: http://www.hsph.harvard.edu/hicrc/nviss/about_parent_tech.htm [accessed May 14, 2002].
NHTSA (National Highway Traffic Safety Administration). 1996. Traffic Safety Facts, 1996. Alcohol. Washington, DC: NHTSA.
NHTSA (National Highway Traffic Safety Administration). 2001. Fatality Analysis Reporting System. [Online]. Available: http://www.nhtsa.dot.gov/people/ncsa/fars.html [accessed April 19, 2002].
NIA (National Institute on Aging). 1998. NIH Guide: Amendment to Alzheimer’s Disease Research Centers. [Online]. Available: http://grants.nih.gov/grants/guide/notice-files/not98-025.html [accessed January 8, 2002].
NIA (National Institute on Aging). 2000. NIH Guide: Alzheimer’s Disease Core Centers. [Online]. Available: http://grants.nih.gov/grants/guide/rfa-files/RFA-AG-00-002.html [accessed January 8, 2002].
NIDA (National Institute on Drug Abuse). 1999. Federal Institutes and The Robert Wood Johnson Foundation Create Tobacco Use Research Centers. [Online]. Available: http://www.nida.nih.gov/MedAdv/99/NR-1018.html [accessed May 10, 2002].
NIMH (National Institute of Mental Health). 1998. Silvio O. Conte Centers for the Neuroscience of Mental Disorders. [Online]. Available: http://grants1.nih.gov/grants/guide/pafiles/PAR-98-058.html [accessed May 10, 2002].
NVISS (National Violent Injury Statistics System) Workgroup. 2002. Violent Death Reporting System Training Manual. [Online]. Available: http://www.hsph.harvard.edu/hicrc/nviss/about_parent_tech.htm [accessed May 14, 2002].
O’Carroll PW. 1989. A consideration of the validity and reliability of suicide mortality data. Suicide and Life-Threatening Behavior, 19(1): 1-16.
O’Carroll PW, Berman AL, Maris RW, Moscicki EK, Tanney BL, Silverman MM. 1996. Beyond the tower of Babel: A nomenclature for suicidology. Suicide and Life-Threatening Behavior, 26(3): 237-252.
O’Donnell I, Farmer R. 1995. The limitations of official suicide statistics. British Journal of Psychiatry, 166(4): 458-461.
Ohberg A, Lönnqvist J. 1998. Suicides hidden among undetermined deaths. Acta Psychiatrica Scandinavica, 98(3): 214-218.
Ovenstone IM. 1973. A psychiatric approach to the diagnosis of suicide and its effect upon the Edinburgh statistics. British Journal of Psychiatry, 123(572): 15-21.
Pearson JL, King C, Stanley B, Fisher C. 2000. Issues to Consider in Intervention Research With Persons at High Risk for Suicidality: National Institute of Mental Health. [Online] Available: http://www.nimh.nih.gov/research/highrisksuicide.cfm [accessed December 19, 2001].
Pescosolido BA, Mendelsohn R. 1986. Social causation or social construction of suicide? An investigation into the social organization of official rates. American Sociological Review, 51(1): 80-100.
Phillips DP, Ruth TE. 1993. Adequacy of official suicide statistics for scientific research and public policy. Suicide and Life-Threatening Behavior, 23(4): 307-319.
PHS (Public Health Service). 2001. National Strategy for Suicide Prevention: Goals and Objectives for Action. Rockville, MD: U.S. Department of Health and Human Services.
Pine DS, Coplan JD, Wasserman GA, Miller LS, Fried JE, Davies M, Cooper TB, Greenhill L, Shaffer D, Parsons B. 1997. Neuroendocrine response to fenfluramine challenge in boys. Associations with aggressive behavior and adverse rearing. Archives of General Psychiatry, 54(9): 839-846.
Reynolds CF 3rd, Degenholtz H, Parker LS, Schulberg HC, Mulsant BH, Post E, Rollman B. 2001. Treatment as usual (TAU) control practices in the PROSPECT Study: Managing the interaction and tension between research design and ethics. International Journal of Geriatric Psychiatry, 16(6): 602-608.
Robbins H. 1993. Comparing two treatments under biased allocation. La Gazette Des Sciences Mathematique De Quebec , 15: 35-41.
Robbins H, Zhang CH. 1988. Estimating a treatment effect under biased sampling. Proceedings of the National Academy of Sciences, 85(11): 3670-3672.
Robbins H, Zhang CH. 1989. Estimating the superiority of a drug to a placebo when all and only those patients at risk are treated with the drug. Proceedings of the National Academy of Sciences, 86(9): 3003-3005.
Robbins H, Zhang CH. 1991. Estimating a multiplicative treatment effect under biased allocation. Biometrika, 78: 349-354.
Rudd MD, Rajab MH, Orman DT, Joiner T, Stulman DA, Dixon W. 1996. Effectiveness of an outpatient problem-solving intervention targeting suicidal young adults: Preliminary results. Journal of Consulting and Clinical Psychology, 64(1): 179-190.
Sainsbury P, Jenkins JS. 1982. The accuracy of officially reported suicide statistics for purposes of epidemiological research. Journal of Epidemiology and Community Health, 36(1): 43-48.
Schmidt CW Jr, Shaffer JW, Zlotowitz HI, Fisher RS. 1977. Suicide by vehicular crash. American Journal of Psychiatry, 134(2): 175-178.
Shaffer D, Gould MS, Fisher P, Trautman P, Moreau D, Kleinman M, Flory M. 1996. Psychiatric diagnosis in child and adolescent suicide. Archives of General Psychiatry, 53: 339-348.
Smith PG. 1982. Spatial and temporal clustering. In: Schottenfeld D, Fraumeni JF, Editors. Cancer Epidemiology and Prevention. (pp. 391-407). Philadelphia: WB Saunders.
STIPDA (State and Territorial Injury Prevention Directors Association). 1999. STIPDA Resolutions: CSTE Position Statement #INJ-6. [Online]. Available: http://www.stipda.org/resol/99nphss-intent.htm [accessed April 17, 2002].
Telcser SL. 1996. The psychological autopsy study of completed suicide: An experimental test of the impact of knowledge of the suicide upon informants’ reports of psychopathology in the victim. Thesis (Ph.D.)—Loyola University of Chicago. Dissertation Abstracts International. Vol. 57-03. (pp. 2167).
Ten Have TR. 1996. A mixed effects model for multivariate ordinal response data including correlated failure times with ordinal responses. Biometrics, 52: 473-491.
Thomas N, Longford NT, Rolph J. 1992. A Statistical Framework for Severity Adjustment of Hospital Mortality Rates. Working paper. Santa Monica, CA: RAND.
University of Hamburg. 2000. Center for Therapy and Studies of Suicidal Behavior. [Online]. Available: http://www.uke.uni-hamburg.de/Clinics/Psych/TZS/TZS_e.html [accessed May 10, 2002].
University of Michigan. 2002. Introduction to PSC (Population Studies Center). [Online]. Available: http://www.psc.isr.umich.edu/intro.html [accessed May 10, 2002].
University of North Carolina. 2001. UNC Injury Prevention Research Center: Funding Description. [Online]. Available: http://www.sph.unc.edu/iprc/aboutiprc/description.html [accessed December 19, 2001].
University of Oxford. 2002. Centre for Suicide Research. [Online]. Available: http://cebmh.warne.ox.ac.uk/csr/ [accessed May 10, 2002].
University of Rochester. 2001. Suicide study awarded $3.2 million. Currents, 29(21): [Online]. Available: http://www.rochester.edu/pr/Currents/V29/V29N21/story04.html [accessed May 10, 2002].
University of the Philippines. 2002. Population Institute. [Online]. Available: http://www.geocities.com/popinst/ [accessed May 10, 2002].
Velting DM, Shaffer D, Gould MS, Garfinkel R, Fisher P, Davies M. 1998. Parent-victim agreement in adolescent suicide research. Journal of American Academy of Child and Adolescent Psychiatry, 37(11): 1161-1166.
Wagenaar AC. 1993. Research affects public policy: The case of the legal drinking age in the United States . Addiction, 88(Supplement): S75-S81.
Wallenstein S, Gould M, Kleinman M. 1989. Use of the scan statistic to detect time-space clustering. American Journal of Epidemiology, 130: 1057-1064.
Washington Department of Health. 1997. New statewide system tracks firearm-related injuries to gather information for prevention strategies. EpiTrends, 2(3): 1-2.
Washington University. 2001. Washington University Researchers Launch Silvio Conte Center. [Online]. Available: http://medicine.wustl.edu/~wumpa/news/2001/conte.html [accessed May 10, 2002].
Wasserman D, Varnik A. 1998. Reliability of statistics on violent death and suicide in the former USSR, 1970-1990. Acta Psychiatrica Scandinavica Supplement, 394: 34-41.
Wolfgang ME. 1958. An analysis of homicide–suicide. Journal of Clinical and Experimental Psychopathology, 19: 208-218.
Zeger SL, Liang KY. 1986. Longitudinal data analysis for discrete and continuous outcomes. Biometrics, 42(1): 121-130.
To be, or not to be: that is the Question:
Whether ’tis Nobler in the Mind to suffer
The Slings and Arrows of outrageous Fortune,
Or to take Arms against a Sea of Troubles,
And by opposing end them; to die to sleep
No more, and by a Sleep to say we end
The Hart-ache, and the thousand Natural Shocks
That Flesh is heir to; ’tis a Consummation
Devoutly to be wish’d to die to sleep,
To Sleep, perchance to dream; ay there’s the
Rub,
For in that Sleep of Death what Dreams may
Come…
—WILLIAM SHAKESPEARE
Hamlet, Act III, scene I.


