
Appendix A
Specific Comments
“Screening”
The word screening is used so often and in so many different contexts that it loses specificity. For example:
-
Executive Summary: “screening methodology” (at least twice), “screening value” (at least twice), “screening criterion”, and “screening results” (how is this related to scoping calculations?). How are “risk-based screening value”, “screening risk values”, and “absolute risk-based criterion” related?
-
Page 10: How are “screening values” and “risk-based screening values” related? How are “predefined screening criterion” and “risk-based screening criterion” related?
-
Page 13: How are “screening index” and “screening value” related?
-
Page 27: “screening model domain.”
“conservative and conservatism”
The word conservative is used often in the text, but with no clear explanation of its intended meaning and certainly no assurance that the meaning is consistent throughout. It seems likely that the degree of conservatism varies at different stages of the study, but it is hard to tell. For example:
-
Executive Summary: “conservative assumptions”, “significant conservatism built into the calculations”, and “The conservatism includes factors such as location and time”.
-
Page 13: “conservatively biased estimate.”
Executive Summary
In the phrase “boating is the dominant pathway”, how is boating a pathway?
Page 11
What does “The highest radionuclide concentrations in media, primarily river water and sediment, are required to ensure that exposure consequences are not underestimated” mean?
The screening analysis is supposed to be performed at Ringold (river miles 354 and 340) and 300 Area Boundary (river mile 345). It would be helpful to include a table (at or before page 11 of the draft report) of the location on the river (river-mile information) of the various reactors and the points examined in this screening. This information does not appear to be provided in the draft report, except in an obscure form in Table 5. It should be provided before the discussion of the various dams on page 16 (Figure 3); otherwise, it is difficult to appreciate the significance of the various dams for this study. It would also be helpful in the discussion of Figure 3 to identify the location on the river of the upper end of the effect of the McNary dam.
Page 12
How are “risk-based decision criterion”, “predefined decision criterion”, and “decision criterion” related? How are “important exposure pathways” and “consistent exposure pathways” related? How are “decision criterion” and “decision guide” related?
Pages 12–13
The lifetime risk estimates for a 1mSv/year dose disagree with each other.
Page 15
Figure 2 should be enlarged; RM (River Mile) 385, RM 325, and RM 327 should be clearly marked and discernible on this figure (see references to these on page 21). Compare with Figure 15, but still missing the RM labels.
Page 16
Figure 2 and other figures: much of the figures are not legible.
Page 17
What is the antecedent of “this” in “This is selected because the 32P source term appears…”?
Page 17
“An uncertainty factor of 5 is applied to these source terms.” Why is it applied and how was 5 chosen? (It was suggested at the Washington meeting that some formal analysis had been performed to justify the choice, but it is not presented in the report, so the adequacy of any such reasoning cannot be judged.)
Page 18
The method for estimating source terms for nuclides not evaluated by the HEDR Project appears to have several problems.
-
All the estimates depend entirely on three measurements reported by Soldat (1991) (Appendix E to Napier, 1991). It is extremely difficult to reconcile the ratios to 90Y given in Table 1 of the draft report with the values provided in Soldat (1991). The following table illustrates the ratios that can be computed by using Soldat (1991) and the ratios given in Table 5 of the draft report:
|
Measurement data |
Draft report |
|||
|
|
1968 |
1964 |
1956 |
Table 5 |
|
32P |
Ratios to 32P |
|||
|
45Ca |
NA |
0.035 |
0.060 |
0.05 |
|
60Co |
0.016 |
0.020 |
0.020 |
0.02 |
|
64Cu |
13 |
30 |
66 |
60 (monitoring data) |
|
122Sb |
NA |
0.5 |
NA |
0.5 |
|
90Y |
Ratios to 90Y |
|||
|
89Sr |
27 |
0.25 |
0.029 |
0.2 |
|
90Sr |
1.0 |
0.005 |
0.0019 |
0.01 |
|
93Y |
2083 |
3 |
1.3 |
2 |
|
95Zr |
158 |
NA |
NA |
1 |
|
137Cs |
NA |
0.005 |
0.00096 |
0.01 |
|
131I |
Ratios to 131I |
|||
|
133I |
8.3 |
14 |
28 |
10 |
|
65Zn |
Ratios to 65Zn |
|||
|
69mZn |
NA |
4.0 |
5.3 |
4 |
|
NA=No measurement available for computing ratio |
||||
The values and uncertainties used in the draft report for fission products require adequate explanation—for example, the ratio for 95Zr, which appears to have no basis in the measurements reported by Soldat (1991). There are too few measurements to give a reliable indication of measurement error or of the uncertainty in relative concentration between the nuclide of interest and the nuclide used as a basis. Were there no other measurements of these nuclides? Given the very large number (over 53,000) of measurements reported in Napier (1991), it seems likely that there are and that examination of some of the other data might yield better estimates of both the ratios used in Table 1 and their uncertainties. The uncertainty factor of 5 needs further justification for the fission products, given the wide variation shown above.
-
Relating activation products 69mZn and 69Zn to 65Zn appears no more reliable than relating them to 32P, in that the precursor(s) of 69Zn is (are) not the same as the precursor of 65Zn. 65Zn is produced by 64Zn(n,γ) 65Zn; (n,p) and (n,α) production reactions are precluded by a lack of stable precursor nuclides. However, although most production of 69mZn and 69Zn is likely to be by (n,γ) on 68Zn, there are stable precursors for (n,p) and (n,α) reactions (69Ga and 73Ge, respectively). Could those reactions occur to any appreciable degree? In view of the possibility, what is the justification for estimating a considerably lower uncertainty? For 133I versus 131I, a lower uncertainty is plausible. For 93Y, the text of the draft report and Table 1 are at odds with one another as to what was done: the former states that an uncertainty factor of 2 was used, and the latter shows a factor of 5.
-
It is not clear from the description and Table 1 what the “distribution” means for the nuclides not evaluated by the HEDR Project. Is the uncertainty factor 5 or 2 associated with the multiplier relating them to 32P, or is this distribution applied after estimating medial values from the median of 32P? If the latter, how do the factors of 2 and 5 compare with the uncertainties associated with nuclides that were studied by the HEDR Project?
-
It is not clear why 122Sb is treated as an activation product rather than a fission product. There should be some description of how this choice of treatment was determined.
Page 19
The text says, “The bi-weekly cumulative data reveal another level of detail”. What is it and how is it revealed? The text says, “and they provide insight into the fluctuations”. How? The text says, “sediment data are important for revealing some information”. How? The text says, “Environmental data…are the focus of environmental data compiled in the workbook.” What does that mean?
Page 20
It should be made clear that the worksheets “grab samples” and “cumulative data” are contained within the spreadsheet file (workbook) “Hanford data.xls”. It should also be made clear that the sediment deposition rates of 38–76 cm per year were behind the McNary Dam, not throughout the Hanford Reach.
Page 22
The text states, “For model calculations we consider radionuclides in both the dissolved and sorbed phase. For dissolved phase radionuclides, dispersion in the longitudinal (parallel to river
flow) and transverse (perpendicular to river flow) is considered.” However, the same is true of the sorbed phase, and no distinction is made (or should be made) in the model between dissolved phase and the phase sorbed to suspended sediment.
This page also states that “Partitioning…is described by the linear sorption isotherm or sorption coefficient (Kd) assumed to be a function of the river water concentration.” What is actually used is a sorption coefficient (usually called a partition coefficient) that is independent of river-water concentration and not a function of it.
The confluence with the Yakima River is first introduced on page 22 as the lower end of the region of interest. No indication is given, however, of how far along the river this confluence occurs (the river mile should be stated).
Page 23
Some less serious discrepancies pertaining to the mathematical model follow (one wonders, however, why it was necessary to change from Codell et al., 1982):
-
On Figure 4, “X” should be “x”, and “Y” should be “y”.
-
Figure 4 is not very good in the reproduced copies. “W” appears to be representing a measurement along the channel instead of the width, and “Y” appears to be measuring a distance along the channel instead of a distance measured across the channel.
-
The identification of x, y given on page 24 should have been given on page 23 (and in a consistent manner; see comment above).
-
C is actually a function of x, y, t; this should be shown from the beginning, and the identification of x, y, t should be given earlier.
-
Apparently, the initial condition “C=0, at t=0” means “C(x,y,0)=0”. That is, C=0 for t= 0 and all values of x, y? (However, the draft RAC report reproduces the statement of the condition as it appears in Codell et al., 1982.)
-
Codell et al. (1982) says, “uniform and steady flow” rather than “steady state velocity”; likewise, “river flow rate is at steady state” is wrong. “Uniform” presumably means that the flow does not change with location, and “steady” means that it does not change with time.
-
There is a typo in equation (4), namely, “f(t)i“ should be “fi(t)”.
-
There should be a better diagram to go with the description of this model. It should show the location of RM 385, the locations of the release points for each of the reactors, and the distance x.
Pages 23–24
-
x is used with at least two conflicting meanings. Immediately after equation (2), it is defined as the distance from the source; presumably, it has the same meaning in equation (3). However,
-
it has a different meaning in equation (4), where it is the distance downstream from RM 385. That change is partly compensated for by the use of “x−x0” in equation (4). However there is still a problem in that there are multiple sources and the notation “x0” implies that all the reactor release points are the same distance downstream from RM 385, but obviously they are not. (We were told after the RAC presentation that “x0” should have been “x0i”; “x0i” then denotes the distance downstream of source i from RM 385.) In its present form, equation (4) is incorrect. Moreover, for equation (4) to be correct, the zero of time must be chosen so that it precedes any emissions from any reactor.
-
The solution of equation (2) is not quite correctly identified; it is the concentration at time location x, y, t, assuming a unit release (that is, 1 curie) at x=0, y=ys, t=0. The distinction is the reason for equation (3).
-
The text says, “eight reactors separated by a distance of ~26 km”. That is incorrect and incomplete. The reactors are not “separated” by ~26 km, but are spread over an interval of ~26 km. Moreover, the question is not the locations of the reactors, but the locations of the release points into the river.
-
The identification of “f(τ)i” is incomplete; it is the source release rate for the ith reactor.
-
(page 31) “To reduce computational time, terms that add little to the integrand are removed from the computation. This is accomplished by calculating integration limits.” That is not quite correct, and not what it says in Codell et al. (1982). They point out that the integrand is nearly zero for part of the time interval. The limits, given in equation (15), are chosen to ensure that the exponential in equation (2) is at least most exp(−γ). Moreover, for efficient computation there are two additional restrictions on t1, t2 that are not stated in the draft RAC report:
t1≥the start time of the discharge function
t2≤the stop time of the discharge function. -
“The infinite series computation is performed for 20 terms or until no significant change in the returned value is achieved.” Instead, Codell et al. (1982), say that the infinite series is truncated after Mmax terms, where Mmax≤20.
Mmax=(W/π){(γ/[Ey(t−τ)]}0.5+1
Although the authors report that the algorithm/code for Simpson’s rule was taken from Numerical Recipes (which is a reliable source), there is still the question of numerical error, but there is little discussion of the errors.
In the draft report, equation (1) is a model for a radioactive contaminant that moves entirely with the water. However, as developed later near equations (12) and (13), it appears that what is desired is a model where there is interaction with a “fixed sediment bed” on the floor of the river. It is not specified in the draft report whether the sediment is considered to be moving with the water or is supposed to be stationary on the bed of the river, although the use of the term “fixed” suggests the latter.
In the draft report, the formulation has all the contaminant, including that in the “fixed sediment bed”, moving down river at speed u in direction x. Such a physical picture is somewhat at odds with the assumption of good vertical mixing. With good vertical mixing, one would expect that any moving sediment would be mixed throughout the water column as suspended sediment. The current formulation has essentially all the contamination moving down river at speed u, but a fraction,
is not included in any measurement of concentration in the river water (this is the fraction associated with the “fixed sediment bed”).
The draft report also breaks mass-balance by separately considering a “sediment submodel” in which suspended sediment deposits on the river bed. The draft report uses this submodel to represent the situation near shorelines, but it does not argue whether it may be applicable over the whole river or only in sections of it. Such an argument should be included in the draft report, and if necessary equation (1) should be modified as discussed below.
It is not difficult to modify equation (1) to represent a physical situation in which a layer of sediment that is in equilibrium with the water is fixed on the floor of the river and the suspended sediment is depositing on the river bed. Define (most of this notation is the same as in the draft report)
Cw = dissolved concentration in river water,
C = total concentration in river water (dissolved plus adsorbed to suspended sediment),
Kd = sediment water partition coefficient,
Ss = suspended sediment load,
Tb = thickness of the sediment bed on the bottom of the river that is in equilibrium with river water but does not move with the water,
Ex = longitudinal turbulent dispersivity (in direction x, along the river),
Ey = transverse turbulent dispersivity (in direction y, across the river),
λ = radioactive contaminant decay constant,
νd = suspended sediment deposition velocity,
u = water velocity in direction x, and
ρ = sediment dry bulk density in the sediment bed.
Then we have
and the mass-balance equation for the total concentration, C, in river water is
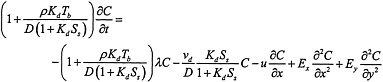
where, as in the draft report, the dissolved contaminant in the pore water of the sediment bed has been ignored.
That equation has the same form as equation (1) in the draft report, but effectively changes the meaning of the terms λ, u, Ex, and Ey. It could be argued that in most of the river νd = 0, in which case only the terms u, Ex, and Ey are modified, in that the two leftmost terms in the equation are multiplied by a factor. If the factor is close to unity, there will be little problem in ignoring it. If we use the parameters described in the draft report (the sediment bulk density of 1.2 g/ml is documented only in Table D-1, Appendix D, of the draft report), the factor is within 5% of unity at a river flow rate of 2000 m3/s for all the nuclides reported in Table 8 except 72Ga (1.36), 56Mn (1.18), 46Sc (1.24), 65Zn (1.58), and 69mZn (1.58). The relatively large discrepancy for 65Zn suggests that this factor should be taken into account in the calibration for sediment bed thickness.
The draft report should discuss accurately the physical scenario to be modeled and justify that scenario.
Page 25
It might be worthwhile to add a disclaimer to equation 5 stating that the number of digits is not justified by the accuracy of the relation, but that the full number of digits is retained for documentation purposes.
Equation (5) is said to be derived from the data in Table 2, which lists values from Walters et al. (1992) that purportedly are derived from Soldat (1962). A minor problem is that the coefficients given in this equation are not obtained to the number of digits shown by using exactly the values of Table 2. Nor are they obtained by using more accurate conversion factors than are used in Table 2 (several values are there rounded incorrectly, on the basis of accurate conversions from the values given in Walters et al. 1992). More important, the values in Walters et al. (1992) apparently do not come from Soldat (1962). Consulting the latter reference shows that the estimates for travel time t (in units of hours) as a function of flow rate F (in units of 104 cfs) are given there explicitly by these equations:
t = 92/F0.67 for 4<F≤13×104 cfs
t = 48/F0.40 for 13≤F<40×104 cfs
Soldat (1962) states clearly that a “significant break in the slope of the flow-time curves is apparent when the data are plotted on logarithmic paper” and goes on to discuss the reason for the break in the slope (at that time, the main river channel shifted at the higher flow rate at two places between 100-D and Pasco pumping stations). The values in Walters et al. (1992) clearly
are not those obtained from these relations, nor can they be related to any of the information given in Soldat (1962).
Two further pieces of information in Soldat (1962) should be mentioned. First, although the distance between 100-D and Pasco pumping stations is about 46.5 miles along the southern shoreline (47 miles was used in Table 2 of the draft report), it is about 48.5 miles along the main channel. Arguably, the latter should be used in the calculations. Second, Soldat (1962) mentions that experience with the time estimates indicated that they “more nearly represent the arrival of the leading edge of the material discharged upstream…than the arrival of the peak concentration.” Some discussion is needed as to whether either of these pieces of information has any important effect.
Equation (6) of the draft report purports to be the relation between depth and flow rate for the Columbia River. However, it provides depth estimates of about 300 m for typical flow rates, clearly too deep; and indeed this relation was not used. Instead the relation used in the flow-rate file (flowrate.data) is
D=0.163F0.447
This appears to be a much better estimate, but the origin of this relation is not documented. Such a relation should be derived from the hydrograph for the Columbia River, but there is no reference to any such hydrograph.
Page 25
-
What does “The data are then regressed…” mean? Does it mean that nonlinear least squares was used, or does it mean that log u was regressed against F? If the latter, what does the r2 value mean?
-
b. “river width and depth are held spatially constant” should be “river width and depth are assumed to be spatially and temporally constant”.
-
c. Where did equation (6) come from? Leopold et al. (1964)?
Page 26
How is the “±0.3” used in equation (8)?
Page 27
Figure 6: The y-axis should be labeled “relative concentration”.
Page 27
“Screening model domain”: These and other phrases are used so as to imply some scientific meaning, but their use is not consistent for example, conservative, exposure pathways, criterion, and risk-based. Note that a number is not a criterion but might be part of a criterion.
Page 28
Power has been confused with energy in several places. The draft report should use technically correct terms.
Page 28
The statement “The method only approximates the monthly release from each reactor and does not account for events such as fuel-element failure” could be misleading. The method includes emissions due to fuel-element failures month by month because such emissions were included by Heeb and Bates (1994), but such releases are incorrectly apportioned between all the reactors operating at the time of the fuel-element failure instead of being assigned only to the reactor in which the failure occurred.
Page 29
The physical quantity represented by Cs is an activity per unit mass, not a concentration (activity per unit volume). Both are often colloquially referred to as concentrations, but such colloquialisms should not be used in definitions, where it is important to be accurate.
Pages 30–31
The “sediment submodel” incorporates only the interchange of radioactivity between the water and the sediment, not sediment transport. It is reasonable to assume that near the dams the sediment is not being transported, but it is not so reasonable further upstream. That is, radioactivity can be transported down river either in the water or in the sediment, and the rates of movement are not likely to be the same. There should at least be some discussion of whether this simplification is reasonable.
Of the concentration of suspended sediment, it is said (page 30) that “In our model, we use a value of 10 mg L−1 for locations above and 35 mg L−1 for locations below the confluence with the Snake River.” If all the sediment, including the “fixed bed sediment”, is moving down river at the same rate as the water, equation (1) of the draft report is an adequate representation, and changing the suspended-sediment concentration is straightforward. If the “fixed bed sediment” is supposed to be stationary with respect to the river, changing the suspended-sediment concentration is not so straightforward, in that all the parameters in the solution for concentration then depend on the suspended-sediment concentration (Ss). It would be necessary to match solutions above and below the point of change.
Page 31
-
“The convolution integral is solved using Simpson Rule integration” should be “The convolution integral is approximated by using Simpson’s rule”. Is “convolution integral” a reference to equation (3)? If not, what?
-
“Terms that add little to the integrand are removed from the computation”: What terms, and how is it decided that they add little to the integrand?
-
The description “where γ is an arbitrary number chosen to be 50” on page 31 below equation (15) is incorrect. There is nothing arbitrary about the choice of γ. In fact, exp(−γ) is chosen to be the size of the exponential factor preceding the bracketed sum in equation (2) that is considered sufficiently small to neglect. A better choice would be to select γ large enough so that the relative size of this exponential term is small compared with its largest value (in the integration), rather than its absolute size being small compared with unity.
-
What “infinite series calculation”? One does not “perform” an infinite series calculation. Perhaps what is meant is that the infinite series was truncated after 20 terms. What is a “returned value”?
There is no need for computer codes to numerically integrate equation (3). As noted in the draft report, equation (1) has a solution, namely, equation (2), corresponding to an instantaneous unit release at x=0, y=ys, at t=0. What is required is an integral of this solution, as indicated in equation (3) of the draft report. In equation (3), however, the source strength, f(t), consists of a sequence of constants, because the source strength is assumed to be constant throughout each month for each reactor discharge. Equation (3) can thus be written in terms of the unweighted integral of equation (2). What is not noted in the draft is that equation (2) can be analytically integrated with respect to time.
Each term in the series in equation (2) of the draft report has a time dependence of the form
where
The time integration may be performed term by term in the sum by using
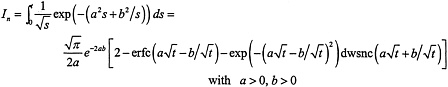
where, as usual,
and dwsnc is the function defined by
dwsnc (x)=exp (x2) erfc (x)
(this function is asymptotically of order 1/x for large positive x and has been named to indicate that it is a complementary form of Dawson’s integral).
This expression is written so that the steady-state solution is obvious (the erfc and dwsnc terms vanish when t gets large), although in this form there could be substantial cancellation (with attendant loss in accuracy) from the subtractions when
When that is true, it is useful to rewrite the expression as
because this performs the subtraction analytically to allow more-accurate numerical computation.
Equation (14) of the draft report probably also does not need any special-purpose computer code (and certainly not an ODE solver). The integral of equation (14) may be expressed as
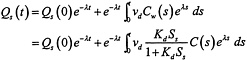
and the integral on the right can be analytically integrated in the way just described.
Even if those analytic integrals are not used in the calculations, they provide an accurate way to test any code that is used, and such tests should be performed.
The draft report notes on page 31 that “the infinite series calculation is performed for 20 terms or until no significant change in the returned value is achieved.” For small values of t, there is no need for 20 terms. In computing this sum, great advantage can be gained by using the identity (see, for example, Whittaker, E.T., and Watson, G.N., 1996)
Using that expression, with
and using
gives
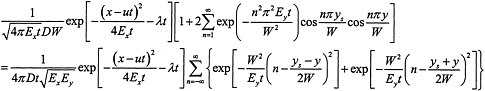
The left-hand side of the identity is equation (2) of the draft report, in which the summation converges rapidly for large t, whereas the summation on the right-hand side converges rapidly for small t. The right-hand side also has the obvious numerical advantage that it is a sum of positive terms, whereas for small t the terms on the left-hand can oscillate in sign. The “lake solution” discussed by Codell et al. (1982) can obviously be derived from the right-hand side of this equation (in the limit of W tending to infinity).
A little numerical analysis shows that, using both representations for the solution, it is never necessary to extend the summation beyond n=3 on the left-hand side or beyond n=4 on the right-hand side, to achieve double precision (52-bit, approximately 10-16). The left-hand side should be chosen for times
and the right-hand side otherwise. With the parameters involved here (Ey=0.6 m2/s, and W of order 500 m), the right-hand side would be used for all times less than about 36 hours.
Page 32
The matter of model verification
According to the draft report, “Model verification is defined here as confirmation that the model has been coded and implemented in the computer code correctly.” That objective was purportedly achieved by comparison with the RIVLAK code for a single case corresponding to release of “a total of 39.217 Ci released over 13 s”, and the “agreement” is documented in Table 3 of the draft report.
The committee does not agree that the results shown in Table 3 of the draft report provide adequate verification of the RVRDSP code according to the stated definition. Table 3 shows differences ranging up to 3% in the output from the codes. However, the two codes are supposed to solve the same mathematical problem by using essentially the same algorithm. RVRDSP is also supposed to contain a precision parameter that was set at 10-6. Under such conditions, one would expect outputs that are identical to high precision or whose difference can be explained. It is not good enough to observe that the results are within acceptable accuracy for comparison with observations, inasmuch as what is being compared here is not one mathematical model with the physical world but two implementations of an identical mathematical model. The substantial differences documented in Table 3 should have triggered an investigation of the source of such large discrepancies.
Further examination of the example in Table 3 combined with the input and output files provided to the committee (in the f77/benchmark subdirectory of the accompanying CD ROM) shows the following:
-
The source release used for RVRDSP differs from that used for RIVLAK for this example. The release pulse occupied 11 s (the draft report is incorrect in stating that it lasted 13 s), but the input for RVRDSP has a source strength during 7.1–11 s that differs from the source strength used for RIVLAK for 7.1–11 s. The effect is that RVRDSP is modeling a release that is about 1% larger than that modeled by RIVLAK.
-
There are other slight differences between the input to RVRDSP and the input to RIVLAK. For example, the down-river distance input to RVRDSP is 2133.0 m, but that input to RIVLAK is 2133.6 m. Computing an accurate result with exactly the same inputs as used for RVRDSP (as opposed to those used for RIVLAK) appears to give agreement with the output of RVRDSP to within about 2×10⁻⁴, which is about the accuracy to be expected from RVRDSP with its current bugs (see below).
-
This example is constructed in such a way that RIVLAK approximates the solution (for all the times in Table 3 of the draft report) using the “lake solution” algorithm described in Codell et al. (1982), not the series solution. That RIVLAK uses alternative solution methods for different values of the parameters indicates that more-extensive testing of RVRDSP is in order, in that agreement for one set of parameter values is no guarantee of agreement for other sets, particularly if different solution algorithms are used for different ranges of parameter values.
-
The committee believes that RIVLAK itself has not been adequately tested and verified to the extent that it can necessarily be used for verification of a second code. An examination of the code given in Appendix C of Codell et al. (1982) revealed the following coding errors in RIVLAK (and there might be others):
-
Page C.4, line 1280ff. This linear interpolation routine has an error. If the time at which the source strength is required is equal to the first time in the source table (T(1)), the linear-interpolation routine erroneously returns the value zero instead of the correct source strength (W(1)). For the example in Table 3 of the draft report, where the lower limit of the integration is set (by the code) as equal to a time corresponding to the start of the source, the result produced by RIVLAK is erroneously slightly low. The first ordinate in the Simpson’s rule integration is given the value zero, instead of the finite value required; this error affects both the BASIC and FORTRAN versions of the code given by Codell et al. (1982).
-
Page C.4 line 1170. When N1=N2, so that T3 is incremented the last time during the Simpson’s rule integration, there is no guarantee that the multiple real additions will round in such a way that the last value of T3 is equal to the upper bound of the integration (T9). If the upper bound of the integration is equal to the last entry time in the source table (T6), as occurs in the example given in Table 3 of the draft report, and if the last value of T3 exceeds T9 even by machine rounding error, the linear interpolation routine (line 1280ff) will return a value of zero for the source strength, rather than the
-
-
correct nonzero value. On the machine-compiler-interpreter combination(s) used by Codell et al. (1982), this did not occur for the example given (Figure 2.17 and 2.18), but it does occur on an Intel-processor based machine using double-precision variables. The RIVLAK code as described by Codell et al. (1982) therefore produces machine-dependent (and possibly compiler- or interpreter-dependent and possibly input time-unit-dependent1) results. The same problem affects both the BASIC and FORTRAN versions of the code given by Codell et al. (1982).
-
Page C.5, line 1760. The line “NEXT M3” should read “NEXT M5”. This could have had no effect on the examples provided by Codell et al. (1982) and corresponding to Table 3 of the draft report, because line 1760 is not executed in those examples. Moreover, it is plausible that the BASIC compiler or interpreter in use at the time by Codell et al. (1982) ignored the symbolic name after the “NEXT” in this statement. The modern compiler used by the committee catches this coding error and will not compile the code until the error is corrected. The error affects only the BASIC version of the code.
Taking account of the coding errors, the committee could reproduce both incorrect and correct results with RIVLAK—using a copy of the RIVLAK code (with or without the errors corrected) and an alternative implementation—to the expected precision (the six digits shown in Codell et al. 1982, Figures 2.17 and 2.18). However, the committee’s tests were not sufficiently extensive to be considered a verification of even its own corrected version of RIVLAK.
The test case also does not necessarily give very good verification for releases lasting a month at a time, the situation that is actually modeled (each month is said in the draft report to be treated as being at a steady discharge rate). Indeed, for this particular test case, using equation (2) for an instantaneous release centered on the 11-s release time gives solutions that are more accurate than RVRDSP. More extensive verification against the analytic solutions, particularly for longer release times, are required to warrant any confidence in the accuracy of the coding.
Page 34
The symbol for bed sediment thickness changes from Tb to Tk.
Page 36, equation 17
The fractional bias is incorrectly defined. The correct definition is:
Page 38
There appear to be discrepancies between tabulated values and those used in input files. Table 8 indicates a calibrated Ey for 72Ga of 0.6 m2/s, but at least one input file uses a value of 0.25 m2/s (both with the tabulated Kd).
Page 56
How is it known that “it was appropriate to use an exposure time larger than the HEDR calculations”?
Page 68
In Table 1S, the footnote should be shown in the appropriate place in the tabulated data.
Page B-3
Was CHARIMA modified to WSU-CHARIMA by PNL or by RAC? If PNL did it, then there should be a citation and reference; if RAC, the details should be given as to what the changes are and how they were validated.
Page D-4
In Table D-3, some units need to be corrected.
Additional material
The spreadsheet “release rates.xls” provided to the committee contains misleading information.
The reactor operating periods are documented in the report and apparently in the spreadsheet “reactor operations.xls.” However, in apportioning releases (apportionment governs the effective release history used), the spreadsheet “release rates.xls” shows a different history:
|
Reactor |
Report |
“Release rates.xls” |
|
B |
10/44 |
10/44 |
|
D |
12/44 |
10/44 |
|
F |
02/45 |
01/45 |
|
H |
11/49 |
01/49 |
|
DR |
10/50 |
10/44 |
|
C |
11/52 |
01/52 |
|
KW |
01/55 |
01/55 |
|
KE |
04/55 |
01/55 |
|
N |
|
01/50 |
However, it appears that these dates, and the entire apportionment approach included in “release rates.xls,” were not used. The presence of these incorrect dates and the apportionment calculations in this spreadsheet is therefore confusing.


