
Executive Summary
Children in the United States travel to and from school and school-related activities by a variety of modes. Because parents and their school-age children have a limited understanding of the risks associated with each mode, it is unlikely that these risks greatly influence their school travel choices. Public perceptions of school transportation safety are heavily influenced by school bus (i.e., “yellow bus”) services. When children are killed or injured in crashes involving school buses, the link to school transportation appears obvious; when children are killed or injured in crashes that occur when they are traveling to or from school or school-related activities by other modes, however, the purpose of the trip is often not known or recorded, and the risks are not coded in a school-related category. Despite such limitations and the fact that estimates of the risks across school travel modes are confounded by inconsistent and incomplete data, sufficient information is available to make gross comparisons of the relative risks among modes used for school travel and to provide guidance for risk management.
Each year approximately 800 school-aged children are killed in motor vehicle crashes during normal school travel hours.1 This figure represents about 14 percent of the 5,600 child deaths that occur annually on U.S. roadways and 2 percent of the nation’s yearly total of 40,000 motor vehicle deaths. Of these 800 deaths, about 20 (2 percent)—5 school bus passengers and 15 pedestrians— are school bus–related.2 The other 98 percent of school-aged deaths occur in passenger vehicles or to pedestrians, bicyclists, or motorcyclists. A disproportionate share of these passenger vehicle–related deaths (approximately 450 of the 800 deaths, or 55 percent) occur when a teenager is driving. At the same time, approximately 152,000 school-age children are nonfatally injured during normal school travel hours each year. More than 80 percent (about 130,000) of these nonfatal injuries occur in passenger vehicles; only 4 percent (about 6,000) are school bus–related (about 5,500 school bus passengers and 500 school bus pedestrians), 11 percent (about 16,500) occur to pedestrians and bicyclists, and fewer than 1 percent (500) are to passengers in other buses.
In the Transportation Equity Act for the 21st Century (TEA-21) of 1998, Congress mandated that the Transportation Research Board undertake a study “of the safety issues attendant to the transportation of school children to and
from school and school-related activities by various transportation modes.” In the process, the study was to take into account available crash injury data, as well as vehicle design and driver-training requirements, routing, and other operational factors that affect safety. If crash injury data were found to be unavailable or insufficient, a new data collection regimen and implementation guidelines were to be recommended.
In response to this mandate, this report provides estimates of the relative risk among school travel modes using available information collected at the national level. Because data on trip purpose are not included in the available datasets for all modes, the data analyzed represent deaths and injuries that occurred during normal school travel hours as defined earlier. This approach to estimating exposure to risk is obviously different than an analysis based on trips taken specifically to and from school; because of the varied schedules and many activities of today’s school children, however, the generic trip to and from school is difficult to define even with complete data. Regardless, as illustrated below, the substantial differences in risk across modes that are illuminated with these risk estimates cannot easily be explained away by any biases that might result from using this time-based estimating procedure.
As noted above, the focus of the study was not restricted to children traveling to and from school, but also encompassed their travel to and from school-related activities.3 However, as discussed more fully in Chapters 2 and 3, crash data for school-related trips—which comprise roughly 4 percent of all school transportation—are not directly available. In a limited number of instances, these data may be inferred from other information that is recorded on police accident reports, but this is the exception. Compounding the difficulty of drawing conclusions from such data, different types and mixes of vehicles are often used for school-related purposes, and some trips do not occur during the above-defined school travel hours. Hence, the data and analyses presented in this report are restricted to crashes that occurred during normal school travel hours. Those school-related activity trips that took place during normal school travel hours are included in the analyses, but could not be separated out for more focused analysis.
Because specific data (e.g., crash, injury, fatality, miles traveled, trip) for comparing the relative safety of narrowly defined individual travel modes are either unavailable, insufficient, or inadequate, the committee grouped the various modes used for school travel into six broad categories for which sufficient data could be obtained to support the required analyses: (a) school buses (i.e., regular and special education pupil transportation services), (b) all other buses (e.g., transit, paratransit, and motorcoach service), (c) passenger vehicles driven by operators 19 years of age and older (primarily personal vehicles, but also taxicab and child transport services deploying non–yellow buses or vans),
(d) passenger vehicles driven by operators younger than 19 years of age,4 (e) bicycles,5 and (f) walking.
Many risk factors (e.g., child behavior, infrastructure design, and the use of safety equipment) play a role in determining school travel risk, and the relative importance of these factors varies significantly not only across the different travel modes, but also among communities and school districts. Long lists of risk factors would not promote or allow a systematic comparison of the various transportation modes. To simplify and better inform the risk comparison process, the committee grouped the various risk factors into five categories: (a) human, (b) vehicular, (c) operational, (d) infrastructure/environmental, and (e) societal. Although much of the information on these factors presented in this report is nonquantitative, research findings provide insights that may affect risk from mode to mode and on interventions that may be used to improve safety.
FINDINGS
The data used throughout this report were extracted from three main sources:
-
Nationwide Personal Transportation Survey (NPTS)—contains travel information used to estimate the number of trips taken and miles traveled by school-age children for all modes.
-
Fatality Analysis Reporting System (FARS)—contains data on all police-reported fatal traffic crashes that occur on public roadways in the United States, used to analyze student fatalities.
-
National Automotive Sampling System (NASS) General Estimates System (GES)—contains data on a nationally representative stratified sample of police-reported traffic crashes that occur on public roadways in 60 geographic sites across the United States and that result in property damage, injury, or death, used to analyze student injuries.
Some problems of data quality and quantity were addressed by grouping the data into age categories, by averaging data across multiple years, and by combining injury categories. Doing so allowed the committee to smooth out data anomalies caused by small sample sizes and to construct more robust estimates. This was necessary because of the relatively infrequent occurrence of severe injuries and deaths for particular travel modes in any given year during normal school travel hours. Because NPTS and GES data are based on samples from much larger populations, the national risk estimates derived from these samples are uncertain. Therefore, the committee modeled this uncertainty throughout all risk calculations. For some travel mode/crash categories, the uncertainty can be large because of rare events and sampling biases.
TABLE ES-1 Estimated Annual Trips and Student-Miles Traveled by Mode During Normal School Travel Hours
|
Mode |
100 Million Student Trips (%) |
100 Million Student-Miles (%) |
|
School bus |
58 (25) |
313 (28) |
|
Other bus |
5 (2) |
38 (3) |
|
Passenger vehicle, adult driver |
105 (45) |
580 (51) |
|
Passenger vehicle, teen driver |
34 (14) |
184 (16) |
|
Bicycle |
5 (2) |
4 (<1) |
|
Walking |
28 (12) |
15 (1) |
|
Total |
235 (100) |
1,134 (100) |
|
Source: 1995 NPTS. |
||
Exposure to Risk
Using the NPTS dataset, it is possible to estimate the total trips and distances traveled by various modes during normal school travel hours (see Table ES-1). These estimates were derived from the most recent survey completed and available at the time of this study (the 1995 survey). On the basis of this survey, school bus services account for 25 percent of trips6 and 28 percent of student-miles traveled7 during normal school travel hours. Other buses, typically but not exclusively transit buses, account for another 2 to 3 percent of school trips and student-miles during these same time periods,8 while trips by passenger vehicles, whether the driver is an adult (defined as age 19 or older) or teen (defined as younger than age 19), represent about 60 percent of trips and two-thirds of student-miles. Naturally, the distance traveled per trip varies by mode. For example, even though student pedestrian travel accounts for 12 percent of trips,
TABLE ES-2 Average Annual Student Injuries and Fatalities by Mode During Normal School Travel Hours
|
Mode |
Injuries (%) |
Fatalities (%) |
|
School bus |
6,000 (4) |
20a (2) |
|
Other bus |
550 (<1) |
1 (<1) |
|
Passenger vehicle, adult driver |
51,000 (33) |
169 (20) |
|
Passenger vehicle, teen driver |
78,200 (51) |
448 (55) |
|
Bicycle |
7,700 (5) |
46 (6) |
|
Walking |
8,800 (6) |
131 (16) |
|
Total |
152,250 (100) |
815 (100) |
|
a Includes 5 passenger and 15 pedestrian fatalities. Source: 1991–1999 FARS and GES. |
||
these trips represent just 1 percent of all miles traveled. These differences are important to consider when analyzing risk measures.
Injuries and Fatalities
Injuries and fatalities to children traveling to or from school occur infrequently enough that a single year of data can be misleading. Therefore, data from 9 years (1991–1999) were combined. Average yearly counts of deaths and estimates of injuries during this period for the six modal classifications used in this study are depicted in Table ES-2. Approximately 75 percent of the deaths and 84 percent of the injuries in crashes occurred in the two passenger vehicle categories. Fatalities and injuries to student bicyclists and pedestrians involved in crashes represent the next-largest share—22 percent of fatalities and 11 percent of injuries.9
When school travel modes are compared, the distribution of injuries and fatalities (shown in Table ES-2) is found to be quite different from that of trips and miles traveled (shown in Table ES-1). Three modes (school buses, other buses, and passenger vehicles with adult drivers) have injury estimates and fatality counts below those expected on the basis of the exposure to risk implied by the number of trips taken or student-miles traveled. For example, school buses represent 25 percent of the miles traveled by students but account for less than 4 percent of the injuries and 2 percent of the fatalities. Conversely, the other three modal classifications (passenger vehicles with teen drivers, bicycling, and walking) have estimated injury rates and fatality counts disproportionately greater than expected on the basis of exposure data. For example, passenger vehicles with teen drivers account for more than half of the injuries and fatalities, a much greater proportion than the 14 to 16 percent that would be expected on the basis of student-miles and trips.
Injury and Fatality Rates
By combining the data presented in Tables ES-1 and ES-2, it is possible to develop measures of risk that permit gross comparisons of relative safety among modes. The highest rate of student injuries and fatalities per trip during normal school travel hours occurs for passenger vehicles with teenage drivers, followed by student cyclists (see Table ES-3). On a per-mile basis, however, school-aged bicyclists have the highest injury and fatality rates, followed by school-aged pedestrians, then students who travel in passenger vehicles with teenage drivers. The fatality rates for passenger vehicles driven by teenagers is roughly 8 times higher than the rate for those driven by adults. School buses and other buses have the lowest injury and fatality rates.
Figures ES-1 through ES-4 show how uncertainty in the underlying data affects the estimates of risk for each mode. The horizontal bars represent the best estimates. (The numerical values for these bars are shown in Table ES-3). The vertical bars represent a 90 percent confidence interval for each estimate (that is, there is a high likelihood that the actual fatality or injury rate falls within this interval). For some modes (e.g., school buses and other buses in Figures ES-3 and ES-4), the interval is very tight and cannot easily be seen on the graphs. In some cases, the confidence intervals for the modes overlap, implying that it is not possible to determine whether the risks associated with the modes (e.g., bicycles and passenger vehicles with teen drivers in Figure ES-2) are actually different.
Despite this report’s focus on crashes during normal school travel hours, the committee thought it important to report for comparison the risks faced by school-age children during non–school travel hours. On a per-trip basis and across the four age groupings, travel risks during non–school travel hours are approximately twice what they are during normal school travel hours. On a
TABLE ES-3 Estimated Student Injury and Fatality Rates by Mode During Normal School Travel Hours
|
Mode |
Injuries |
Fatalities |
||
|
Per 100 Million Student Trips |
Per 100 Million Student- Miles |
Per 100 Million Student Trips |
Per 100 Million Student-Miles |
|
|
School bus |
100 |
20 |
0.3 |
0.1 |
|
Other bus |
120 |
20 |
0.1 |
<0.1 |
|
Passenger vehicle, adult driver |
490 |
90 |
1.6 |
0.3 |
|
Passenger vehicle, teen driver |
2,300 |
430 |
13.2 |
2.4 |
|
Bicycle |
1,610 |
2,050 |
9.6 |
12.2 |
|
Walking |
310 |
590 |
4.6 |
8.7 |
|
Overall rate |
650 |
130 |
3.5 |
0.7 |
|
Source: 1991–1999 FARS and GES. |
||||
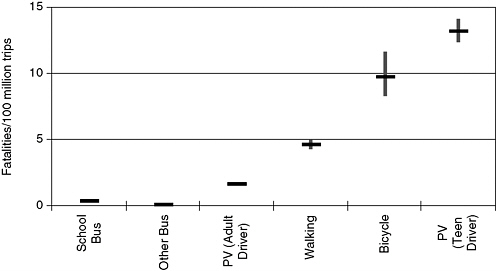
FIGURE ES-1 Student fatality rates per 100 million trips by mode during normal school travel hours with 90 percent confidence intervals (PV = passenger vehicle).
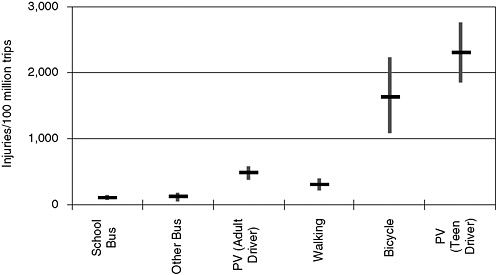
FIGURE ES-2 Student injury rates per 100 million trips by mode during normal school travel hours with 90 percent confidence intervals (PV = passenger vehicle).
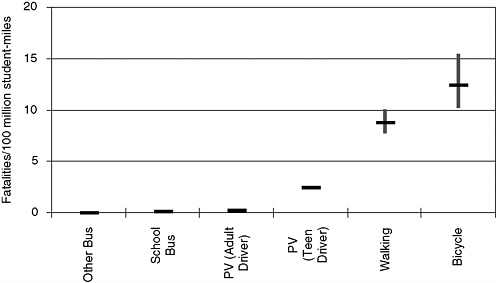
FIGURE ES-3 Student fatality rates per 100 million miles by mode during normal school travel hours with 90 percent confidence intervals (PV = passenger vehicle).
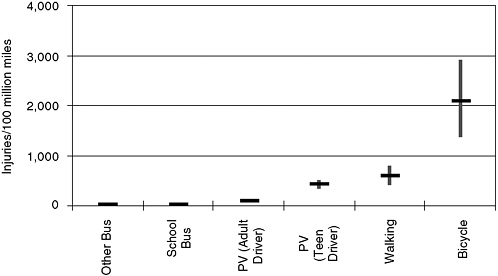
FIGURE ES-4 Student injury rates per 100 million miles by mode during normal school travel hours with 90 percent confidence intervals (PV = passenger vehicle).
per-mile basis, the risks are approximately 20 percent higher during non–school travel hours, but vary slightly with different age categories.
CONCLUSIONS AND RECOMMENDATIONS
Risk management of school travel is complex. School officials, parents, and students often choose or encourage the use of modes of travel for reasons other than maximizing safety or minimizing risk (e.g., convenience, flexibility, budget). Moreover, in the committee’s judgment, there is considerable variation among U.S. communities in the accommodations and levels of protection afforded to students using the various modes with regard to the human, vehicle design and equipment, operational, infrastructure/environmental, and societal factors that influence safety. The estimates of risk provided in Table ES-3, therefore, do not reflect fully the variations in safety and relative risk that exist at the local or school district level. Nonetheless, the large differences in risks faced by school-aged children across travel modes suggest that some modes, in general, are safer than others. Different results among communities that have implemented specific risk mitigation programs suggest that more can be done to manage these risks.
Managing Risk
The committee developed a risk assessment process in which quantitative estimates of travel mode risk derived from national statistics (or other sources) can be combined with local student demographics and travel mode distributions to calculate risk estimates for a school or region. Using this process, school officials, parents, and students can better understand, prioritize, and manage the risks of school travel. Moreover, the effects of changing the relative safety of a mode or shifting students among modes can be appreciated. In particular, the committee’s approach can highlight when policy changes intended to improve one aspect of safety inadvertently increase risks in other areas.
Because the committee’s findings are based on national averages and current modal experience, exact risk reductions that would occur for a local school district using various risk mitigation measures cannot be determined. Each district has unique environmental and operational characteristics that result in different levels of risk associated with each mode. Shifting students from those modes that are overrepresented in crashes (bicycling, walking, and passenger vehicles with teenage drivers) to those that are underrepresented (school buses, other buses, and passenger vehicles with adult drivers) is one way of lowering risks that should be considered. This is not, however, the only way to manage the risks associated with school travel; measures designed to enhance the safety of particular modes—e.g., changing school bus pick-up and drop-off locations, changing passenger vehicle pick-up and drop-off locations, enforcing bicycle helmet laws, and implementing and enforcing graduated driver licensing programs— can also be employed. To help inform the risk mitigation evaluation process, the committee has also created for each school travel mode safety checklists that delineate opportunities that have been shown to reduce risk or are accepted as best practice. Combining quantitative risk assessment measures with these
safety checklists creates a risk management framework that can be used to provide guidance to those who must make many types of safety-related school travel decisions.
This risk management framework can help inform local decisions on such matters as school siting, student parking policies, and changes in the minimum walking distance (the distance from school below which school bus service is not provided). The framework reveals, for example, that the absence of adequate infrastructure for pedestrians and bicyclists, measures that make it easier for high school students to park, or a simple change in the minimum walking distance could easily increase the overall student travel risk. Alternatively, providing additional after-school bus service or restricting off-campus trips during school hours could improve safety significantly.
Risk estimates developed using the committee’s risk management framework can also be helpful to local and state transportation agencies in making more informed decisions regarding the allocation of available funds for infrastructure improvements designed to reduce situations in which motor vehicles, pedestrians, and bicyclists conflict with one another. These estimates can assist as well in determining the advisability of policies to address bicycling safety (such as helmet laws), strategies to improve occupant safety (such as laws mandating use of safety belts), and strategies to reduce the risks of teen driving (such as graduated licensing programs already enacted in many states). At the federal level, estimates developed in this report indicate that more evaluation and research are needed to assist state and local decision makers in reducing student risk in the most cost-effective manner.
To increase the likelihood of implementing effective policies, it is important to have input and support from all stakeholders. To this end, there must be open communication in sharing information on policies, procedures, and guidelines that enhance safety. If the participants in such a process understand the risks associated with the various modes and the means by which those risks can be reduced, they can work cooperatively to achieve safety improvements. Knowledge of the relative risks of the various modes can be used by communities to focus resources on those modal improvements for which the expenditure of resources can effect the greatest safety improvements. A well-thought-out risk management program that measures the risks and benefits of the various modes and identifies a set of risk mitigation alternatives for each mode would facilitate relevant discussions among the stakeholders.
Recommendation 1: School transportation planners and policy makers at all levels should analyze transportation risks comprehensively in their decision making related to school travel.
Application of the results of risk analyses—a major component of the committee’s risk management framework that is illustrated in Chapter 5—reveals how decisions affecting one mode of school travel influence the risks faced by users of other modes. Decisions about such issues as increasing or decreasing
student parking, changing the minimum walking distance, and providing bus services can significantly affect overall risk in ways that may not appear obvious. The risk management framework can highlight the importance of such choices and allow a full appreciation of their implications. It does not, however, stand alone. School transportation planners and policy makers must also take into account budget constraints, local conditions and values, local data, and judgments about the relative safety and cost-effectiveness of alternative policies.
Recommendation 2: Using a systematic risk management framework, school districts should identify the risk factors most salient for the modes of school travel used by children in their community and identify approaches that can be used to manage and reduce those risks, including shifts to safer modes and safety improvements within each mode.
Each school district, and even schools within a district, will have different conditions and requirements that will affect school travel risks and the choices of officials and parents for reducing those risks. When resources permit, districts should support strategies that promote safety, such as reducing the number of teen drivers, designing bus services to better meet needs (e.g., offering early and late bus services, and providing bus services to different morning and afternoon locations), as deemed appropriate for that school or district. Districts can also adopt policies designed to support walking and bicycling to school in order to promote healthy lifestyles after carefully assessing the adequacy of sidewalks, bicycling paths, crosswalks, and other supporting infrastructure and safety measures, and making improvements where needed.
Recommendation 3: The U.S. Department of Transportation (USDOT) should disseminate information presented in this study on the relative risks of using various modes of travel for school and school-related activities and on possible ways to mitigate the risks. USDOT should also use this information to assess what role, if any, federal policy makers should have in efforts to improve the transportation safety of school children and the cost-effectiveness of specific safety measures.
State and local legislators, school boards, parent–teacher associations, private and church schools, parents, students, and the media all play a role in decisions about school transportation. The national-level data presented in this report provide a starting point for such decision making by highlighting the considerable differences in risk across modes of travel. Local risk estimates will differ from these national estimates, however. School officials, as well as state and local officials responsible for transportation facilities and operations, parents, and others, need information on how to assess the adequacy of their school transportation systems. They also need information on the relative risks and
cost-effectiveness of various safety measures, and on how to promote safety across and within modes in the most cost-effective ways. Such information is currently lacking.
Data
Numerous databases contain information related to transportation safety. Most of these databases, however, were not useful for this study because they do not allow comparison across modes so that exposure to risk can be analyzed in a consistent manner. One of the primary responsibilities and contributions of the agencies whose mission encompasses issues related to school transportation is to collect good, accurate, reliable data. Current data are illuminating, but not complete. Yet obtaining more thorough and complete data is not without cost. Given the large number of fatalities and injuries that occur on highways in the United States and the relatively small proportion that involve students during normal school travel hours, the benefits of additional data collection efforts focused solely on school travel should be carefully considered before such efforts are recommended or implemented.
At present, the lack of uniformity in local- and state-level data collection requirements and methodology, together with the lack of consistency in definitions and interpretations across and within datasets, makes it difficult and often impossible to address student as well as other transportation issues of interest. An integrated data system (one in which different databases would use many of the same variables, definitions, and data collection procedures) is needed to enable a better understanding of the risks associated with the various modes of travel, not just for school transportation safety, but for highway safety in general. If performed correctly, a consistent, comprehensive data collection effort could benefit school transportation as well.
Recommendation 4: The compatibility and completeness of existing databases should be examined and improved by USDOT and other agencies to allow development of better risk estimates. To the extent possible, critical data elements (e.g., vehicle classifications, roadway classifications) should be included and defined consistently in all the datasets.
The three data sources relied upon in this report—NPTS, FARS, and GES— are the best available but are not fully compatible because of different variables, definitions, and classifications. A first step would be for USDOT and other appropriate agencies to explore the possibility of changing definitions and classifications to make them more consistent. Doing so would enable the development of more precise risk estimates than could be accomplished in this study. Similarly, it may be possible to adjust for weaknesses in one or more of these datasets by examining other datasets. For example, GES excludes nontraffic injuries, such as a fall from a bicycle when no motor vehicle is involved, thus introducing a bias in the estimates. Sample data from hospital records on bicycling injuries might allow for adjustments to correct for such bias.
Recommendation 5: USDOT and appropriate agencies, in consultation with outside experts, should analyze the advisability and cost-effectiveness of establishing and maintaining any new school transportation–related database.
The committee encountered many difficulties in developing estimates of risk by mode for school travel and could develop only national-level estimates. Moreover, it was not possible to estimate the risk of travel for school-related activities because of a lack of relevant data. However, the magnitude of the school transportation safety problem does not appear to warrant major expenditures for new data collection efforts. Rather, cost-effective means of collecting new data using existing structures, both governmental and nongovernmental, should be explored and identified. The national school bus loading zone fatality survey conducted annually by the Kansas Department of Education, for example, is a volunteer data collection structure that has provided valuable information for more than 30 years at minimal cost.
It is also important to know the purpose for which data are to be used before they are collected. It may be that estimates of cost-effectiveness and better estimates of risk can be derived by carrying out Recommendations 3 and 4 without the need for extensive new data collection; if not, it may be prudent to collect more and better data. Such choices, however, should be based on the policy decisions the data are expected to inform.
SUMMARY
Without doubt, travel of children to and from school is a complex and sensitive issue. Each travel mode has its attendant risks, which vary from community to community and school to school, and any shifts from one mode to another can have a marked effect on the overall safety of school travel for a particular community or school. A risk management framework can be used to identify, analyze, and prioritize the risks associated with student travel, and in turn to formulate interventions that can be used to manage these risks. Risk measures can be applied to analyze alternative policies at the state and local levels, and various existing countermeasures can be implemented to reduce the risks to students who use the various modes. Each state, school district, and private school must assess its own situation and circumstances and apply the information presented in this report to make sound, informed decisions. The goal is to improve safety for all children traveling to and from school and school-related activities and to provide communities with the information needed to make informed choices that balance their needs and resources.
REFERENCE
Abbreviation
NCST National Conference on School Transportation
NCST. 2000. National School Transportation Specifications and Procedures, 2000 Revised Edition. Proceedings of the Thirteenth National Conference on School Transportation. Central Missouri State University, Warrensburg.


