3
Analysis of Risk Measures
A relative risk comparison across the various school travel modes is provided in this chapter on the basis of national data. The committee was unable to collect sufficient data at either the local or statewide level that would have permitted similar comparisons and believes that only the national datasets described in Chapter 2 are sufficiently complete for conducting a statistical risk comparison.
Four risk measures (hazard rates) were studied: deaths/100 million student-miles, deaths/100 million trips, injuries/100 million student-miles, and injuries/ 100 million trips. To determine these hazard rates, ratios of values were calculated (outcome measure/exposure measure). The outcome measures were extracted from the FARS and GES databases; the exposure measures were based on values from the NPTS database.
In all cases, data were selected on the basis of normal school travel hours as defined in Chapter 1. Ideally, the committee would have liked to identify only those trips whose purpose was transporting children to and from school; however, because different databases use different criteria for recording trip purpose, it was not possible to determine accurately which trips were to or from school per se. Therefore, the committee used a time-of-day filter. As described earlier, this meant that only events (i.e., trips, injuries, and fatalities) occurring during the nominal school year (September through June) on weekdays between 6:00 a.m. and 8:59 a.m. and between 2:00 p.m. and 4:59 p.m. were included in the calculations. This assumption means that events not directly related to school travel (e.g., after-school trips to part-time jobs, the library, or a shopping center) that occurred during these hours are included in the analyses, and school-related events outside the defined times are excluded. The committee believes that these anomalies do not significantly detract from the analyses for two reasons: (a) the majority of trips taken by the target age groups during these times would be school-related, and (b) the accident rates for the non-school-related trips would not be very different from those for the actual trips to and from school (e.g., similar lighting and driving conditions).
Hazard rates were calculated for different subgroups of the student population depending on the quantity and quality of the data. Subgroup categories studied were male/female, urban/rural, a.m./p.m., and four groupings of ages (5–10, 11–13, 14–15, and 16–18). Finer (more detailed) categories are not supported by the data. For example, it would have been useful to calculate deaths/trip for rural, 17-year-old, female drivers and compare the results for this group and similar urban drivers. However, the rarity of some of the events of interest (the relatively low frequencies of severe injuries and deaths for
particular travel modes in a given year during normal school travel times) and the variability of the sampled data did not allow for meaningful comparisons at this level.
Some of these data problems were handled by organizing the data into age groupings instead of considering single-year ages, by averaging across multiple years (e.g., 1991–1999), and by combining outcome categories (e.g., summing the three injury levels into one category). Doing so allowed the committee to smooth out data anomalies (e.g., unusually safe or dangerous years1) and derive more robust estimates of the average risks. Even with this collapsing of categories and averaging, however, some modes could not be included reliably. For example, even though motorcycles were responsible for seven student deaths in urban areas during normal school travel hours during 1991–1999, the 1995 NPTS data, which are based on a relatively small sample of surveys, show no corresponding motorcycle trips. For this reason, motorcycles were excluded from further analysis.
Further, because the GES and NPTS datasets are constructed from sample data, there is uncertainty about how closely the given values match the actual, but unknown, values. Uncertainties of the underlying GES and NPTS values are determined by the data-collecting agencies on the basis of the sampling techniques used. On the other hand, because FARS data are not a sample but a complete count of fatalities, there is no uncertainty in these values. Year-to-year variability was not modeled. Moreover, because the risk measures are hazard rates (ratios of GES and NPTS data and ratios of FARS and NPTS data), there is uncertainty in these estimates as well. The uncertainties in the ratios were calculated using standard simulation methods,2 through which estimates of the average were derived by means of statistical sampling. Throughout this report, 90 percent confidence intervals are used to display the uncertainty of the risk estimates.
DATA CATEGORIES
In addition to the date and time definitions noted earlier that were used to capture events during normal school travel hours, data from the GES and FARS databases were sorted into 15 school travel categories. These categories, listed in Table 3-1, capture not only the travel mode involved in an accident, but also information about the driver’s age. Because the data for fatalities and injuries were obtained from the FARS and GES datasets, they include only accidents involving motor vehicles. This means that injuries and fatalities sustained in walking and bicycling accidents not involving motor vehicles (e.g., solo bicycle or pedestrian accidents, bicycle–pedestrian accidents, bicycle–bicycle accidents)
TABLE 3-1 Student Fatalities and Injuries by Travel Category Over a 9-Year Period (1991–1999) from the FARS and GES Databases
|
Category |
Description |
Fatalities |
Injuries |
||||||
|
A |
B |
C |
Total |
||||||
|
1 |
Child school bus passenger in a school bus–related crash |
41 |
7,635 |
10,745 |
31,986 |
50,366 |
|||
|
2 |
Child pedestrian in a school bus–related crash |
136 |
1,248 |
1,459 |
1,156 |
3,863 |
|||
|
3 |
Child passenger in passenger vehicles driven by an adult |
1,517 |
43,322 |
118,671 |
297,176 |
459,168 |
|||
|
4 |
Teen driver, passenger vehicles |
2,545 |
57,055 |
144,371 |
264,139 |
465,564 |
|||
|
5 |
Child passenger in passenger vehicles driven by a teen |
1,483 |
29,543 |
73,402 |
135,373 |
238,318 |
|||
|
6 |
Child pedestrian (not in a motor vehicle crash) |
– |
– |
– |
– |
– |
|||
|
7 |
Child pedestrian, not school bus–related |
1,177 |
17,428 |
34,921 |
26,791 |
79,140 |
|||
|
8 |
Child bicyclist (not in a motor vehicle crash) |
– |
– |
– |
– |
– |
|||
|
9 |
Child bicyclist in a school bus–related crash |
12 |
146 |
486 |
47 |
679 |
|||
|
10 |
Child bicyclist not in a school bus–related crash |
402 |
9,820 |
39,026 |
20,127 |
68,974 |
|||
|
11 |
Teen driver, other buses |
– |
– |
– |
122 |
122 |
|||
|
12 |
Child passenger in other buses |
5 |
412 |
1,407 |
3,096 |
4,915 |
|||
|
13 |
Child passenger on motorcycle operated by an adult |
7 |
80 |
502 |
– |
582 |
|||
|
14 |
Teen driver (operator), motorcycle |
135 |
2,722 |
3,569 |
761 |
7,052 |
|||
|
15 |
Child passenger on motorcycle operated by a child |
10 |
– |
– |
– |
– |
|||
|
Total |
7,470 |
169,411 |
428,559 |
780,773 |
1,378,743 |
||||
|
Note: Data shown are for normal school travel hours as defined in Chapter 1. |
|||||||||
are not included; thus, categories 6 and 8 in Table 3-1 have no entries. Accurate counts of injuries/fatalities from these non–motor vehicle accidents were not available from other sources at the level of specificity needed for this study. Exclusion of these values results in underestimation of the risk for these two modes.
To determine the hazard rates for the different modes, the 15 categories shown in Table 3-1 were consolidated into 6, representing broad modes of travel. For example, categories 1 and 2 were combined to form a “school bus” category. The committee posited that pedestrians hurt or killed in school bus–related accidents were most likely using the school bus to get to and from school; that is, if they had not been using the school bus, they would not have been hurt. Similarly, categories 9 and 10 were combined into a “bicycling” category. In contrast with the pedestrian case, however, the committee reasoned that bicyclists injured or killed by school buses were not using the bus to get to and from school; that is, their primary mode was bicycling. Combining the categories in this manner means the school bus category will include “pedestrian” injuries and fatalities not included in the other categories, although conceivably pedestrian deaths are “directly” associated with every category except walking. For example, a student running to get into a friend’s car could be injured or killed by a passing car; a student getting off a transit bus could walk in front of the bus and be run over; or a student who rode her bicycle to school could be injured while walking from the bicycle rack by a parent pulling away from the curb. Because neither the FARS nor GES databases contain this type of information, none of these incidents can be associated with their respective modes.3 Nevertheless, the committee believed it appropriate to include school bus–related pedestrian injuries and fatalities under the school bus category for this study. The significant findings of this report are not affected by this limited consolidation.
Separate categories were maintained for two passenger vehicle driver age groups [adult (age 19 and older) and teen (younger than age 19)] when the number of fatalities and injuries permitted doing so. For example, the two driver-age categories were used for passenger vehicles, but only one category was used for fatalities and injuries involving other buses. Table 3-2 shows the final 6 categories and indicates how they map to the original 15 categories.
DATA ADJUSTMENTS
Each of the three primary datasets (GES, FARS, and NPTS) required adjustments to the raw data so the values could be integrated and the relevant hazard rates computed.
Age Cohort Calculation
Because multiyear age groupings had been created for all three datasets, the values for each age group had to be divided by the number of years in that group
TABLE 3-2 Creation of New Categories from Multiple Original Categories
|
New Category |
Original Categories |
|
School bus |
1, 2 |
|
Passenger vehicle (adult driver) |
3 |
|
Passenger vehicle (teen driver) |
4, 5 |
|
Walking |
6, 7 |
|
Bicycling |
8, 9, 10 |
|
Other bus |
11, 12 |
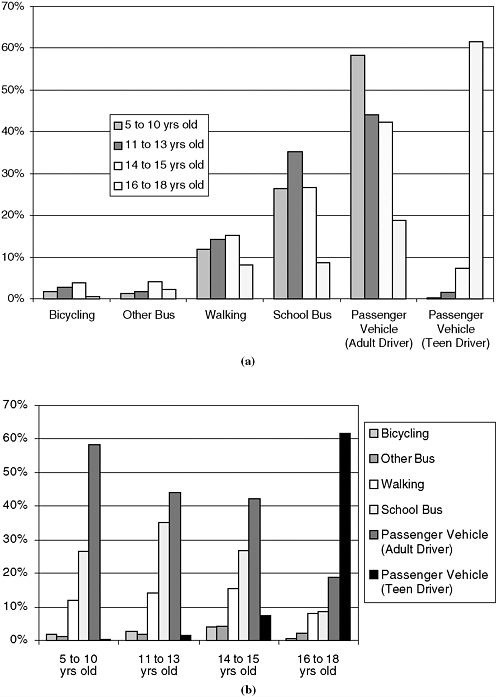
to calculate the expected number of fatalities (or injuries, trips, or miles traveled) per single-age cohort. The four age groupings were selected to reflect the three types of schools that children generally attend (those 5–10 years old attend elementary schools, those 11–13 attend middle/junior high schools, and those 14–15 and 16–18 attend high schools) and to differentiate between driving-age and non-driving-age high school students (separating those aged 14–15 from those 16–18). The committee assumed that members of each age group would have relatively homogeneous risk profiles (i.e., similar exposure and outcome measures). For example, among children attending elementary school, the average number and length of school bus trips per year for 5-year-olds would be similar to those of 6-, 7-, 8-, 9-, and 10-year-olds. Though the risks vary within each age group, the committee believes travel patterns (and risks) are strongly tied to the type of school attended (e.g., travel distances to elementary schools are generally shorter).
Figure 3-1 shows how the use of the various school travel modes differs by age group. Among those aged 11–13, 35 percent take a school bus, but among those aged 16–18, only 8 percent do so. Parents driving children to school declines steadily across the age groups. And teen drivers account for more than 60 percent of the trips for the oldest age group.
Multiyear Summation Adjustment
Because of the relative rarity of events for some of the modes examined and the need to smooth out the effects of some anomalies, the committee used 9 years of data to compute the fatality and injury counts from the FARS and GES datasets. To determine the average number of injuries and fatalities per year, the total values were divided by 9. As noted, the committee did not collect or analyze year-to-year variations for these two datasets; it was assumed that the averages captured the best estimates of the underlying values.
Adjustment for Missing or Unknown Data
All three datasets report missing or incomplete data using “other” and “unknown” categories. The “other” category represents only a very small percentage of the data (less than 0.05 percent) and was not included in this analysis. The
“unknown” category is far more significant. Unknown values were found for two critical portions of the NPTS data: mode of travel and age of driver. To adjust for these missing values, which could account for more than 10 percent of the total counts in some cases, counts in the “unknown” category were distributed across the other categories in proportion to the recorded values.
RISK MEASURES
Table 3-3 shows a summary of the data from the three national databases (i.e., FARS, GES, and NPTS) and the risk measures for the six school travel modes [i.e., school bus, other bus, passenger vehicles (two categories based on age of driver), bicycling, and walking]. The GES and FARS data are the averages for the years 1991–1999, and the NPTS data are for 1995.
The six modes vary considerably in both number of trips and number of miles per year. Passenger vehicles with adult drivers (19 years of age and older) make up 45 percent of the trips and 51 percent of the miles logged by students during normal school travel hours. Next are school buses with approximately 25 percent of trips and miles, and then passenger vehicles with teen drivers (younger than 19 years of age), which account for approximately 15 percent of the trips and miles. Walking makes up 12 percent of the trips but only 1 percent of the miles traveled (i.e., students who walk do not walk very far). Other buses and bicycling each make up about 2 percent of the trips, but bicycling represents relatively fewer miles because of the shorter distances traveled per trip. These data form the denominator values (i.e., exposure measure) in the hazard rate calculations. It should be remembered that these values are estimates based on a sample and are therefore uncertain. The impact of this uncertainty is discussed later.
The distributions of injuries and fatalities (outcome measures) across travel modes are very different. School buses, which make up 25 percent of the exposure measures, account for less than 4 percent of the injuries and 2 percent of the fatalities. Likewise, passenger vehicles with teen drivers account for more than half of the injuries and fatalities, a much greater percentage than the 15 percent suggested by the exposure measures. This divergence can best be seen in the percentage comparisons shown in Figure 3-2.4 Three modes (school buses, other buses, and passenger vehicles with adult drivers) have injury and fatality counts below those expected from their exposure values (percentages for their outcome measures are lower than percentages for their exposure measures). Likewise, three modes (bicycling, walking, and passenger vehicles with teen drivers) have injury and fatality counts much higher than those expected from their exposure values (percentages for their outcome measures are greater percentages for their exposure measures). These relationships lead to the different hazard rates shown in Table 3-3.
When hazard rates are based on trip counts, passenger vehicles with teen drivers have the highest risk; when the rates are based on miles driven, however, bicycling and walking have the highest values. The difference is due to the
TABLE 3-3 Summary of Student Injury and Fatality Data per Year
|
|
100 Million Trips (%) |
100 Million Miles (%) |
Injuries |
Fatalities |
|||||
|
Count (%) |
Per 100 Million Trips |
Per 100 Million Miles |
Count (%) |
Per 100 Million Trips |
Per 100 Million Miles |
||||
|
School bus |
58 (25) |
313 (28) |
6,000 (4) |
100 |
20 |
20 (2) |
0.3 |
0.1 |
|
|
Other bus |
5 (2) |
38 (3) |
550 (<1) |
120 |
20 |
1 (<1) |
0.1 |
<.1 |
|
|
Passenger vehicle (teen driver) |
34 (14) |
184 (16) |
78,200 (51) |
2,300 |
430 |
448 (54) |
13.2 |
2.4 |
|
|
Passenger vehicle (adult driver) |
105 (45) |
580 (51) |
51,000 (33) |
490 |
90 |
169 (20) |
1.6 |
0.3 |
|
|
Bicycling |
5 (2) |
4 (<1) |
7,700 (5) |
1,610 |
2,050 |
46 (6) |
9.6 |
12.2 |
|
|
Walking |
28 (12) |
15 (1) |
8,800 (6) |
310 |
590 |
131 (16) |
4.6 |
8.7 |
|
|
Total |
235 |
1,134 |
152,250 |
650 |
130 |
815 |
3.5 |
0.7 |
|
|
Note: Data shown are for normal school travel hours as defined in Chapter 1. Injury and fatality counts are averages based on 9 years of data (1991–1999). |
|||||||||

FIGURE 3-2 Comparisons of percent miles, percent injuries, and percent student fatalities by travel mode.
distances traveled for each of these modes. This observation is borne out if the data in Table 3-3 are used to calculate the average distance per trip (simply dividing the total number of miles by the number of trips for each mode). The distance per trip is approximately 5.5 miles for the school bus and two passenger vehicle categories, 0.75 mile for bicycling, and 0.50 mile for walking. On the basis of the NPTS data, the average trip length for other buses is around 8 miles. To put these values in perspective, Figure 3-3 shows a comparison of miles per trip for the four age groups for normal school travel hours and all other times of the year. Trip distances during normal school travel hours are shorter (averaging 5 miles as compared with 8 miles). Also, length of trip increases with age of student (from an average of 4.5 miles for the youngest students to 5.5 for the oldest students).
UNCERTAINTY
As noted earlier in this chapter, because the GES and NPTS datasets are based on samples from a much larger population than school-age children, hazard rates developed from these datasets are uncertain. It is important to appreciate the extent of these uncertainties when formulating new policies. Just because a particular mode has a lower average hazard rate than another does not mean that the difference is significant or interesting. The uncertainties in the estimates could cloud the interpretation of the data and make it impossible to draw definitive conclusions.
Figures 3-4 through 3-7 show the uncertainty behind the risk estimates shown in Table 3-3. The horizontal bar represents the average hazard rate for
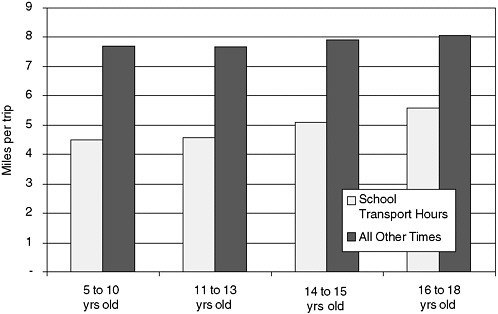
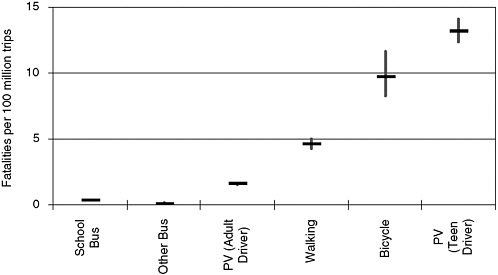
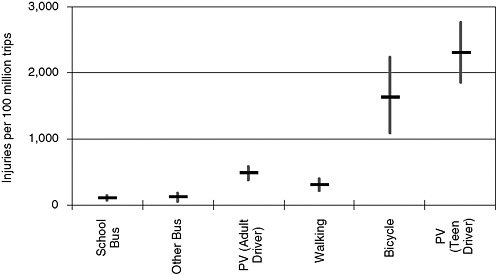
FIGURE 3-5 Student injury rates per 100 million trips by mode during normal travel hours with 90 percent confidence intervals (PV = passenger vehicle).
each mode. The vertical bars represent a 90 percent confidence interval for each estimate (that is, there is a high likelihood that the actual fatality or injury rate falls within this interval). For some modes, the interval is very tight and really cannot be seen on the graphs (for example, school buses or other buses in Figure 3-6). In some cases, the confidence intervals for the modes overlap. This implies that it is not possible to determine whether the risks associated with the
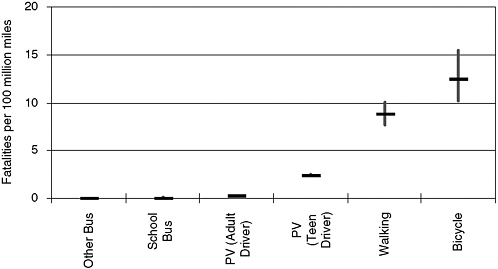
FIGURE 3-6 Student fatality rates per 100 million student-miles by mode during normal travel hours with 90 percent confidence intervals (PV = passenger vehicle).
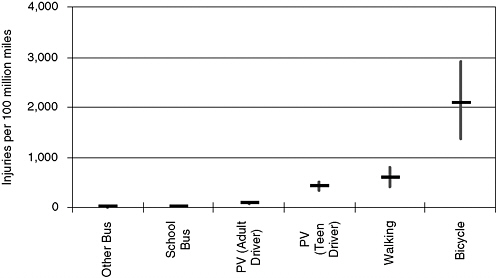
FIGURE 3-7 Student injury rates per 100 million student-miles by mode during normal travel hours with 90 percent confidence intervals (PV = passenger vehicle).
modes (for example, bicycling and student drivers in Figure 3-5) are actually different. School buses and other buses have the lowest injury and fatality rates and are statistically indistinguishable from each other.
Tables 3-4 though 3-9 show how the uncertainties in the exposure and outcome measures combine to create uncertainty in the hazard rates sorted by age group and travel mode. All of these tables present the average and the lower (5 percent) and upper (95 percent) confidence bounds for various risk measures. Tables 3-4 and 3-5 show the injury and fatality rates per 100 million student-miles, whereas Tables 3-6 and 3-7 show the rates per 100 million student trips. A graphical depiction of these results appears in Figures 3-8 through 3-11. The uncertainty results are repeated in table and figure form for both risk measures (per 100 million trips and per 100 million student-miles) for the data sorted by gender, time of day, and location categories (see Tables 3-8 through 3-17 and Figures 3-12 through 3-23). Note that injury rates are not broken out by location (urban and rural) because the GES dataset is not coded in this manner.
Generally, categories with high hazard rates have wider confidence ranges. The coefficients of variation (the standard error divided by the average) for the travel mode and age groupings are shown for fatalities/100 million trips and injuries/100 million student-miles in Figures 3-22 and 3-23, respectively. These values are calculated from the same values shown in Figures 3-5 and 3-6 and Tables 3-4 and 3-7. The coefficients of variation for the injury rates are relatively consistent (between 20 and 30 percent) across the different age and travel mode combinations with the exception of that for the other bus category, which is higher than the others. For the fatality rates, the coefficients indicate where the underlying trip data are scarce. For most travel mode categories, there is a “stair step” across the age groupings: higher coefficients of variation indicate smaller
TABLE 3-4 Injuries per 100 Million Student-Miles: Confidence Bounds on Average Estimates by Age Group and Transportation Mode
|
Age Group and Transportation Mode |
5th |
Mean |
95th |
|
|
Ages 5–10 |
|
|
|
|
|
|
School bus |
5 |
13 |
21 |
|
|
Other bus |
0 |
12 |
24 |
|
|
Passenger vehicle (adult driver) |
50 |
77 |
104 |
|
|
Walking |
324 |
726 |
1,182 |
|
|
Bicycling |
886 |
2,625 |
5,310 |
|
|
Passenger vehicle (teen driver) |
787 |
2,549 |
4,618 |
|
Ages 11–13 |
|
|
|
|
|
|
School bus |
9 |
20 |
30 |
|
|
Other bus |
7 |
38 |
69 |
|
|
Passenger vehicle (adult driver) |
48 |
76 |
104 |
|
|
Walking |
370 |
759 |
1,198 |
|
|
Bicycling |
1,096 |
2,267 |
3,624 |
|
|
Passenger vehicle (teen driver) |
347 |
716 |
1,092 |
|
Ages 14–15 |
|
|
|
|
|
|
School bus |
10 |
22 |
34 |
|
|
Other bus |
0 |
6 |
11 |
|
|
Passenger vehicle (adult driver) |
60 |
94 |
128 |
|
|
Walking |
177 |
385 |
622 |
|
|
Bicycling |
651 |
1,458 |
2,497 |
|
|
Passenger vehicle (teen driver) |
396 |
596 |
795 |
|
Ages 16–18 |
|
|
|
|
|
|
School bus |
16 |
37 |
59 |
|
|
Other bus |
0 |
13 |
26 |
|
|
Passenger vehicle (adult driver) |
97 |
152 |
206 |
|
|
Walking |
164 |
426 |
729 |
|
|
Bicycling |
1,103 |
3,158 |
6,120 |
|
|
Passenger vehicle (teen driver) |
300 |
396 |
493 |
|
Note: Data shown are for normal school travel hours as defined in Chapter 1. |
||||
underlying samples in the NPTS survey. For example, few of those aged 16–18 take a school bus, walk, or ride bicycles, but many more drive themselves to school. Similar patterns are found for the other categories (i.e., gender, time of day, and geographic region).
Because of the uncertainty of the estimates, not all differences in average hazard rates are significant. Table 3-18 shows which differences from Tables 3-4
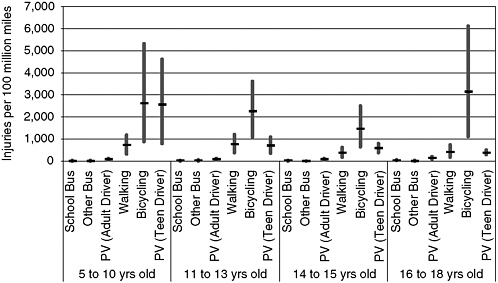
FIGURE 3-8 Injuries per 100 million student-miles shown by age group and travel mode (PV = passenger vehicle). (Horizontal bars are the average, and vertical bars represent 90 percent confidence intervals of the average values.)
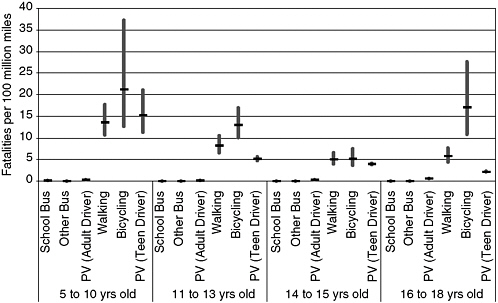
FIGURE 3-9 Fatalities per 100 million student-miles shown by age group and travel mode (PV = passenger vehicle). (Horizontal bars are the average, and vertical bars represent 90 percent confidence intervals of the average values.)
TABLE 3-5 Fatalities per 100 Million Student-Miles: Confidence Bounds on Average Estimates by Age Group and Transportation Mode
|
Age Group and Transportation Mode |
5th |
Mean |
95th |
|
|
Ages 5–10 |
|
|
|
|
|
|
School bus |
0.10 |
0.10 |
0.10 |
|
|
Other bus |
0.01 |
0.01 |
0.01 |
|
|
Passenger vehicle (adult driver) |
0.27 |
0.27 |
0.27 |
|
|
Walking |
10.66 |
13.61 |
17.64 |
|
|
Bicycling |
12.63 |
21.16 |
37.33 |
|
|
Passenger vehicle (teen driver) |
11.26 |
15.22 |
20.99 |
|
Ages 11–13 |
|
|
|
|
|
|
School bus |
0.04 |
0.04 |
0.04 |
|
|
Other bus |
0.03 |
0.03 |
0.03 |
|
|
Passenger vehicle (adult driver) |
0.21 |
0.21 |
0.22 |
|
|
Walking |
6.60 |
8.30 |
10.58 |
|
|
Bicycling |
10.03 |
12.95 |
16.97 |
|
|
Passenger vehicle (teen driver) |
4.75 |
5.20 |
5.71 |
|
Ages 14–15 |
|
|
|
|
|
|
School bus |
0.04 |
0.04 |
0.04 |
|
|
Other bus |
0.01 |
0.01 |
0.01 |
|
|
Passenger vehicle (adult driver) |
0.23 |
0.24 |
0.24 |
|
|
Walking |
3.95 |
5.03 |
6.50 |
|
|
Bicycling |
3.65 |
5.15 |
7.47 |
|
|
Passenger vehicle (teen driver) |
3.85 |
3.97 |
4.10 |
|
Ages 16–18 |
|
|
|
|
|
|
School bus |
0.02 |
0.02 |
0.02 |
|
|
Other bus |
0.02 |
0.02 |
0.02 |
|
|
Passenger vehicle (adult driver) |
0.58 |
0.59 |
0.59 |
|
|
Walking |
4.49 |
5.80 |
7.63 |
|
|
Bicycling |
10.78 |
17.03 |
27.64 |
|
|
Passenger vehicle (teen driver) |
2.16 |
2.19 |
2.22 |
|
Note: Data shown are for normal school travel hours as defined in Chapter 1. |
||||
through 3-7 (and Figures 3-8 through 3-11) are not significantly different with 95 percent confidence. Taking, for example, the values in Table 3-4 (injuries/100 million student-miles) for children aged 5–10 using school buses or other buses, the 90 percent confidence range for school bus (5–21 injuries/100 million student-miles) overlaps with the 90 percent confidence range for other bus (0–24 injuries/
TABLE 3-6 Injuries per 100 Million Student Trips: Confidence Bounds on Average Estimates by Age Group and Transportation Mode
|
Age Group and Transportation Mode |
5th |
Mean |
95th |
|
|
Ages 5–10 |
|
|
|
|
|
|
School bus |
24 |
65 |
106 |
|
|
Other bus |
0 |
119 |
255 |
|
|
Passenger vehicle (adult driver) |
257 |
400 |
543 |
|
|
Walking |
143 |
304 |
468 |
|
|
Bicycling |
521 |
1,311 |
2,248 |
|
|
Passenger vehicle (teen driver) |
1,224 |
4,586 |
10,044 |
|
Ages 11–13 |
|
|
|
|
|
|
School bus |
48 |
103 |
158 |
|
|
Other bus |
49 |
276 |
527 |
|
|
Passenger vehicle (adult driver) |
262 |
419 |
581 |
|
|
Walking |
187 |
368 |
555 |
|
|
Bicycling |
1,014 |
2,057 |
3,281 |
|
|
Passenger vehicle (teen driver) |
1,240 |
2,779 |
4,696 |
|
Ages 14–15 |
|
|
|
|
|
|
School bus |
63 |
138 |
214 |
|
|
Other bus |
1 |
56 |
115 |
|
|
Passenger vehicle (adult driver) |
335 |
526 |
723 |
|
|
Walking |
130 |
277 |
435 |
|
|
Bicycling |
596 |
1,299 |
2,186 |
|
|
Passenger vehicle (teen driver) |
2,651 |
4,252 |
6,124 |
|
Ages 16–18 |
|
|
|
|
|
|
School bus |
125 |
295 |
470 |
|
|
Other bus |
0 |
68 |
143 |
|
|
Passenger vehicle (adult driver) |
718 |
1,147 |
1,588 |
|
|
Walking |
108 |
274 |
451 |
|
|
Bicycling |
1,328 |
4,623 |
9,525 |
|
|
Passenger vehicle (teen driver) |
1,599 |
2,131 |
2,678 |
|
Note: Data shown are for normal school travel hours as defined in Chapter 1. |
||||
100 million student-miles). Therefore, even though the average hazard rate for the other bus mode is smaller (12 versus 13), this difference is not statistically significant, and one cannot say that this mode has less risk. For the different hazard rate measures and many of the younger age groupings, the school bus and other bus modes are not significantly different.
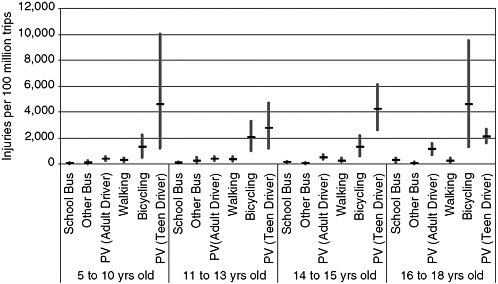
FIGURE 3-10 Injuries per 100 million student trips shown by age group and travel mode (PV = passenger vehicle). (Horizontal bars are the average, and vertical bars represent 90 percent confidence intervals of the average values.)
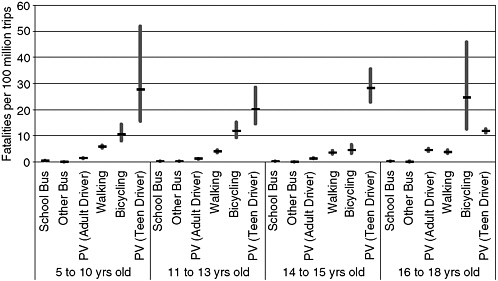
FIGURE 3-11 Fatalities per 100 million student trips shown by age group and travel mode (PV = passenger vehicle). (Horizontal bars are the average, and vertical bars represent 90 percent confidence intervals of the average values.)
TABLE 3-7 Fatalities per 100 Million Student Trips: Confidence Bounds on Average Estimates by Age Group and Transportation Mode
|
Age Group and Transportation Mode |
5th |
Mean |
95th |
|
|
Ages 5–10 |
|
|
|
|
|
|
School bus |
0.47 |
0.50 |
0.53 |
|
|
Other bus |
0.07 |
0.09 |
0.12 |
|
|
Passenger vehicle (adult driver) |
1.32 |
1.39 |
1.48 |
|
|
Walking |
5.18 |
5.70 |
6.30 |
|
|
Bicycling |
8.04 |
10.62 |
14.30 |
|
|
Passenger vehicle (teen driver) |
15.61 |
27.61 |
51.93 |
|
Ages 11–13 |
|
|
|
|
|
|
School bus |
0.18 |
0.19 |
0.21 |
|
|
Other bus |
0.18 |
0.24 |
0.31 |
|
|
Passenger vehicle (adult driver) |
1.09 |
1.17 |
1.27 |
|
|
Walking |
3.60 |
4.02 |
4.51 |
|
|
Bicycling |
9.21 |
11.74 |
15.20 |
|
|
Passenger vehicle (teen driver) |
14.57 |
20.17 |
28.60 |
|
Ages 14–15 |
|
|
|
|
|
|
School bus |
0.22 |
0.25 |
0.27 |
|
|
Other bus |
0.07 |
0.08 |
0.11 |
|
|
Passenger vehicle (adult driver) |
1.20 |
1.32 |
1.44 |
|
|
Walking |
3.01 |
3.61 |
4.36 |
|
|
Bicycling |
3.32 |
4.59 |
6.51 |
|
|
Passenger vehicle (teen driver) |
22.83 |
28.32 |
35.56 |
|
Ages 16–18 |
|
|
|
|
|
|
School bus |
0.16 |
0.18 |
0.21 |
|
|
Other bus |
0.08 |
0.10 |
0.13 |
|
|
Passenger vehicle (adult driver) |
3.96 |
4.43 |
4.98 |
|
|
Walking |
3.15 |
3.73 |
4.45 |
|
|
Bicycling |
12.58 |
24.79 |
45.82 |
|
|
Passenger vehicle (teen driver) |
10.97 |
11.76 |
12.63 |
|
Note: Data shown are for normal school travel hours as defined in Chapter 1. |
||||
INTERPRETATION OF DATA
The above data show some clear trends for the nation. Travel by bus (whether school bus or other bus) appears safer than the other modes. Drivers aged 19 and older apparently provide safer transportation than teen drivers. On a per-mile basis, walking and bicycling to and from school appear riskier than most
TABLE 3-8 Injuries per 100 Million Student Trips: Confidence Bounds on Average Estimates by Gender and Transportation Mode
|
Gender and Transportation Mode |
5th |
Mean |
95th |
|
|
Male |
|
|
|
|
|
|
School bus |
65 |
104 |
142 |
|
|
Other bus |
54 |
148 |
247 |
|
|
Passenger vehicle (adult driver) |
305 |
405 |
504 |
|
|
Walking |
212 |
321 |
435 |
|
|
Bicycling |
1,199 |
1,839 |
2,551 |
|
|
Passenger vehicle (teen driver) |
1,495 |
1,922 |
2,353 |
|
Female |
|
|
|
|
|
|
School bus |
66 |
106 |
149 |
|
|
Other bus |
35 |
103 |
187 |
|
|
Passenger vehicle (adult driver) |
436 |
566 |
703 |
|
|
Walking |
186 |
302 |
434 |
|
|
Bicycling |
541 |
1,414 |
2,625 |
|
|
Passenger vehicle (teen driver) |
2,079 |
2,696 |
3,375 |
|
Note: Data shown are for normal school travel hours as defined in Chapter 1. |
||||
TABLE 3-9 Injuries per 100 Million Student Trips: Confidence Bounds on Average Estimates by Time of Day and Transportation Mode
|
Time of Day and Transportation Mode |
5th |
Mean |
95th |
|
|
6–8:59 a.m. |
|
|
|
|
|
|
School bus |
70 |
111 |
153 |
|
|
Other bus |
23 |
79 |
139 |
|
|
Passenger vehicle (adult driver) |
267 |
363 |
460 |
|
|
Walking |
176 |
288 |
404 |
|
|
Bicycling |
928 |
1,872 |
3,110 |
|
|
Passenger vehicle (teen driver) |
1,330 |
1,775 |
2,231 |
|
2–4:59 p.m. |
|
|
|
|
|
|
School bus |
60 |
98 |
135 |
|
|
Other bus |
63 |
154 |
252 |
|
|
Passenger vehicle (adult driver) |
445 |
572 |
701 |
|
|
Walking |
216 |
322 |
431 |
|
|
Bicycling |
1,050 |
1,613 |
2,273 |
|
|
Passenger vehicle (teen driver) |
2,077 |
2,635 |
3,225 |
|
Note: Data shown are for normal school travel hours as defined in Chapter 1. |
||||
TABLE 3-10 Fatalities per 100 Million Student Trips: Confidence Bounds on Average Estimates by Gender and Transportation Mode
|
Gender and Transportation Mode |
5th |
Mean |
95th |
|
|
Male |
|
|
|
|
|
|
School bus |
0.35 |
0.37 |
0.39 |
|
|
Other bus |
0.20 |
0.23 |
0.28 |
|
|
Passenger vehicle (adult driver) |
1.56 |
1.61 |
1.67 |
|
|
Walking |
4.82 |
5.24 |
5.70 |
|
|
Bicycling |
9.51 |
11.44 |
13.88 |
|
|
Passenger vehicle (teen driver) |
13.71 |
14.44 |
15.21 |
|
Female |
|
|
|
|
|
|
School bus |
0.28 |
0.32 |
0.36 |
|
|
Other bus |
0.03 |
0.04 |
0.06 |
|
|
Passenger vehicle (adult driver) |
1.49 |
1.60 |
1.71 |
|
|
Walking |
3.23 |
3.94 |
4.85 |
|
|
Bicycling |
3.44 |
6.64 |
11.74 |
|
|
Passenger vehicle (teen driver) |
10.20 |
11.48 |
12.98 |
|
Note: Data shown are for normal school travel hours as defined in Chapter 1. |
||||
TABLE 3-11 Fatalities per 100 Million Student Trips: Confidence Bounds on Average Estimates by Time of Day and Transportation Mode
|
Time of Day and Transportation Mode |
5th |
Mean |
95th |
|
|
6–8:59 a.m. |
|
|
|
|
|
|
School bus |
0.21 |
0.22 |
0.23 |
|
|
Other bus |
0.09 |
0.11 |
0.13 |
|
|
Passenger vehicle (adult driver) |
1.47 |
1.55 |
1.63 |
|
|
Walking |
4.46 |
4.98 |
5.58 |
|
|
Bicycling |
6.94 |
9.77 |
14.12 |
|
|
Passenger vehicle (teen driver) |
11.92 |
13.02 |
14.24 |
|
2–4:59 p.m. |
|
|
|
|
|
|
School bus |
0.44 |
0.46 |
0.50 |
|
|
Other bus |
0.11 |
0.13 |
0.16 |
|
|
Passenger vehicle (adult driver) |
1.55 |
1.65 |
1.75 |
|
|
Walking |
4.05 |
4.44 |
4.87 |
|
|
Bicycling |
8.13 |
9.84 |
12.03 |
|
|
Passenger vehicle (teen driver) |
12.14 |
13.30 |
14.60 |
|
Note: Data shown are for normal school travel hours as defined in Chapter 1. |
||||
TABLE 3-12 Fatalities per 100 Million Student Trips: Confidence Bounds on Average Estimates by Geographic Region and Transportation Mode
|
Geographic Region and Transportation Mode |
5th |
Mean |
95th |
|
|
Urban |
|
|
|
|
|
|
School bus |
0.34 |
0.36 |
0.39 |
|
|
Other bus |
0.03 |
0.03 |
0.03 |
|
|
Passenger vehicle (adult driver) |
0.73 |
0.77 |
0.81 |
|
|
Walking |
3.43 |
3.71 |
4.02 |
|
|
Bicycling |
7.56 |
9.14 |
11.14 |
|
|
Passenger vehicle (teen driver) |
5.79 |
6.35 |
6.98 |
|
Rural |
|
|
|
|
|
|
School bus |
0.30 |
0.32 |
0.34 |
|
|
Other bus |
0.42 |
0.56 |
0.77 |
|
|
Passenger vehicle (adult driver) |
2.86 |
3.05 |
3.25 |
|
|
Walking |
7.46 |
8.72 |
10.25 |
|
|
Bicycling |
8.05 |
11.12 |
15.73 |
|
|
Passenger vehicle (teen driver) |
19.61 |
21.50 |
23.64 |
|
Note: Data shown are for normal school travel hours as defined in Chapter 1. |
||||
TABLE 3-13 Injuries per 100 Million Student-Miles: Confidence Bounds on Average Estimates by Gender and Transportation Mode
|
Gender and Transportation Mode |
5th |
Mean |
95th |
|
|
Male |
|
|
|
|
|
|
School bus |
12 |
19 |
27 |
|
|
Other bus |
11 |
28 |
46 |
|
|
Passenger vehicle (adult driver) |
57 |
75 |
94 |
|
|
Walking |
429 |
661 |
910 |
|
|
Bicycling |
1,632 |
2,594 |
3,727 |
|
|
Passenger vehicle (teen driver) |
262 |
335 |
408 |
|
Female |
|
|
|
|
|
|
School bus |
12 |
19 |
26 |
|
|
Other bus |
3 |
9 |
15 |
|
|
Passenger vehicle (adult driver) |
77 |
99 |
122 |
|
|
Walking |
305 |
542 |
848 |
|
|
Bicycling |
552 |
1,312 |
2,658 |
|
|
Passenger vehicle (teen driver) |
437 |
553 |
671 |
|
Note: Data shown are for normal school travel hours as defined in Chapter 1. |
||||
TABLE 3-14 Injuries per 100 Million Student-Miles: Confidence Bounds on Average Estimates by Time of Day and Transportation Mode
|
Time of Day and Transportation Mode |
5th |
Mean |
95th |
|
|
6–8:59 a.m. |
|
|
|
|
|
|
School bus |
13 |
20 |
28 |
|
|
Other bus |
2 |
8 |
13 |
|
|
Passenger vehicle (adult driver) |
63 |
86 |
108 |
|
|
Walking |
340 |
582 |
852 |
|
|
Bicycling |
903 |
1,786 |
2,900 |
|
|
Passenger vehicle (teen driver) |
251 |
330 |
409 |
|
2–4:59 p.m. |
|
|
|
|
|
|
School bus |
11 |
18 |
25 |
|
|
Other bus |
9 |
23 |
36 |
|
|
Passenger vehicle (adult driver) |
70 |
89 |
108 |
|
|
Walking |
394 |
600 |
827 |
|
|
Bicycling |
1,391 |
2,209 |
3,186 |
|
|
Passenger vehicle (teen driver) |
389 |
485 |
581 |
|
Note: Data shown are for normal school travel hours as defined in Chapter 1. |
||||
TABLE 3-15 Fatalities per 100 Million Student-Miles: Confidence Bounds on Average Estimates by Gender and Transportation Mode
|
Gender and Transportation Mode |
5th |
Mean |
95th |
|
|
Male |
|
|
|
|
|
|
School bus |
0.07 |
0.07 |
0.07 |
|
|
Other bus |
0.04 |
0.04 |
0.05 |
|
|
Passenger vehicle (adult driver) |
0.30 |
0.30 |
0.30 |
|
|
Walking |
9.39 |
10.79 |
12.46 |
|
|
Bicycling |
12.74 |
16.13 |
20.71 |
|
|
Passenger vehicle (teen driver) |
2.49 |
2.52 |
2.54 |
|
Female |
|
|
|
|
|
|
School bus |
0.06 |
0.06 |
0.06 |
|
|
Other bus |
0.00 |
0.00 |
0.00 |
|
|
Passenger vehicle (adult driver) |
0.28 |
0.28 |
0.28 |
|
|
Walking |
5.04 |
7.06 |
10.14 |
|
|
Bicycling |
3.52 |
6.31 |
11.74 |
|
|
Passenger vehicle (teen driver) |
2.30 |
2.36 |
2.41 |
|
Note: Data shown are for normal school travel hours as defined in Chapter 1. |
||||
TABLE 3-16 Fatalities per 100 Million Student-Miles: Confidence Bounds on Average Estimates by Time of Day and Transportation Mode
|
Time of Day and Transportation Mode |
5th |
Mean |
95th |
|
|
6–8:59 a.m. |
|
|
|
|
|
|
School bus |
0.04 |
0.04 |
0.04 |
|
|
Other bus |
0.01 |
0.01 |
0.01 |
|
|
Passenger vehicle (adult driver) |
0.36 |
0.37 |
0.37 |
|
|
Walking |
8.14 |
10.06 |
12.56 |
|
|
Bicycling |
6.82 |
9.34 |
13.08 |
|
|
Passenger vehicle (teen driver) |
2.39 |
2.42 |
2.45 |
|
2–4:59 p.m. |
|
|
|
|
|
|
School bus |
0.09 |
0.09 |
0.09 |
|
|
Other bus |
0.02 |
0.02 |
0.02 |
|
|
Passenger vehicle (adult driver) |
0.25 |
0.26 |
0.26 |
|
|
Walking |
7.04 |
8.26 |
9.76 |
|
|
Bicycling |
10.51 |
13.48 |
17.54 |
|
|
Passenger vehicle (teen driver) |
2.41 |
2.45 |
2.49 |
|
Note: Data shown are for normal school travel hours as defined in Chapter 1. |
||||
TABLE 3-17 Fatalities per 100 Million Student-Miles: Confidence Bounds on Average Estimates by Geographic Region and Transportation Mode
|
|
Geographic Region and Transportation Mode |
5th |
Mean |
95th |
|
Urban |
|
|
|
|
|
|
School bus |
0.09 |
0.09 |
0.09 |
|
|
Other bus |
0.00 |
0.00 |
0.00 |
|
|
Passenger vehicle (adult driver) |
0.16 |
0.17 |
0.17 |
|
|
Walking |
6.19 |
7.15 |
8.32 |
|
|
Bicycling |
8.58 |
10.58 |
13.20 |
|
|
Passenger vehicle (teen driver) |
1.34 |
1.36 |
1.39 |
|
Rural |
|
|
|
|
|
|
School bus |
0.05 |
0.05 |
0.05 |
|
|
Other bus |
0.04 |
0.04 |
0.04 |
|
|
Passenger vehicle (adult driver) |
0.43 |
0.43 |
0.43 |
|
|
Walking |
12.26 |
16.09 |
21.50 |
|
|
Bicycling |
10.99 |
18.00 |
30.22 |
|
|
Passenger vehicle (teen driver) |
3.40 |
3.44 |
3.49 |
|
Note: Data shown are for normal school travel hours as defined in Chapter 1. |
||||
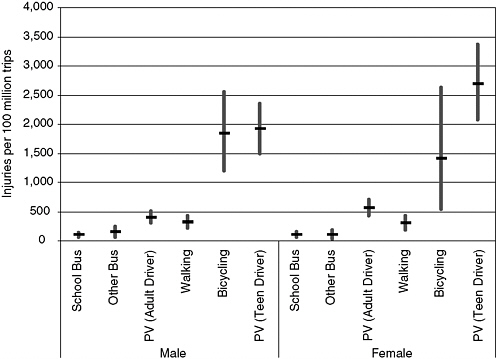
FIGURE 3-12 Injuries per 100 million student trips shown by gender and travel mode (PV = passenger vehicle). (Horizontal bars are the average, and vertical bars represent 90 percent confidence intervals of the average values.)
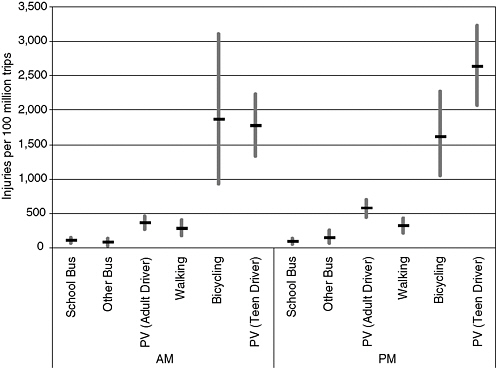
FIGURE 3-13 Injuries per 100 million student trips shown by time of day and travel mode (PV = passenger vehicle). (Horizontal bars are the average, and vertical bars represent 90 percent confidence intervals of the average values.)
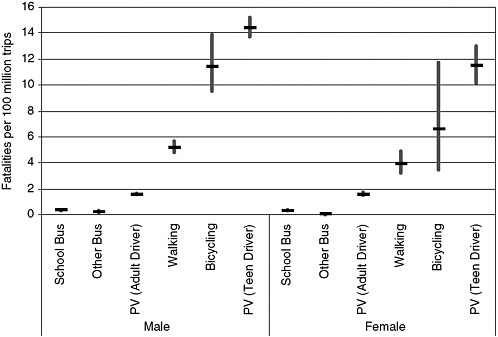
FIGURE 3-14 Fatalities per 100 million student trips shown by gender and travel mode (PV = passenger vehicle). (Horizontal bars are the average, and vertical bars represent 90 percent confidence intervals of the average values.)
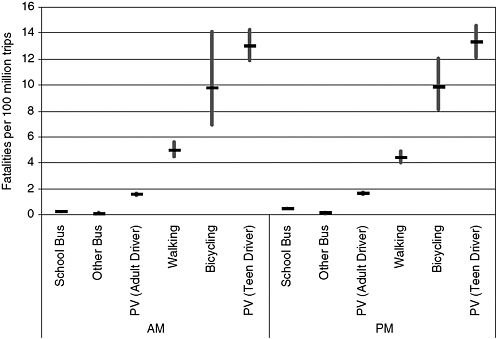
FIGURE 3-15 Fatalities per 100 million student trips shown by time of day and travel mode (PV = passenger vehicle). (Horizontal bars are the average, and vertical bars represent 90 percent confidence intervals of the average values.)
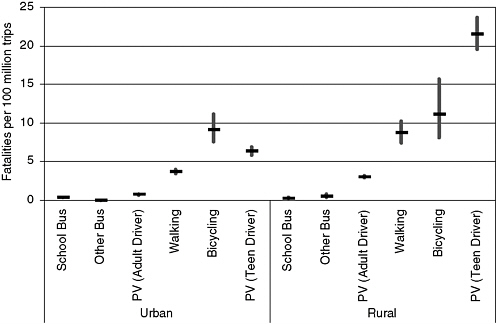
FIGURE 3-16 Fatalities per 100 million student trips shown by geographic region and travel mode (PV = passenger vehicle). (Horizontal bars are the average, and vertical bars represent 90 percent confidence intervals of the average values.)
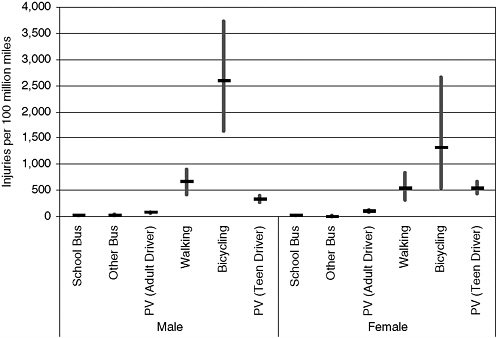
FIGURE 3-17 Injuries per 100 million student-miles shown by gender and travel mode (PV = passenger vehicle). (Horizontal bars are the average, and vertical bars represent 90 percent confidence intervals of the average values.)
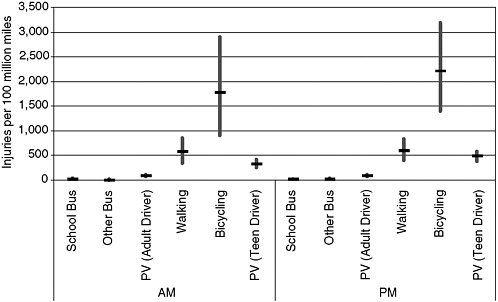
FIGURE 3-18 Injuries per 100 million student-miles shown by time of day and travel mode (PV = passenger vehicle). (Horizontal bars are the average, and vertical bars represent 90 percent confidence intervals of the average values.)
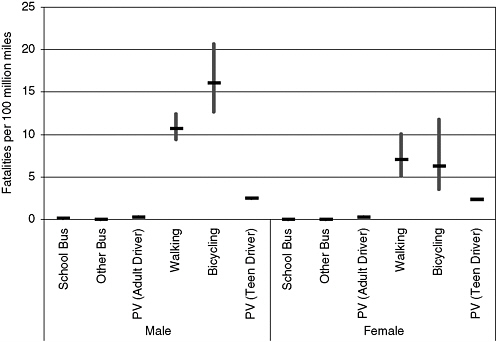
FIGURE 3-19 Fatalities per 100 million student-miles shown by gender and travel mode (PV = passenger vehicle). (Horizontal bars are the average, and vertical bars represent 90 percent confidence intervals of the average values.)
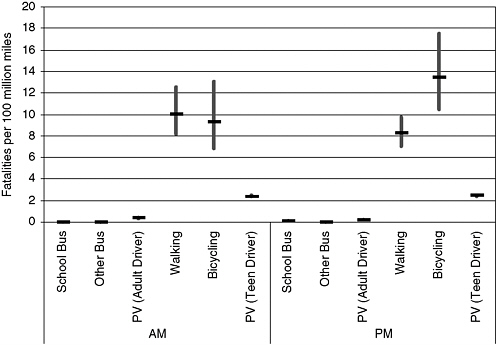
FIGURE 3-20 Fatalities per 100 million student-miles shown by time of day and travel mode (PV = passenger vehicle). (Horizontal bars are the average, and vertical bars represent 90 percent confidence intervals of the average values.)
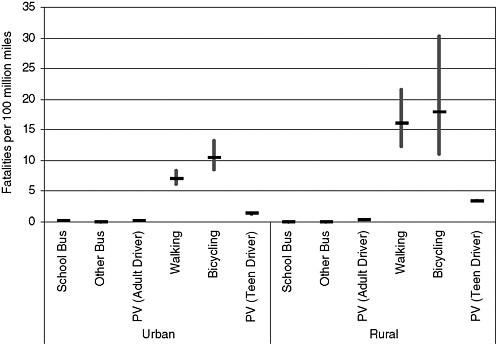
FIGURE 3-21 Fatalities per 100 million student-miles shown by geographic region and travel mode (PV = passenger vehicle). (Horizontal bars are the average, and vertical bars represent 90 percent confidence intervals of the average values.)
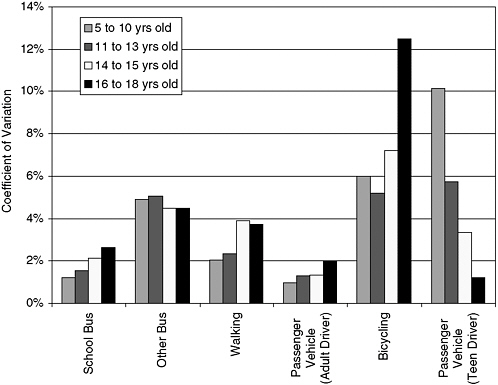
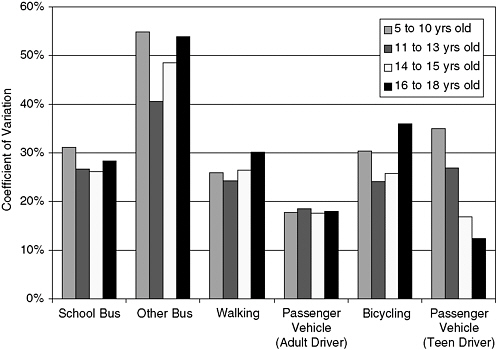
TABLE 3-18 Not Significant Differences in Average Hazard Rates by Travel Mode and Age Category (All Other Comparisons Are Significantly Different with 90 percent Confidence)
|
|
Age Group (years) |
|||
|
|
5–10 |
11–13 |
14–15 |
16–18 |
|
Figure 3-8, injuries per 100 million student-miles |
|
|
|
|
|
School bus and other busa |
NS |
NS |
|
|
|
Walking and passenger vehicle (adult driver) |
|
NS |
NS |
NS |
|
Bicycling and passenger vehicle (teen driver) |
NS |
|
|
|
|
Figure 3-9, fatalities per 100 million student-miles |
|
|
|
|
|
Walking and bicycling |
|
|
NS |
|
|
Walking and passenger vehicle (adult driver) |
NS |
|
|
|
|
Bicycling and passenger vehicle (teen driver) |
NS |
|
|
|
|
Figure 3-10, injuries per 100 million student trips |
|
|
|
|
|
School bus and other bus |
NS |
NS |
|
|
|
School bus and walking |
|
|
|
NS |
|
Other bus and walking |
|
|
|
|
|
Walking and passenger vehicle (adult driver) |
|
NS |
|
|
|
Bicycling and passenger vehicle (teen driver) |
NS |
NS |
|
|
|
Note: Data shown are for normal school travel hours as defined in Chapter 1. “NS” indicates not significantly different with 95 percent confidence. a As noted previously, the school bus category includes school-age children who are injured or killed as pedestrians (e.g., when boarding or alighting from the bus and crossing the street) as well as those who are passengers on the school bus. However, the other bus category only includes those school-age children who are passengers; the datasets do not capture injuries or fatalities for those students as pedestrians. |
||||
of the other modes, whereas these two modes appear less risky when viewed on a per-trip basis.
When comparing morning and afternoon trips, there is little difference in the risks for each travel mode. Though there are some significant gender differences, they do not tell a consistent story. Males have a higher fatality risk per trip for modes in which they are responsible for their actions (i.e., walking, bicycling, and teen driving) when the risk is measured per trip. Yet the difference disappears for teen driving when the risk is measured per mile, possibly because male drivers are driving greater distances than females. Regarding urban versus rural risks, students in rural areas have a significantly greater fatality risk for all modes other than bus for both risk measures (per trip and per mile). No urban versus rural comparison for injuries is possible because no usable urban/rural measure exists in the GES database. The difference between rural and urban teen drivers is quite large. The hazard rates for drivers aged 19 and older are also different.
Despite this report’s focus on accidents during normal school travel hours, the committee thought it important to report for comparison the risks faced by
school-age children during non–school travel hours. Figures 3-24 and 3-25 present the fatality risk measures (per trip and per mile, respectively) for normal school travel hours and all non–school travel hours. On a per-trip basis and across the four age groupings, travel risks during non–school travel hours are approximately twice what they are during normal school travel hours. On a per-mile basis, the risks are approximately 20 percent higher during non–school travel hours, but vary slightly with the age groups. While trips by school bus make up 25 percent of the trips during normal school travel hours, the risk per school bus trip is only 7.5 percent that of all the other modes combined (0.34 fatalities per 100 million trips versus 4.78 fatalities per 100 million trips). During non–school travel hours, children are exposed to less-safe modes of travel (with the possible exception of transit and light rail).
It would be valuable to know whether these risks change over time (e.g., whether school buses are becoming safer as compared with teen driving). Unfortunately, it is difficult to draw rigorous conclusions in this regard without replicating a large portion of this study for a different time period (e.g., using the 1990 and forthcoming 2002 NPTS data). In fact, studying trends only in the exposure measures (miles or trips) or only in the outcome measures (injuries or fatalities) without considering their ratios could yield misleading conclusions. A dramatic decrease in the number of children killed on bicycles during the past 10 years, for example, does not necessarily mean that bicycles are now much safer. In addition, when comparing the risk results presented in this report with those in other studies, careful attention must be paid to the definitions of the risk measures. Fatalities per “vehicle-mile” is not the same as fatalities per “student-mile,” and indeed will usually be higher. Annex 3-1 addresses these
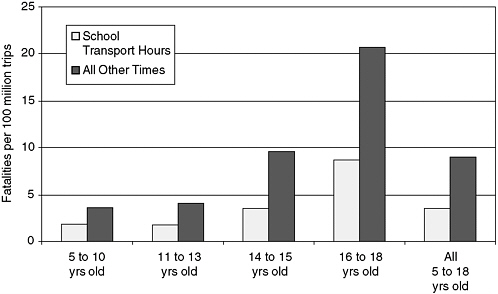
FIGURE 3-24 Comparison of fatality rates per 100 million student trips during school travel hours and all other times by age group.
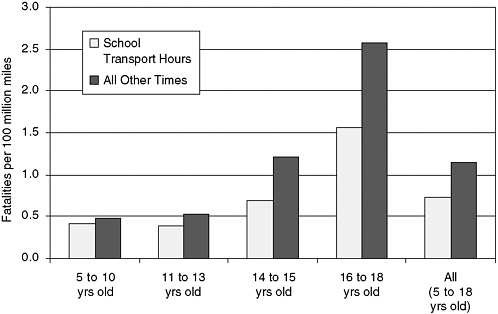
FIGURE 3-25 Comparison of fatality rates per 100 million student-miles during school travel hours and all other times by age group.
points, presents trends for several different measures, and shows how these trends can be misinterpreted.
Finally, when considering these results, it must be remembered that they are based on national averages. Results for specific school districts may vary significantly in accordance with local conditions. How these results can be used to inform policy decisions is demonstrated in Chapter 5.
Annex 3-1
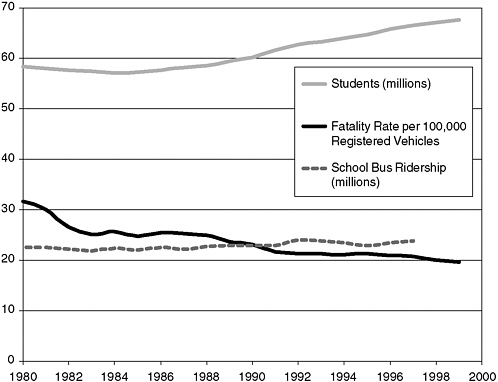
Between 1980 and 1998, national fatality rates for all drivers/all times (fatalities/100,000 vehicles) decreased from 31.6 to 20.0 (as reported in FARS); the number of students attending school increased from 58.3 million to 67.0 million (as reported in the U.S. Census); and the number of children riding school buses increased from 22.6 million to 23.8 million (as reported in the ridership database of the National Association of State Directors for Pupil Transportation Services) (see Annex 3-1 Figure 1). Unfortunately, it is difficult to extrapolate from these data any trends regarding the risks students face traveling to and from school.
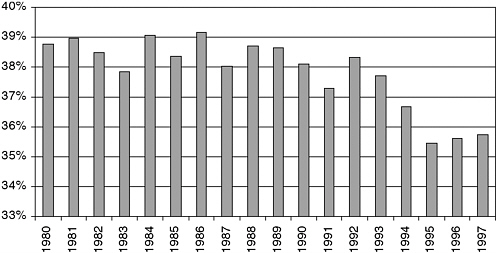
If the above school bus ridership data are accepted as being accurate (something the committee did not believe appropriate for data quality reasons), the percentage of children taking school buses can be calculated (see Annex 3-1 Figure 2). From 1992 to 1998, there appears to have been a decrease in ridership of approximately 2.5 percent, implying that 1.5 million children who may previously have ridden school buses ceased doing so. If these children selected less safe modes (e.g., teenagers driving themselves), then the risk for all children as a group may have increased. However, this conclusion is dependent on the answers to several questions: What is the significance of the improvement in overall motor vehicle risk as compared with the change in risk caused by modal shift? Did other children switch from riskier modes to less risky modes? Were school buses even an option for these children? If the children switched to transit buses, the risks may not have increased.
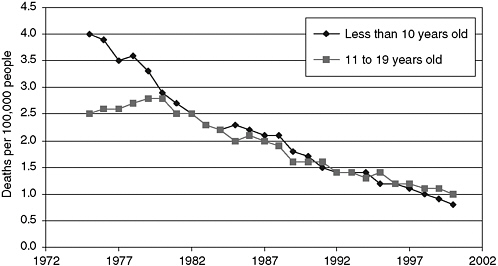
Shown in Annex 3-1 Figure 3 are pedestrian fatality rates for those under age 20 (deaths per 100,000). The apparent sharp decline in the rate says absolutely nothing about what is happening to the risk of children walking to school; the decline could be caused by a significant decrease in the number of children walking. A far more valuable graph would show the fatality rate per trip (as is done in this report), but these data are not available for multiple years.
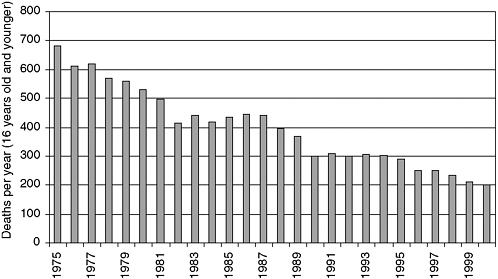
Shown in Annex 3-1 Figure 4 are the numbers of fatalities resulting from bicycle accidents for children age 16 or younger. Again, the sharp decline shown in this figure says nothing about what is happening to the risk of children bicycling to and from school. If the number of children bicycling were decreasing more rapidly than the number of fatalities, the actual risk could be increasing. Exposure data that would make it possible to draw any conclusions are not readily available.
Finally, without repeating the present study using multiple historical datasets (which are not available), it is not possible to draw any concrete conclusions about the trend in overall risk. Relying on data whose pedigree can be questioned (e.g., Annex 3-1 Figures 1 and 2) or whose exposure measures are irrelevant or missing (e.g., Annex 3-1 Figures 3 and 4) can be misleading and confusing.