
Appendix H
Quantitative Assessment of Polygraph Test Accuracy
This appendix provides additional details regarding the data on polygraph test accuracy extracted during our systematic literature review, as well as technical background on methods we used for estimating a receiving operator characteristic (ROC) curve and associated area from each set of data.
Characteristics of Studies As described in Chapter 5 and Appendix G, we extracted 59 datasets from 57 studies (52 laboratory, 7 field) including 3,681 polygraph examinations (3,099 laboratory, 582 field). Of the 57 studies, 41 (34 laboratory, 7 field) reported data allowing ROC curve estimation from two points, while 17 laboratory studies provided only one estimated ROC point and a single laboratory study provided ten estimated points on its single ROC. The median sample size in a dataset, including both genuine or programmed deceptive and nondeceptive examinees, was 49, with mean 62.4 (median and mean 48 and 59.6, respectively, for laboratory datasets, and 100 and 83.1, respectively, for field datasets). Only one (laboratory) dataset had fewer than 20 examinees, while only nine datasets (five laboratory, four field studies) had as many as 100 examinees. As best as could be determined, 21 studies were funded by agencies with operational polygraph programs, of which 16 were internal reports of such agencies. Of studies not funded by polygraph agencies, 20 were locally funded studies at academic or other research institutions, two were internally funded at other organizations without operational polygraph programs, and 14 were externally funded studies
at academic or other research institutions without operational polygraph programs.
Of the laboratory datasets, 37 described comparison question tests, 13 described concealed information tests, 1 described the relevant-irrelevant test, and 1 described another procedure; among field studies, 6 described comparison question tests and 1 a peak-of-tension concealed information procedure. Questioning referred to specific incidents in all cases but one. The electrodermal measure was skin conductance for 23 datasets (22 laboratory, 1 field), skin resistance for 22 (18 laboratory, 4 field), and could not be determined for 14 datasets (12 laboratory, 2 field). For 36 datasets (33 laboratory, 3 field), both committee reviewers agreed that the studies were silent as to whether examiners or scorers (or both) were masked to the base rate of deception in the examinee pool, and reviewers of 3 others (2 laboratory, 1 field) agreed that the base rate was known by examiners and scorers. For only 3 of the remaining datasets did the reviewers agree as to nature of masking. Twenty-two datasets (21 laboratory, 1 field) reported on computer scoring, 5 alone (all laboratory) and 16 (15 laboratory, 1 field) in conjunction with human scoring. Of the 54 datasets (47 laboratory, 7 field) that reported on human scoring, 28 (23 laboratory, 5 field) presented results of multiple scorers with information on inter-rater variability, while 26 (24 laboratory, 2 field) either reported only on single scorers or used multiple human scorers but did not report on inter-rater variability.
Our documentation categories of detailed and clear, adequate, and minimal were assigned respective scores of 0, 1, and 2. Study scores averaged 1.2 of 2, with 26, 21, and 10 studies respectively scoring above, at, and below 1.0. The average analytic quality rating scores similarly averaged 1.0, with 14, 29, and 14 studies above, equal to, and below 1.0, respectively. On a five-point scale (best score 1.0), internal validity scores averaged 3.04 (median = 3.0), with 10 studies at 2.0 or better, 25 studies 2.0+ to 3.0 inclusive, 20 studies 3.0+ to 4.0 inclusive, and 2 studies scored 4.5. On the same scale, salience scores averaged 3.3 (median = 3.5), with 5 studies at 2.0 or better, 19 studies at 2.0+ to 3.0 inclusive, 26 studies 3.0+ to 4.0 inclusive, and 7 studies 4.0+ to 5.0 inclusive. Scores for laboratory and field studies were generally similar, with laboratory studies faring about half a point better on internal validity, and field studies having a modestly smaller advantage on salience. Field studies also were rated slightly better than laboratory studies on documentation and data analysis. The quality scores for protocol documentation, data analysis, internal validity, and salience were correlated as might be anticipated. With signs adjusted so that positive correlations represent agreement in quality, correlations of salience score with protocol documentation score, data analysis score, and internal validity score were respectively 0.33, 0.42, and 0.49.
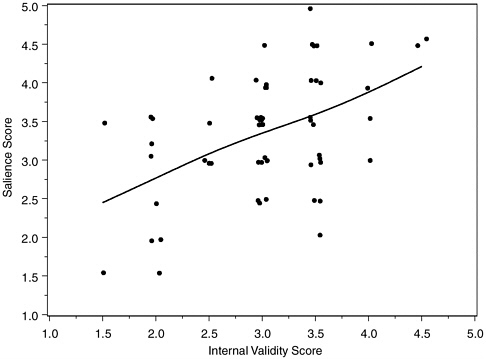
FIGURE H-1 Salience scores and internal validity scores of 57 polygraph validation studies.
NOTE: Scores represent means of two (occasionally three) committee reviewers.
Correlations of internal validity score with protocol documentation and data analysis scores were 0.37 and 0.66, respectively, with a correlation of 0.30 between documentation and data analysis scores. Figure H-1 plots salience against internal validity scores, with points jittered slightly left and right to avoid overlap. A smoothing spline portrays the association.
Method of Estimating Accuracy We used the area under an ROC curve extrapolated from each dataset to summarize polygraph accuracy as manifested in that dataset. Since only one dataset gave more than two points for ROC extrapolation, an underlying model was helpful to join the small number of dots. (Here we follow the maxim, attributed to the statistician G.E.P. Box, that “all models are wrong, but some models are useful.”) The dominant model in the signal detection theory research assumes that the criterion on which decisions are based (here, the polygraph chart score) has different normal (Gaussian) distributions among groups with signal absent and present (here, nondeceptive and deceptive examinees). These distributions are presumed to have different means
and may also have different standard deviations (a measure of spread). To extrapolate an ROC curve from only one point using this Gaussian model requires that we additionally assume these standard deviations are equal. Figure H-2 shows six theoretical ROCs from this “equivariance” binormal model, with respective A values of 0.5, 0.6, 0.7, 0.8, 0.9, 0.95, along with the reverse diagonal line corresponding to sensitivity = (1– false positive rate), which can alternately be interpreted as false positive rate = false negative rate. On this line, the probability that the test is correct is the same whether the examinee is deceptive or nondeceptive. The intersection of each ROC with this line highlights the difference be-
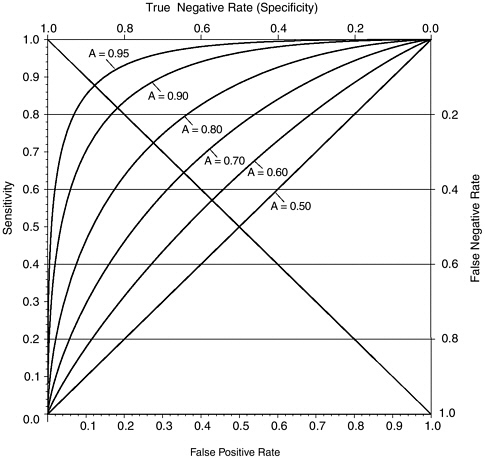
FIGURE H-2 Six theoretical ROC curves from the “equivariance” binormal model.
NOTE: Curves are binormal equivalence ROCs with accuracy index (A) values of 0.5, 0.6, 0.7, 0.8, 0.9, and 0.95.
tween A and the probability that the test is correct. Note that, for these curves, when the test is correct with the same probability for deceptive as for nondeceptive examinees, this shared probability is between 5 percent and 10 percent lower than the value of A for each ROC. Elsewhere on the ROC, percent correct depends heavily on the base rate and, in some circumstances, may not be lower than the value of A.
Under this model, the method of maximum likelihood estimation is commonly used to estimate the ROC, and hence A. However, this method fails without at least one observation in each of the categories used to determine the ROC points. When some categories are only sparsely filled, it also can produce unstable and inadmissible results: that is, ROC curves that idiosyncratically dip below the 45-degree diagonal instead of increasing steadily from the lower left to the upper right-hand corners of the graph. In either of these instances, we estimated A directly from the empirical ROC data, by connecting points from the same study to each other, the leftmost point to the lower left-hand corner, and the rightmost point to the upper right-hand corner, and determining A as the area within the polygon generated by those lines and the lower and right-hand plotting axes. In the signal detection theory literature, this is known as the “trapezoidal estimate.” For our data, where one-point ROCs with equivariance binormal maximum likelihood estimates exist, the resulting estimates of A tended to be higher than the trapezoidal estimates by about 0.1; for two-point ROCs, the discrepancy between the trapezoidal and binormal (possibly with unequal variances) estimates of A was much smaller, generally 0.01-0.03. Had sample sizes been large enough to allow the use of a binormal estimate in all cases, we conjecture that the median values of A reported in Chapter 5 and below would have increased by 0.02-0.03 for laboratory studies and perhaps 0.01 for field studies.
Accuracy in Laboratory Studies Figure H-3 plots values of A from the extrapolated ROCs from our 52 laboratory datasets, in descending order of A from left to right. Below each point is suspended a line of length equal to the estimated standard error of the associated A, to give an indication of the inherent variability in these numbers given the sizes of the various studies. From the lengths of most of these lines, it is clear that few of these studies estimate A precisely. Furthermore, the apparent precision of the high estimates at the upper left may well be due to the fact that values of A that are near the maximum due to chance necessarily produce unduly low estimates of variability. We note, in any event, that the large majority of A values are between 0.70 and 0.95, and that half the studies fall between the lower and upper quartiles of A = 0.813 and 0.910, represented by the horizontal lines.
One might suspect that the highest and lowest values of A would
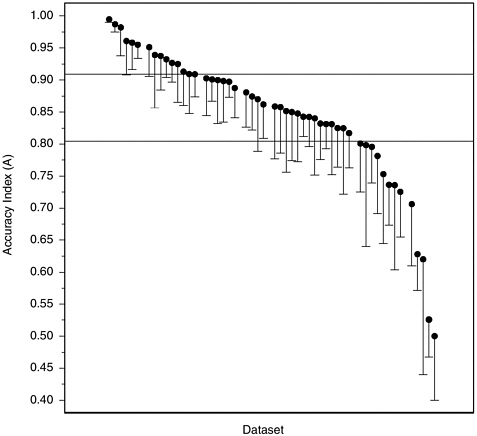
FIGURE H-3 Accuracy index (A) values calculated from 52 datasets from laboratory studies.
NOTE: Vertical lines are the length of one standard error; they extend downward from the accuracy index value for convenience of presentation.
have arisen by chance from studies with particularly small sample sizes, but in fact these groups of studies have sample sizes comparable to the larger collection. It is also interesting to note that values of A have not been increasing over time, as they might be expected to do if, as some members of the polygraph community have suggested to the committee, older studies underestimate the accuracy of current polygraph testing due to recent improvements in technique. The 6 datasets with the lowest A values were all reported in the 1990s, while the 7 datasets with highest A values were reported between 1968 and 1989, and none of the 9 datasets with A exceeding 0.95 were among the 22 datasets reported after 1992. Looked at another way, the median A for 8 datasets (7 laboratory, 1 field) reported prior to 1980 was 0.94, for 21 datasets (19 laboratory, 2 field)
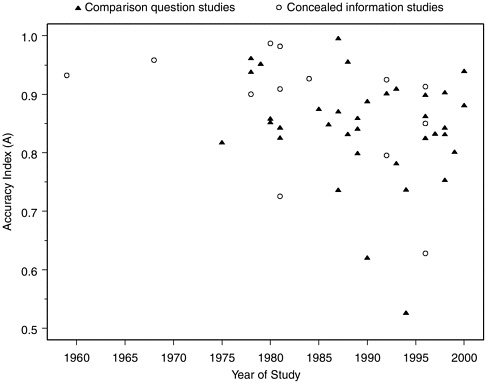
FIGURE H-4 Accuracy index (A) values for laboratory studies over time.
reported in the 1980s was 0.86, and for the 30 most recent datasets (26 laboratory, 4 field) was 0.85. Figure H-4 shows the relationship of A to time, distinguishing between data on comparison question tests and concealed information or guilty knowledge tests. Although there are many more comparison question than concealed information datasets, the trend appears downward for both.
In view of the low methodological quality ratings that we assigned to many of these studies, we readdressed the above points in the subset of 14 laboratory studies with internal validity scores better than 3 on a 1-5 scale (with 1 as best). These studies included 721 polygraph tests. Figures H-5, H-6, and H-7 are the counterparts within this subgroup of studies of Figures 5-1, H-3, and H-4 for the laboratory studies with the best internal validity. The situation portrayed is much the same as for the full group of laboratory studies. Outliers excluded, the negative time trend in A values from comparison question test datasets appears similar in the high internal validity subgroup, and the decline is not visible in the concealed information test datasets of which, however, only three are included. In Figure H-7, each dataset is symbolized on the plot by the salience score
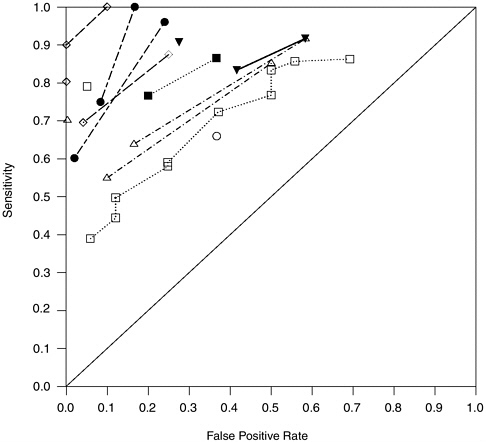
FIGURE H-5 Sensitivity values and false positive rates for 14 laboratory datasets with high internal validity.
NOTE: Points connected by lines come from the same dataset.
that committee reviewers assigned to the study from which it was derived. Datasets from studies with higher salience (i.e., lower salience scores) tend to fall in the middle of the range of A values on the plot.
In view of the issue of possible research bias associated with the sponsorship of research, we attempted to classify studies by source of funding: internal studies by agencies with and without polygraph programs, studies by other groups externally funded by agencies with and without polygraph programs, and locally funded studies by academics. It was not always possible to do this without ambiguity, because funding sources were not always fully clear from the publications and because of the close connections of most researchers in the field to the polygraph
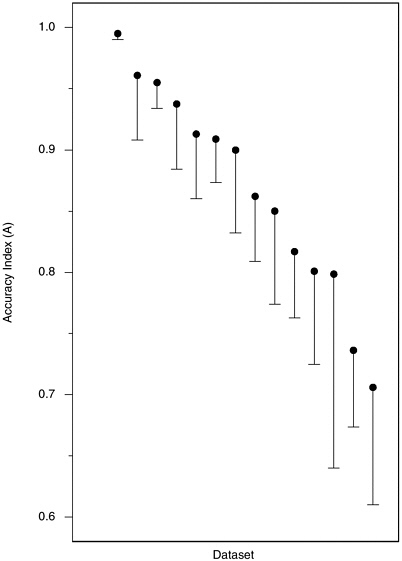
FIGURE H-6 Accuracy index (A) values calculated from 14 datasets from laboratory studies with high internal validity.
NOTE: Vertical lines are the length of one standard error; they extend downward from the accuracy index value for convenience of presentation.
profession or one or more government polygraph agencies. The attempt was made, nevertheless. Figure H-8 shows boxplots of values of A from the datasets we selected from studies in each of these five funding groups. For each group, the central box contains the middle half of the values of A, with the median value marked by a dot and horizontal line. The
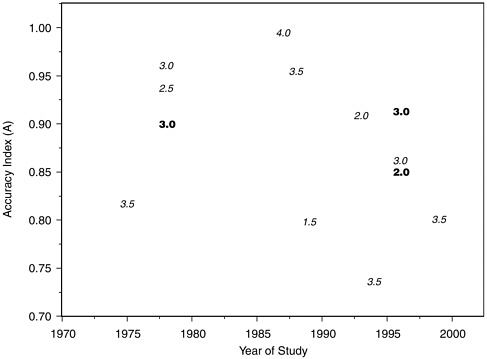
FIGURE H-7 Accuracy index (A) values for comparison question and concealed information laboratory polygraph studies with high internal validity, by year and salience score.
NOTES: Each dataset is symbolized on the plot by the salience score that committee reviewers assigned to the study from which it was derived. Boldface type indicates concealed information studies; italic type indicates comparison question studies.
“whiskers” extend to the largest and smallest values within 1.5 times the interquartile range of the edge. Any values farther out are marked by detached dots and horizontal lines. The data in Figure H-8 suggest that studies internal to or funded by polygraph agencies do not report higher measures of polygraph validity than studies funded by other sources.
Figure H-9 shows parallel boxplots for the entire group of 52 datasets, the subgroup of 14 datasets with internal validity score better than 3, and the subgroup of four datasets with both internal validity and salience scores better than 3. Restricting to high validity and salience does not change the overall impression conveyed by these data, that characteristic values of A from laboratory studies fall in the broad range between 0.70 and 0.95, with the most characteristic values falling in or slightly above the 0.81-0.91 range, which contains half (26 of 52) of our selected datasets.
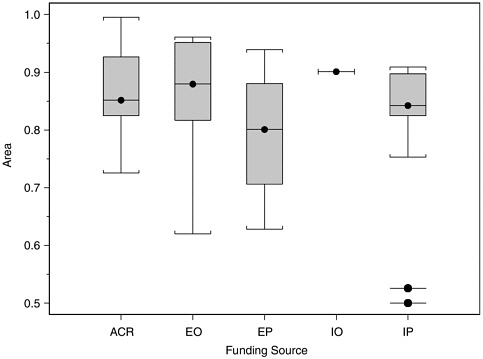
FIGURE H-8 Boxplots of accuracy index (A) values for datasets from laboratory studies, by funding source.
NOTE: ACR, academic research organization (n = 19); EO, externally funded by agency without polygraph program (n = 14); EP, externally funded by agency with polygraph program (n = 5); IO, internally funded by agency without polygraph program (n = 1); IP, internally funded by agency with polygraph program (n = 13).
Accuracy in Field Studies Figure H-10 displays A values for the 7 field datasets (i.e., specific-incident polygraphs) discussed in Chapter 5, in the same manner as Figure H-3 for the 52 laboratory datasets. As noted above, the median value of 0.89 is roughly the same as the median of 0.86 for the laboratory datasets, with the difference about what might be expected from the more frequent use of trapezoidal estimates of area for the laboratory studies. The standard errors are a bit smaller for the field studies (which have larger sample sizes) than for the laboratory studies, with that for the first study shown in Figure H-10 artificially small due to the proximity of the estimate to the maximum. The two studies with lowest values of A were done 20 years apart, one in the late 1970s and the other in the late 1990s. The five other studies were done in 1988-1991.
The types of funding used to support of these studies illustrate why the categories we used, which are reasonable and quite distinct at face
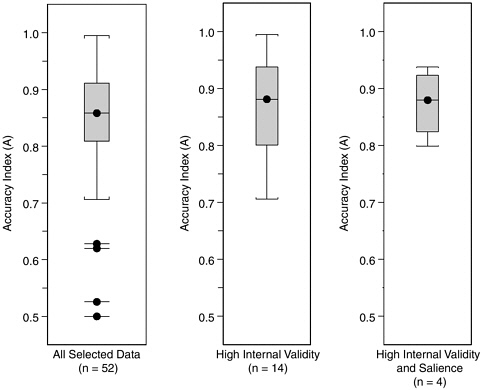
FIGURE H-9 Boxplots of accuracy index (A) values for all 52 laboratory datasets, the subgroup of 14 datasets with internal validity scores better than 3, and the subgroup of 4 datasets with both internal validity and salience scores better than 3.
value, often blur in the context of polygraph research. Only three of these seven studies were funded by agencies with polygraph programs. However, one study classified as locally funded academic research was conducted in the university laboratory of a polygraph examiner and former employee of the U.S. Department of Defense Polygraph Institute. Another, with A essentially equal to 1.0 in the above figures, was the doctoral dissertation of the president of a polygraph company, based on data from polygraph tests that used a specific variant of the control question test, with an associated scoring mechanism, that the author had developed some years earlier. Of 122 polygraph tests from criminal investigations that were examined in this particular study, there were seven inconclusive tests but no false positive or false negative errors.
Due to the small number of field studies available, we use a slightly more lenient criterion in restricting to higher quality studies and consider
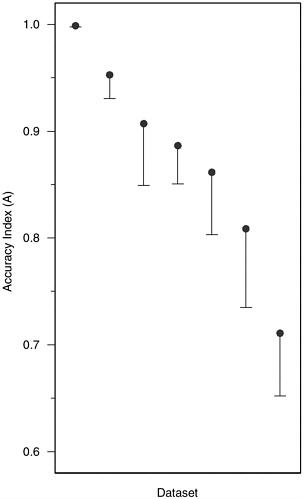
FIGURE H-10 Accuracy index (A) values for seven field datasets. NOTE: Vertical lines are the length of one standard error; they extend downward from the accuracy index value for convenience of presentation.
the smaller set of studies with internal validity rating of less than or equal to 3 (contrasting with the criterion of less than 3 used for laboratory studies). Only two of the seven field studies met this criterion and also had salience ratings of better (i.e., lower) than 3. Their associated A values were 0.91 and 0.89, close to the median A of 0.89 for the seven datasets. Thus, the results of the field studies, if taken literally, suggest that the average accuracy of polygraph testing in field specific-incident investigations is similar to and may be slightly higher than that found in polygraph accuracy studies using laboratory models. However, inas-
much as none of these studies isolates the determination of truth from performance on the polygraph examination, they share a bias that must inflate apparent accuracy, perhaps to a significant degree. This result, in conjunction with the tendency for diagnostic test performance to degrade in field application relative to under laboratory conditions, leads us to believe that actual polygraph test performance in the field, if it could be measured against actual truth, would show a lower level of accuracy than indicated by the field or laboratory datasets we examined.


