
2
Validity and Its Measurement
In this chapter we first define some terms needed to clarify what our study did and did not cover. We then discuss concepts of validity and the empirical measurement of the accuracy of polygraph testing. We discuss methods for measuring accuracy and present our rationale for our chosen method of measurement. We conclude by discussing two difficult issues in assessing polygraph validity: (1) distinguishing the validity of the polygraph as an indicator of deception from its utility for such purposes as deterring security threats and eliciting admissions, and (2) defining the appropriate baseline against which to draw inferences about accuracy.
RELIABILITY, ACCURACY, AND VALIDITY
Psychophysiological testing, like all diagnostic activities, involves using specific observations to ascertain underlying, less readily observable, characteristics. Polygraph testing, for example, is used as a direct measure of physiological responses and as an indirect indicator of whether an examinee is telling the truth. Claims about the quantity or attribute being measured are scientifically justified to the degree that the measures are reliable and valid with respect to the target quantities or attributes.
Reliability
The term reliability is generally used to indicate repeatability across different times, places, subjects, and experimental conditions. Test-retest
reliability is the extent to which the same measurement procedure (with the polygraph, this includes the examiner, the test format, and the equipment) used to examine the same subject for the same purpose yields the same result on repetition.1Inter-rater reliability is the extent to which different examiners would draw the same conclusions about a given subject at a given time for a given examination. In practice and in the literature we have considered, discussions of inter-rater reliability have focused almost exclusively on the repeatability of chart scoring across human or computer raters. Inter-rater reliability has been a critical issue in some celebrated practical uses of the polygraph. (Appendix C describes the use of the polygraph in investigations of Wen Ho Lee for espionage or other security violations; part of the story concerns differing interpretations of the results of a 1998 polygraph ordered by the U.S. Department of Energy.)
There is also potentially large variability in ways an examination is conducted: which questions are asked, how they are asked, and the general atmosphere of the examination. This variability can in principle seriously threaten test-retest reliability to the extent that polygraph examiners have latitude in asking questions.2 Reliability across examinees is another important component of overall test reliability. For example, two examinees may have engaged in the same behaviors and may give the same answers to the same test questions, but due to different interpretations of a question, may have differing beliefs about the truthfulness of their responses and so produce different polygraph readings.
Internal consistency is another aspect of reliability. For example, a polygraph test may be judged to indicate deception mainly because of a strong physiological response to a single relevant question. If the examinee shows similar responses to other relevant questions about the same event or piece of information, the test is internally consistent.
Reliability is usually defined as a property of a measure as used on a particular population of people or events being measured. If the polygraph is to be applied in standard ways across a range of people and situations, it is desirable that measures be reliable across the range of people and situations being measured—whether subjects and examiners are calm or nervous, alert or sleepy, relaxed or under time pressure, male or female, from the same or different cultural backgrounds, in the laboratory or in the field, etc.
Accuracy and Validity
Scientific inference requires measures that exhibit strong reliability. However, a highly reliable test has little use if it is measuring something
different from its intended target. A measurement process is considered valid if it measures what it is supposed to measure. As with reliability, there are several aspects to validity. It is particularly important for the committee’s work to distinguish between the empirical concept of criterion validity, or accuracy, and the theoretical concept of construct validity.
Criterion Validity (Accuracy)
Criterion validity refers to how well a measure, such as the classification of polygraph test results as indicating deception or nondeception, matches a phenomenon that the test is intended to capture, such as the actual deceptiveness or truthfulness of examinees on the relevant questions in the test. When the test precedes the criterion event, the term predictive validity is used; criterion validity is the more general term that applies even when the criterion event precedes the test, as it normally does with the polygraph. The term “’accuracy’’ is often used as a nontechnical synonym for criterion validity, and it is used in that way in this report. Polygraph accuracy is the extent to which test results correspond to truth with actual examinees. The proportion of correct judgments made by a polygraph examiner is a commonly used measure of accuracy for the polygraph test. (We discuss the shortcomings of this measure of accuracy and propose a more appropriate one below.)
Individual polygraph validation studies typically include accuracy measures that apply to the specific population that was tested. Evidence of accuracy becomes more general to the extent that test results are strongly and distinctively associated with truthfulness or deception in a variety of populations. Populations of interest include those containing high proportions of individuals who can be presumed to be deceptive on the critical questions (e.g., criminal suspects); those with low proportions of such people (e.g., nuclear scientists, intelligence agents); special populations that may be likely to show false negative results (e.g., people who want to deceive the examiner and who use countermeasures to try to “beat” the test); and populations that may be likely to show false positive results (e.g., truthful people who are highly anxious about the test). The same is true for test situations. Evidence of accuracy becomes more general as test results correspond with actual truthfulness or deceptiveness across situations (e.g., in criminal investigations, in employee security screening, and so forth). It is possible for a test such as the polygraph to be more accurate in some situations (e.g., criminal investigations) than in others (e.g., employee screening).
Construct Validity
Accuracy, or criterion validity, is essential for the overall validity of a test: no test that lacks it can be accepted as valid. However, it is not sufficient: additional evidence of validity is needed to give confidence that the test will work well with kinds of examinees and in examination settings that have not yet been tested. Thus, another critical element of validity is the presence of a theory of how and why the test works and of evidence supporting that theory. Construct validity refers to how well explanatory theories and concepts account for performance of a test. Users can have greater confidence in a test when evidence of its accuracy is supported by evidence of construct validity, that is, when there is a chain of plausible mechanisms that explain the empirical findings and evidence that each mechanism operates as the theory prescribes.
In the case of lie detection by polygraph, one theory invokes the following presumed chain of mechanisms. Lying leads to psychological arousal, which in turn creates physiological arousal. The polygraph measures physiological responses that correspond to this arousal: galvanic skin response, respiration, heart rate, and relative blood pressure. The measurements taken by the polygraph machine are processed, combined, and then scored to compute an overall index, which is used to make a judgment about the examinee’s truthfulness. The validity of psychophysiological detection of deception by the polygraph depends on validity all along this chain. Important threats to construct validity for this theory come from the fact that the physiological correlates of psychological arousal vary considerably across individuals, from the lack of scientific evidence to support the claim that deception has a consistent psychological significance for all individuals, and from the fact that psychological arousal is associated with states other than deception. We discuss these issues further in Chapter 3.
As just noted, evidence supporting the construct validity of the test is important to give confidence in its validity in settings where criterion validity has not yet been established. It is also important for refining theory and practice over time: according to the theory mentioned, better measures of psychological arousal should make a more valid test. And it is important for anticipating and defeating countermeasures: knowing the strengths and weaknesses of the theory tells practitioners which possible countermeasures to the test are likely to fail and which ones to worry about.
The strongest scientific basis for a test’s validity comes from evidence of both criterion validity and construct validity. Nevertheless, it may be possible to demonstrate that an appropriately selected set of physiological measures has sufficient accuracy in certain settings to have practical
value in those settings, despite lack of strong support for the underlying theory and even in spite of threats to construct validity.
A useful analogy for understanding the issues of reliability, accuracy, and validity is the use of X-ray equipment in airport security screening. The X-ray examination is reliable if the same items are detected on repeated passes of a piece of luggage through the detection machine (test-retest reliability), if the same items are detected by different operators looking at the same image (inter-rater reliability), and if the same items are detected when the test is conducted in different ways, for example, by turning the luggage on different sides (internal consistency). The examination is accurate at detection if, in a series of tests, the X-ray image allows the examiner to correctly identify both the dangerous objects that are the targets of screening and the innocuous objects. Confidence in the validity of the test is further increased by evidence supporting the theory of X-ray screening, which includes an understanding of how the properties of various materials are registered in X-ray images. Such an understanding would increase confidence that the X-ray machine could detect not only ordinary dangerous objects, but also objects that might be concealed or altered in particular ways to avoid detection—including ways that have not yet been used in any test runs with the equipment.
For X-ray detection, as for the polygraph, reliability and validity depend both on the measuring equipment and on the capabilities and training of the operators. Validity depends on the ability of the equipment and the operators to identify target objects or conditions even when they appear in unusual ways or when efforts have been made to make them less detectable. Successful countermeasures to X-ray detection would diminish the validity of the screening. It is important to note that successful countermeasures would only decrease the test’s accuracy if they were used frequently in particular trial runs—accuracy might look quite impressive if such countermeasures had not yet been tested. This is one reason that evidence of accuracy, though necessary, is not sufficient to demonstrate test validity. X-ray screening is not presumed to have perfect validity: this is why objects deemed suspicious by X-rays are checked by direct inspection, thus reducing the number of false positive results on the X-ray examination. There is no corrective, however, for false-negative X-ray results that allow dangerous objects on an aircraft.
Measuring Accuracy
Because of the many elements that contribute to construct validity, it is difficult to represent the construct validity of a test by any single numerical indicator. This section therefore focuses on criterion validity, or accuracy, which can be measured on a single scale.
To measure criterion validity, it is necessary to have a clearly defined criterion. The appropriate criterion depends on whether the polygraph is being used for event-specific investigation, employee screening, or preemployment screening. For event-specific investigation, the polygraph is intended to measure the examinee’s truthfulness about a specific incident. The accuracy of the polygraph test is the correspondence of the test outcome with actual truthfulness, which in this context is easy to define (although not necessarily to ascertain). Thus, measurement of accuracy in the specific-event case is straightforward in principle. It can be difficult in practice, however, if there is no way of independently determining what actually occurred.
Measuring accuracy in the employee screening polygraph setting raises more difficult issues. The Test of Espionage and Sabotage (TES) polygraph examination commonly used for screening at the U.S. Department of Energy weapons laboratories is intended to test whether an individual has committed espionage, engaged in sabotage, provided classified information to an unauthorized person, or had unauthorized contact with a foreign national. The examination asks whether the examinee intends to answer the security questions truthfully and whether he or she has engaged in any of the target behaviors. Accuracy of this screening polygraph might be defined as the extent to which the polygraph scoring corresponds to actual truthfulness of responses to these target questions. It might also be defined for a multi-issue polygraph screening test as the extent to which the test results correctly identify which of the target behaviors an examinee may have engaged in.
These seem straightforward criteria at first glance. However, there often is a large class of events that may be relevant to the examination, and it may not be clear to the examinee which of these is intended to be covered. For example, if asked whether one has ever provided classified information to an unauthorized person, one employee might have an emotional reaction brought on by remembering an incident in which he or she failed to properly wrap a classified report for a one-minute trip outside a secured area. Another employee might not have such a reaction. Such an event is a security violation, but individuals may differ about how serious it is and how relevant it is to the test question.
The U.S. Department of Energy (DOE) has developed guidelines regarding the behaviors that are and are not covered by TES questions, which probably resolve many ambiguities for examinees (a detailed description of how the terms espionage and sabotage are explained to examinees in research uses of the TES appears in Dollins [1997]). However, there appear to be ambiguous, even inconsistent definitions for the target of the TES for examiners. Agency officials repeatedly told the committee that the counterintelligence program at DOE is intended to identify serious
breaches of security, not minor security infractions (such as leaving a secure computer on when leaving one’s office briefly or what examiners call “pillow talk”). Yet, we were also told that all examinees who showed “significant response” results, requiring additional charts or repeat tests, were “cleared” after admitting such minor infractions. We were told that there were 85 such cases among the first 2,000 tested in the DOE polygraph security screening program. Under the assumption that the TES is intended to find serious problems, these 85 are false positives—tests that give positive results even though the target violations did not occur— (assuming, of course, that there were no unadmitted major infractions). However, in discussions with the committee, DOE polygraph examiners seemed to indicate that an instance of “pillow talk” revealed in response to follow-up questions triggered by a polygraph chart indicating “significant response” was regarded as a true positive, suggesting that the target of the screening was any security infraction, regardless of severity. Under this broader target, the same minor infraction in an individual who showed “no significant response” should be regarded as a false negative, whereas the DOE polygraph examiners seemed to indicate that it would be counted as a true negative, suggesting a switch to the narrower definition of target.
Assessing the polygraph’s accuracy for screening cannot be done without agreement on the criterion—what it is supposed to be accurate about. The committee has seen no indication of a clear and stable agreement on what the criterion is, either in general or within any particular organization that uses polygraph screening.
In addition to an agreed definition of the criterion, an appropriate point of comparison is necessary to assess accuracy. Some representatives of the DOE polygraph screening program believe that the program is highly accurate because all 85 employees whose polygraphs indicated deception eventually admitted to a minor security infraction. If detecting minor security violations is the target of a security polygraph screening test, then these 85 are all true positives and there are no false positives. However, the significance of these admissions for accuracy cannot be evaluated in the absence of data from an appropriate comparison group. Such a group might consist of examinees who were interrogated as if the polygraph test indicated deception, even though it did not. We have been told on numerous occasions that almost everyone who has held a security clearance has committed at least one minor security infraction. If this is true, the suggested interrogation of a comparison group whose polygraph tests did not indicate deception might have uncovered a large number of minor infractions that the polygraph did not detect. Such members of the comparison group would be false negatives. Thus, the high accu-
racy suggested by the lack of false positives would be undercut by the presence of perhaps many false negatives.
All these considerations make it obvious that evaluating the accuracy of the employee screening polygraph is a nontrivial task. It requires more care in defining the criterion than is evident in current practice; it also requires great care in analyzing the evidence.
When the polygraph is used for preemployment screening, defining and measuring accuracy poses additional challenges. In this setting, the polygraph test is being used, in effect, to predict particular aspects of future job performance, such as the likelihood that the examinee, if employed, will commit security violations in the future.3 As is the case for employee screening, defining accuracy requires a clear statement of which specific aspects of future job performance constitute the appropriate criterion. Given such a statement, one way to measure the accuracy of a preemployment polygraph test would be to compare those aspects of job performance among people who are scored as deceptive with the same aspects of performance for people who are scored as nondeceptive. This is impractical if people who score as deceptive are not hired and therefore do not get the chance to demonstrate their job performance. It would be practical, however, to compare the job performance of employees whose scores on the preemployment polygraph varied across the range of scores observed among those hired. In particular, it would be useful to examine the extent to which a person’s score on a preemployment screening polygraph correlated with later instances of target behaviors, such as security violations, that came to the attention of management. We know of no such studies.
Another difficulty in measuring the accuracy of preemployment polygraph tests is that adverse personnel decisions made on the basis of preemployment polygraph examinations are not necessarily due to readings on the polygraph chart.4 For instance, we were told at the FBI that applicants might be rejected for employment for any of the following reasons:
-
they make admissions during the polygraph examination that specifically exclude them from eligibility for employment (e.g., admitting a felony);
-
they provide information during the polygraph interview that is not itself a bar to employment but that leads the applicant to be judged deceptive (e.g., admitting past activities that were not disclosed on the job application);
-
their behavior during the polygraph interview leads to the conclusion that they are trying to evade detection (e.g., the examiner concludes that the applicant is using countermeasures); or
-
the scoring of the polygraph chart supports an assessment that the applicant is deceptive.
Only the last of these reasons is unambiguously a function of the physiological responses measured by the polygraph.5 For the other reasons, the chart itself is only one input to the decision-making process. The relative importance of physiological responses, interrogation technique, and astute observation by an examiner is difficult to determine and is rarely explored in research. These distinctions may not be considered important for judging the usefulness or utility of polygraph examinations as screening tools, but they are critical if the personnel decisions made on the basis of the polygraph examination are to be used for measuring accuracy.
There are difficulties with using polygraphs (or other tests) for preemployment screening that go beyond accuracy. Perhaps most critical, it is necessary to make inferences about future behavior on the basis of polygraph evidence about past behaviors that may be quite different in kind. The construct validity of such inferences depends on specifying and testing a plausible theory that links evidence of past behavior, such as illegal drug use, to future behavior of a different kind, such as revealing classified information. We have not found either any explicit statement of a plausible theory of this sort in the polygraph literature or any appropriate evidence of construct validity.
A CONSISTENT APPROACH TO MEASURING ACCURACY
For choosing appropriate measures of accuracy it is helpful to consider the polygraph as a diagnostic test of truthfulness or deception and the criterion as consisting of independent indicators of what actually occurred. In this respect, the polygraph is similar to other diagnostic tests; the scientific work that has gone into measuring the accuracy of such tests can be applied to measuring the accuracy of the polygraph. This section draws on this scientific work and explains the measure of accuracy we have chosen for this study. It introduces a number of technical terms that are needed for understanding our measure of accuracy.
Diagnostic tests generally result in a binary judgment—yes or no— concerning whether or not some condition is present. The tests themselves, however, usually give more than two values. For example, cholesterol tests give a range of values that are typically collapsed into two or three categories for purposes of medical decision: high risk, justifying medical intervention; low risk, leading to no intervention; and an intermediate category, justifying watchful waiting or low-risk changes in diet and life-style, but not medical intervention. Polygraph tests similarly
give a range of values that are typically collapsed into a few categories for decision purposes, such as “significant response,” “no significant response,” and an intermediate category called “inconclusive.”
There are two distinct aspects to accuracy. One is sensitivity. A perfectly sensitive indicator of deception is one that shows positive whenever deception is in fact present: it is a test that gives a positive result for all the positive (deceptive) cases; that is, it produces no false negative results. The greater the proportion of deceptive examinees that appear as deceptive in the test, the more sensitive the test. Thus, a test that shows negative when an examinee who is being deceptive uses certain countermeasures is not sensitive to deception. The other aspect of accuracy is specificity. An indicator that is perfectly specific to deception is one that always shows negative when deception is absent (is positive only when deception is present). It produces no false positive results. The greater the proportion of truthful examinees who appear truthful on the test, the more specific the test. Thus, a test that shows positive when a truthful examinee is highly anxious because of a fear of being falsely accused is not specific to deception because it also indicates fear. Box 2-1 gives precise definitions of sensitivity, specificity, and other key terms relevant to measuring the accuracy of polygraph testing. It also shows the quantitative relationships among the terms.
The false positive index (FPI) and the positive predictive value (PPV) are two closely related measures of test performance that are critical to polygraph screening decisions.6 The FPI is the ratio of false positives to true positives and thus indicates how many innocent examinees will be falsely implicated for each spy, terrorist, or other major security threat correctly identified. The PPV gives the probability that an individual with a deceptive polygraph result is in fact being deceptive. The two are inversely related: PPV = 1/(1 + FPI); the lower the PPV, the higher the FPI.
Much research on diagnostic accuracy draws on a general theory of signal detection that treats the discrimination between signals and noise. Signals are “positive” conditions—the polygraph test readings of respondents who are being deceptive, for example. Noise is any “negative” event that may mimic and be difficult to distinguish from a signal—such as the polygraph test readings of respondents who are not being deceptive (Peterson, Birdsall, and Fox, 1954; Green and Swets, 1966). Developed for radar and sonar devices during and following World War II, signal detection theory has since been applied extensively in clinical medicine (now upward of 1,000 articles per year) and also in nondestructive testing, information retrieval, aptitude testing, weather forecasting, cockpit warning systems, product inspection, survey research, clinical psychology, and other settings (see Swets, 1996).
In the model of diagnosis that is provided by the theory, a diagnosis
|
BOX 2-1 Terms Relevant to Measuring the Accuracy of Polygraph Testing The table below shows the four possible combinations of actual truthfulness and polygraph test results. The text under the table defines terms that are used to describe the quantitative relationships among these outcomes.
Sensitivity—The proportion of truly positive (deceptive) cases that give positive results on the test (a/[a + c]). This is also known as the conditional probability of a true-positive test or the true-positive proportion. False negative probability—The proportion of truly positive cases that give negative results on the test (c/[a + c]). This quantity is the conditional probability of a false-negative test and is the complement of sensitivity (that is, the difference between sensitivity and 100 percent). Specificity—The proportion of truly negative (truthful) cases that give negative results on the test (d/[b + d]). This quantity is also known as the conditional probability of a true-negative test. False positive probability—The proportion of truly negative cases that give positive results on the test (b/[b + d]). This quantity is the conditional probability of a false-positive test and is the complement of specificity. Three terms use test results as a reference point and reveal how well the test results indicate the true conditions (see text for further discussion). Positive predictive value—The predictive value of a positive test, that is, the percentage of positive tests that are correct (a/[a + b]). Negative predictive value—The predictive value of a negative test, that is, the percentage of negative tests that are correct (d/[c + d]). False positive index—Number of false positives for each true positive (b/a). This is another way of conveying the information described by positive predictive value, in order to make clearer the tradeoffs between false positives and true positives. |
||||||||||||||||||||
depends on the degree of evidence favoring one or the other alternative. With a single diagnostic test, the raw score on the test is typically interpreted as indicating strength of evidence—for example, stronger differential responses to relevant questions on the polygraph are taken as stronger evidence of deception. A diagnostic decision is determined by how much positive evidence the diagnostician requires to make a positive diagnosis or how much negative evidence to make a negative diagnosis. This reasoning is the basis for the most common polygraph scoring systems, which base diagnostic decisions on numerical representations of the strength and consistency of physiological responses.
Degree of evidence can be represented along a decision axis as shown in the left panel of Figure 2-1. In general, greater amounts of positive evidence (higher eye pressure test scores, in this example) are associated with the presence of the underlying condition (the right-hand distribution, for glaucoma cases) than with its absence (the left-hand distribution, for healthy eyes). However, the two distributions overlap, and intermediate degrees of evidence are often interpreted as inconclusive. A diagnostician may use two cutoff points, as in the left panel of the figure (such as 10 and 40), and call the intermediate values inconclusive, or he or she may choose to make only a positive or negative decision, as based on a single cutoff point (e.g., 20, in the second panel of the figure). The choice of this particular cutoff point represents the judgment, common in medical diagnosis, that it is more important to avoid false negatives than to avoid false positives.
Accuracy and Decision Threshold
Signal detection theory distinguishes two independent features of a test that contribute to its diagnostic performance: (1) the accuracy of the test for the application being studied, which depends on the amount of overlap of the test score distributions when the target condition is present and absent (more accurate tests have less overlap), and (2) a measure of the decision threshold(s)—the cutoff point(s) along the decision or evidence axis—used by the diagnostician.
This distinction—and particularly the concept of decision threshold— deserves further explanation in relation to polygraph testing. The familiar scoring of each question comparison and each physiological response on a polygraph chart on a scale of +3 to –3 (Backster, 1963, 1973; Swinford, 1999) sets thresholds in the form of numerical scores (for example, sums of item scores) that must be attained for a chart to be considered conclusively indicating deception or nondeception. It is not always appreciated, however, that these thresholds are policy choices made by polygraph researchers or polygraph program managers. Thresholds could (and
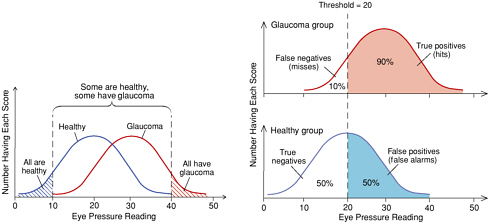
FIGURE 2-1 Distributions of eye pressure readings in a diagnostic test for glaucoma.
SOURCE: Swets, Dawes, and Monahan (2000). Copyright, John Swets; used by permission.
NOTE: The left panel shows the overlap between the distributions of eye pressures for people who are actually healthy and who actually have glaucoma. The right panel shows the same distributions (glaucoma above, healthy below) together with the consequences of using a pressure of 20 as a diagnostic threshold.
should) be set differently, depending on policy needs. (Considerations for setting thresholds are discussed below, “Selection of Decision Thresholds.”)
The concept of a decision threshold (and other concepts from signal detection theory) have been little used in the U.S. government-supported polygraph research, though they have been used for decades in other studies (see, e.g., Ben-Shakhar, Lieblich, and Kugelmass, 1970; Ben-Shakar, Lieblich, and Bar-Hillel, 1982; Hammond, Harvey, Jr., and Hastie, 1992; Swets, 1992, 1996:Chapter 5; Szucko and Kleinmuntz, 1981). The committee’s discussions with representatives of government agencies reveal little awareness of the concept in polygraph practice. There may indeed be some resistance to the idea that polygraph examiners can set various thresholds, perhaps because the idea makes the polygraph sound less scientific or objective. However, the need to set thresholds with diagnostic tests does not make them any less accurate or objective. Different thresholds simply reflect different tradeoffs between false positives and false negatives: for a test of any given level of accuracy, setting a threshold to decrease false negatives means accepting more false positives, and vice versa.
We have some concern that in practice, polygraph programs and examiners may ostensibly adhere to a given threshold—reflected by a mandated point on a scoring scale—while accomplishing the equivalent of varying the threshold in other ways, for instance, by altering the test conditions to affect the strength of the examinee’s autonomic response. That examiners can do so is reflected in their own claims to the committee about their ability to influence examinees’ physiological reactions and by the small worth typically assigned to a polygraph chart collected under circumstances friendly to an examinee. Test conditions may vary systematically according to such factors as expectancies of guilt about individuals and expected base rates of guilt in a population of examinees. If they do, and if different test conditions yield different physiological responses, the effect would be similar to varying the threshold—but less transparent and more difficult to control. The effect would be to undermine claims that the quality of polygraph examinations is sufficiently controlled that a polygraph test result has the same meaning across test formats, settings, and agencies.
As shown in the second panel of Figure 2-1, any given decision threshold will produce a certain proportion of true-positive decisions (equal to the shaded proportion of total area under the curve in the upper part of the panel, which represents examinees with the target condition present) and a certain proportion of false-positive decisions (similarly represented in the lower part of the panel). These two proportions vary together from 0 to 1 as the threshold is moved continuously
from a value at the extreme right of the decision axis (no tests diagnosed as positive) to a value at the very left of that axis (all tests diagnosed as positive). If truth is known, these proportions can be used to estimate two probabilities: the conditional probability of a positive test result given the presence of the target condition (this probability—90 percent in the figure—is known as the sensitivity of the test) and the conditional probability of a positive result given the absence of the condition (which is the complement of the test’s specificity—and is 50 percent in the figure). The second panel shows that the proportions of false negative and true negative results, respectively, are complements of the first two and add no additional information. They do not, therefore, require separate representation in a measure of accuracy.
Receiver Operating Characteristic (ROC)
Figure 2-2 presents a representative function that shows the true positive rate (percent of deceivers correctly identified) and the false positive rate (percent of nondeceivers falsely implicated) for a given separation of the distributions of scores for all possible choices of threshold. The curve would be higher for diagnostic techniques that provide greater separations of the distributions (i.e., have higher accuracy) and lower for techniques that provide lesser separations (i.e., have lower accuracy). Such a curve is called a receiver operating characteristic (ROC). The ROC of random guessing lies on the diagonal line. For example, imagine a system of guessing that randomly picks a particular proportion of cases (say, 80 percent) to be positive: this system would be correct in 80 percent of the cases in which the condition is present (80 percent sensitivity or true-positive probability), but it would be wrong in 80 percent of the actually negative cases (80 percent false-positive probability or 20 percent specificity). Any other guessing system would appear as a different point on the diagonal line. The ROC of a perfect diagnostic technique is a point (P) at the upper left corner of the graph, where the true positive proportion is 1.0 and the false positive proportion is 0.
Measure of Accuracy
The position of the ROC on the graph reflects the accuracy of the diagnostic test, independent of any decision threshold(s) that may be used. It covers all possible thresholds, with one point on the curve reflecting the performance of the diagnostic test for each possible threshold, expressed in terms of the proportions of true and false positive and negative results for each threshold. A convenient overall quantitative index of accuracy is the proportion of the unit area of the graph that lies under the
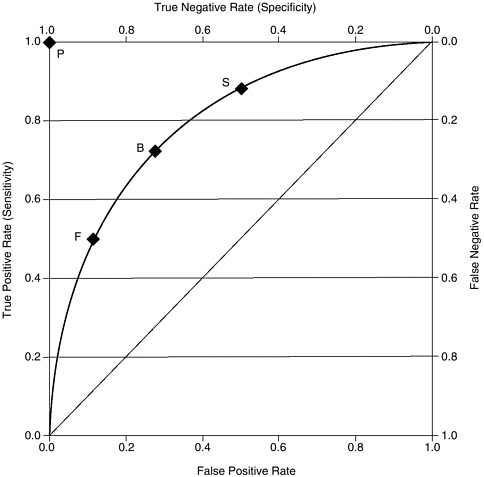
FIGURE 2-2 A representative plot of the receiver operating characteristic (ROC) curve for a diagnostic test with accuracy index (A) of 0.8, showing three threshold or cutoff values: F, a “friendly” threshold; B, a “balanced” threshold, with equal probabilities of false positive and false negative errors; and S, a “suspicious” threshold.
NOTE: The diagonal line represents an accuracy index of 0.50 (chance). The point P represents an accuracy index of 1.00.
ROC, as indicated in Figure 2-2. This area, denoted A, is the accuracy index used in this book.7 Its possible range is from 0.5 at the “chance” diagonal to 1.0 for perfection. Figure 2-3 shows the ROCs for three values of A, 0.7, 0.8, and 0.9, and for the chance diagonal (0.50), under the assumption that the distributions of evidence follow a particular (Gaussian) symmetric form. Higher values of A indicate tests with greater accuracy. The curves for such tests are above and to the left of those for less accurate
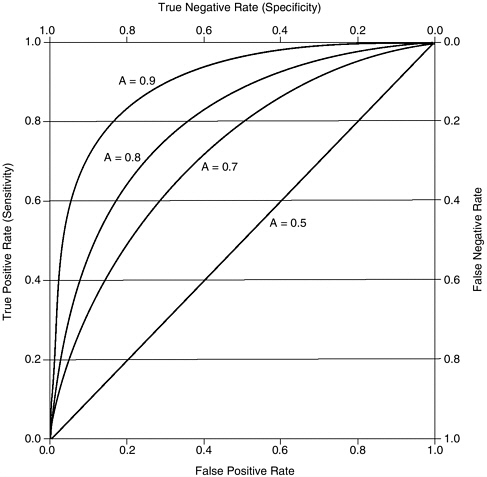
FIGURE 2-3 ROC curves representing accuracy index values (A) of 0.5, 0.7, 0.8, and 0.9.
tests. Reading across from the axis at the right of Figure 2-3 to the one at the left, one can see that for any fixed rate of correct identification of positive cases (sensitivity), the more accurate the test, the smaller the proportion of truly negative cases incorrectly judged positive, read from the axis at the bottom. Similarly, for any false positive rate, shown on the axis at the bottom of the figure, the more accurate the test, the greater the proportion of positive cases that are accurately identified.8
Decision Thresholds
Figure 2-2 shows three points corresponding to different thresholds on a curve with A = 0.8. The point B is the balanced threshold, meaning
that at this threshold, the test is equally accurate with examinees who are deceptive and those who are nondeceptive. With a threshold set at that point, 72.5 percent of the deceptive examinees and 72.5 percent of the nondeceptive examinees would (on average) be correctly identified in a population with any proportion of examinees who are being deceptive. (For the curves shown in Figure 2-3 with A = 0.9 and A = 0.7, the corresponding balanced thresholds achieve 81.8 and 66.0 percent correct identifications, respectively.) Points F and S in Figure 2-2 represent two other possible thresholds. At point F (for friendly), few are called deceptive: only 12 percent of those who are nondeceptive and 50 percent of those truly deceptive. At point S (for suspicious), many more people are called deceptive: the test catches 88 percent of the examinees who are being deceptive, but at the cost of falsely implicating 50 percent of those who are not.9
Selection of Decision Thresholds
Decision theory specifies that a rational diagnostician faced with a set of judgment calls will adopt a threshold or cutoff point for making the diagnostic decisions that minimizes the net costs of false positive and false negative decisions. If all benefits and costs could be measured and expressed in the same units, then this optimal threshold could be calculated for any ROC curve and base rate of target subjects (e.g., cases of deception) in the population being tested (see Chapter 6 and Appendix J for details). A goal of being correct when the positive outcome occurs (e.g., catching spies) suggests a suspicious cutoff like S; a goal of being correct when a negative outcome occurs (avoiding false alarms) suggests a friendly cutoff point like F.
The optimum decision threshold also depends on the probability, or base rate, of the target condition in the population or in the sample at hand—for security screening, this might refer to the proportion of spies or terrorists or potential spies or terrorists among those being screened. Because the costs depend on the number of deceptive individuals missed and the number of nondeceptive individuals falsely implicated (not just on the proportions), wanting to reduce the costs of errors implies that one should set a suspicious cutoff like S when the base rate is high and a friendly cutoff like F when the base rate is low. With a low base rate, such as 1 in 1,000, almost all the errors will occur with truly negative cases (that is, they will be false positives). These errors are greatly reduced in number by using a friendly cutoff that calls fewer test results positive. With a high base rate, such as 8 in 10, most of the errors are likely to be false negatives, and these are reduced by setting a suspicious threshold. Thus, it makes sense to make a positive decision fairly frequently in a referral or
adjudication setting, when other evidence indicates that the likelihood of a true positive outcome is high, because any set percentage of false positive errors will cost less when there are few negative cases to get wrong. In a screening setting, when the base rate of truly positive cases is low, a suspicious cutoff like S will lead to a very large number of false positives.
It is important to note here that accuracy and decision thresholds have very different practical implications depending on the base rate of the target population being tested. A test that may be acceptable for use on a population with a high base rate of deceivers (e.g., criminal suspects) may look much less attractive for use with a low base-rate population (e.g., employees in a nuclear weapons laboratory, because of the inherent properties of accuracy and thresholds.) This generalization, which holds true for all diagnostic techniques, is illustrated in Table 2-1 for a test with an accuracy of A = 0.90 and deceivers in two base rates of deception (see Chapter 6 for more detailed discussion). Table 2-1A shows the results of using this test with a threshold that correctly identifies 80 percent of deceivers on two hypothetical populations. In a population of 10,000 criminal suspects of whom 5,000 are expected to be guilty, the test will identify 4,800 examinees (on average) as deceptive, of whom 4,000 would actually be guilty. The same test, used to screen 10,000 government employees of whom 10 are expected to be spies, will identify an average of 1,606 as deceptive, of whom only 8 would actually be spies. Table 2-1B and Table 2-1C show that the high number of false positives in the screening situation can be reduced by changing the threshold, but the result is that more of the spies will get through the screen.
Empirical Variation in Decision Threshold
As already noted, polygraph examiners may vary considerably in the decision thresholds they apply. A study by Szucko and Kleinmuntz (1981) gives an idea of the variation in threshold that can occur across experienced polygraph interpreters under controlled conditions. In their mock crime study, six interpreters viewed the physiological data (the charts) of 30 individuals (15 guilty and 15 innocent) and made judgments on an eight-category scale of their confidence that a given subject was guilty or not. The eight-category scale allows for seven possible thresholds for dividing the charts into groups judged truthful or deceptive. An indication of the results of using different decision thresholds among polygraph interpreters is the false positive proportions that would result if each interpreter had set the threshold at the fifth of the seven possible thresholds and had made yes/no, binary judgments at that cutoff. Then the proportion of false positives would have varied across interpreters by almost 0.50—from 0.27 for the most conservative interpreter to 0.76 for
TABLE 2-1 Results of a Diagnostic Test of Deception of Accuracy (A) = 0.90, with Hypothetical Populations of 10,000 Examinees with Base Rates of Deception of 1 in 2 and 1 in 1,000
|
2-1A Sensitivity of 80 percent (i.e., threshold set to correctly identify 80 percent of deceivers) |
||||||
|
|
Criminal Suspects (Base Rate: 1 guilty of 2) |
National Laboratory Employees (Base Rate: 1 spy of 1,000) |
||||
|
Result |
Guilty |
Not Guilty |
Total |
Spy |
Not Spy |
Total |
|
“Failed” test |
4,000 |
800 |
4,800 |
8 |
1,598 |
1,606 |
|
“Passed” test |
1,000 |
4,200 |
5,200 |
2 |
8,392 |
8,394 |
|
Total |
5,000 |
5,000 |
10,000 |
10 |
9,990 |
10,000 |
|
2-1B Sensitivity of 50 percent (i.e., threshold set to correctly identify 50 percent of deceivers) |
||||||
|
|
Criminal Suspects (Base Rate: 1 guilty of 2) |
National Laboratory Employees (Base Rate: 1 spy of 1,000) |
||||
|
Result |
Guilty |
Not Guilty |
Total |
Spy |
Not Spy |
Total |
|
“Failed” test |
2,500 |
170 |
2,670 |
5 |
340 |
345 |
|
“Passed” test |
2,500 |
4,830 |
7,330 |
5 |
9,650 |
9,655 |
|
Total |
5,000 |
5,000 |
10,000 |
10 |
9,990 |
10,000 |
|
2-1C Sensitivity of 20 percent (i.e., threshold set to correctly identify 20 percent of deceivers) |
||||||
|
|
Criminal Suspects (Base Rate: 1 guilty of 2) |
National Laboratory Employees (Base Rate: 1 spy of 1,000) |
||||
|
Result |
Guilty |
Not Guilty |
Total |
Spy |
Not Spy |
Total |
|
“Failed” test |
1,000 |
19 |
1,019 |
2 |
39 |
41 |
|
“Passed” test |
4,000 |
4,981 |
8,981 |
8 |
9,951 |
9,959 |
|
Total |
5,000 |
5,000 |
10,000 |
10 |
9,990 |
10,000 |
the most liberal. Other possible thresholds would also have yielded substantial differences among interpreters in false-positive rates.
Producing an Empirical ROC Curve
It is possible to produce an empirical ROC curve on the basis of the performance of a diagnostic test in a field or laboratory setting. This can be accomplished in a few different ways. An efficient way is for the diagnostician to set several thresholds at once, in effect to use several categories of response, say, five or six categories ranging from “very definitely a signal” to “very definitely only noise.” Points on the ROC curve are then calculated successively from each category boundary: first, considering only the top category positive and the rest negative; then considering the top two categories positive, and so on. This rating procedure can be expanded to have the diagnostician give probabilities from 0 to 1 (to two decimal places) that a signal is present. The 100 categories implied may then be used as is or condensed in analysis to perhaps 10, which would give nine ROC points to be fitted into a curve (the first point is always [0.0, 0.0], the point at which all tests are considered negative; the final point is always [1.0, 1.0], the point where all tests are considered positive). An example of this rating procedure is the use of three categories, corresponding to yes/no/inconclusive decisions in many polygraph diagnostic systems. Treating this three-alternative scoring system as a rating procedure gives a two-point ROC curve.10 Because of the way polygraph data are most commonly reported, our analyses in Chapter 5 draw heavily on two-point ROC curves obtained when “no-opinion” or “inconclusive” judgments are reported.
Using the Percent Correct to Measure Accuracy
Treating no-opinion or inconclusive judgments as an intermediate category and estimating two ROC points handles neatly a problem that is not dealt with when percent correct is used to estimate accuracy. In that case, reported performance depends on how often given examiners use the inconclusive category, especially if examiners treat the “inconclusive” records, which are the ones they find most difficult to score, as if the subject had not been tested. Examiners vary considerably in how frequently their records are scored inconclusive. For example, nine datasets reported in four screening studies completed between 1989 and 1997 at the U.S. Department of Defense Polygraph Institute showed rates of no-opinion judgments ranging from 0 to 50 percent (materials presented to the committee, March 2001). By using the inconclusive category liberally and excluding inconclusive tests, an examiner can appear very accurate
as measured by percent correct. For a measure of accuracy to be useful for comparing examiners, studies, or test techniques, it should not be affected by the number of inconclusive judgments an examiner chooses to give; however, percent correct is so affected. By contrast, the A measure is robust against varying uses of the inconclusive category of result.
Percent correct has three other difficulties that preclude our adoption of this widely used measure (see Swets, 1986a, 1996:Chapter 3). First, it depends heavily on the proportions of positive and negative cases (the base rates) in the population. This requirement poses acute difficulties in security screening applications, in which the base rates of activities such as espionage and sabotage are quite low: assuming that no one is being deceptive yields an almost perfect percent correct (the only errors are the spies). Second, the percent correct varies extensively with the diagnostician’s decision threshold. The examples in Table 2-1 show these two difficulties concretely. When the base rate of guilt is 50 percent, the hypothetical polygraph test, which has an accuracy index of A = 0.90, makes 82, 73, and 60 percent correct classifications with the three thresholds given. When the base rate of guilt is 0.1 percent, it makes 84, 97, and 99.5 percent correct classifications with the same three thresholds. Finally, as a single-number index, the percent correct does not distinguish between the two types of error—false positives and false negatives—which are likely to have very different consequences. The problems with percent correct as an index of accuracy are best seen in the situation shown in the right half of Table 2-1c, in which the test is correct in 9,959 of 10,000 cases (99.5 percent correct), but eight out the ten hypothetical spies “pass” and are free to cause damage.
When percentages of correct diagnoses are calculated separately for positive and negative cases, there are two numbers to cope with, or four numbers when no-opinion judgments are included. Because these are not combined into a single-number index, it is difficult to offer a simple summary measure of accuracy for a single study or to order studies or testing techniques in terms of their relative accuracy. The difficulty of interpreting percent correct when inconclusive judgments vary haphazardly from one study to another is multiplied when two percentages are affected.
Accuracy Measures Used in This Study
For the reasons discussed in this section, we used the A index from signal detection theory to estimate the accuracy of polygraph testing. We calculated empirical ROC curves from data contained in those studies that met basic criteria of methodological adequacy and that also provided sufficient information about polygraph test results to make the calcula-
tion. Chapter 5 and Appendixes G and H report on the methods we used to select the studies and make the calculations and discusses the results.
VALIDITY AND UTILITY
The practical value of polygraph testing depends on at least five conceptually different factors that are often not distinguished:
-
The ability to detect deception from polygraph charts—by analyzing the data collected by polygraph instruments (i.e., psychophysiological detection of deception).
-
The ability of an examiner to detect deception by using other cues in the polygraph examination (what can be called detection of deception from demeanor).
-
The deterrent effect of a screening procedure that potential examinees believe can detect their deception or falsely identify them as deceptive.
-
The ability of the procedure to elicit admissions or confessions because of any of the above factors.
-
The ability of the procedure to foster public confidence in law enforcement and national security.
The first of these corresponds to the validity of polygraph testing. The others, particularly the last three, relate to what can be termed the utility of polygraph testing.11
It is important to recognize that none of these five elements is unique to polygraph testing. Any interrogation technique that includes physiological measures may combine all of them; traditional investigative techniques that do not use physiological measures often combine all the others. It has been argued, however, that adding a credible physiological measure to an interrogation procedure increases utility not only because of the validity of the physiological test but also by enhancing the other elements. To evaluate polygraph testing for practical purposes, one must therefore consider not only its validity (normally defined in terms of the physiological test), but also its effects on other elements of the interrogation procedure.
What is unique to psychophysiological testing and not common to all interrogation techniques—and what is central to our investigation of its validity—is the capability for the detection of deception that comes from the physiological data collected and the way those data are analyzed. Although the polygraph may enhance the utility of interrogation in ways that are unrelated to its validity, such benefits would be shared equally by any other adjunct to interrogation that was applied similarly and that had
other characteristics now associated with polygraph testing. For example, any other technique that potential examinees believed to be valid for detecting deception would be likely to elicit admissions and to have deterrent effects. Even a technique that examinees believed to be invalid but that they also believed would be treated as valid might bring some benefits of deterrence.
Psychophysiological Detection of Deception
The term validity, when applied to polygraph testing, normally refers only to the psychophysiological test. That is, the polygraph is said to be valid only if deception is strongly and uniquely associated with a discernable pattern in the record of physiological responses made on or from the polygraph. Chapter 3 discusses the scientific basis for believing that deception produces specific psychological and physiological processes that influence polygraph readings, which indicates the construct validity of the polygraph test. Chapters 4 and 5 discuss the evidence on the empirical association between deception and polygraph test results, which indicates the accuracy of the polygraph. As noted above, the utility of the polygraph depends on more than just its validity, but these utility aspects should be considered separately from the issue of validity of the instrument for measuring deception.
Detection of Deception from Demeanor
It is possible to assess the ability of interviewers to detect deception from visible and audible cues in the interview, generally referred to as demeanor (e.g., facial expression, posture, voice quality). Considerable scientific effort has been devoted to the development of techniques for detecting deception from such behavioral indicators. Although this is not a major focus of the present study, we discuss the research evidence on this detection briefly in Chapter 6. In the context of evaluating the validity of the polygraph instrument, it is necessary to exclude the possibility that the examiner’s judgment was affected in part by the examinee’s demeanor, since that is not what the polygraph instrument measures. This can be done in part by evaluating the performance of polygraph assessments made by computer programs or by trained examiners who have access only to the record of physiological responses. If examiners who actually interviewed the subject make the same judgments as result from these other methods, their assessments are unlikely to have been affected directly by the examinee’s demeanor.12
Deterrent Effect
When polygraph testing is used for screening, one of its goals is deterrence: keeping people who have done or may do certain undesired things out of sensitive positions and keeping people already in sensitive positions from doing undesired things. Deterrence is distinct from the validity of polygraph testing because the polygraph can be an effective deterrent even if it does not provide valid information about deception. (An analogy would be the possible deterrent effect on burglars of a bogus window sticker saying that a house is protected by an alarm system.) In fact, it can be an effective deterrent even without being used. Individuals who are security risks may: (a) choose not to seek positions for which a polygraph examination is required; (b) decide not to engage in serious transgressions if they know they may undergo a polygraph examination; or (c) resign (and thus minimize the duration of acts of sabotage or espionage) if they are facing a polygraph examination. In addition, people in sensitive positions may take greater care to avoid even minor security infractions in order to avoid the possibility of a future deceptive reading on a polygraph test.
The committee heard numerous anecdotes of the deterrent value of policies of polygraph examination. For instance, we were told that John Anthony Walker, the retired Naval officer who pleaded guilty in 1985 to spying for the Soviet Union, was told by his handlers not to engage in espionage until he was promoted to the highest position in which a polygraph examination was not required, then to engage in espionage, to refuse promotion to a position in which a polygraph exam was required, and to retire when promotion to such a position was mandated. Notwithstanding such anecdotes, some observers have questioned the value of the polygraph as a deterrent (see, e.g., Aftergood, 2000).
Direct scientific research on the deterrent value of polygraph testing in any setting is lacking. However, research on social influence through surveillance or power (McGuire, 1969) is consistent with the underlying reasoning that the threat of polygraph testing might deter actions that threaten national interests if the perceived likelihood and consequences of detection by polygraph assessment are substantial. The logic is the same as that which applies to the use of radar speed traps as deterrents. Frequent and unpredictable use of radar increases the likelihood that a violator will be caught, and substantial consequences for detected speeders increase the expected cost for a potential violator. Following the same reasoning, predictable polygraph testing (e.g., fixed-interval testing of people in specific job classifications) probably has less deterrent value than random testing. Similar effects have been observed in research on the use of employee drug tests (National Research Council, 1994). In the
U.S. armed services, for example, the introduction of random and frequent drug testing has been associated with lower levels of drug use.
Deterrence effects depend on beliefs about the polygraph, which are logically distinct from the validity of the polygraph. The deterrent value of polygraph testing is likely to be greater for individuals who believe than who do not believe in its validity for detecting deception.
It is worth noting that deterrence has costs as well as benefits for an organization that uses polygraph testing. The threat of polygraph testing may lead desirable job candidates to forgo applying or good employees to resign for fear of suffering the consequences of a false positive polygraph result. The more accurate people believe the test to be—independent of its actual validity—the greater the benefits of deterrence relative to the costs. This is because a test that is believed to be highly accurate in discriminating deception from truthfulness will be more deterring to people whose actions might require deception and more reassuring to others who would be truthful than a test that is believed to be only moderately accurate.
It is also worth emphasizing that validity and utility for deterrence, while logically separable, are related in practice. The utility of the polygraph depends on the beliefs about validity and about how results will be used among those who may be subject to testing. Utility increases to the extent that people believe the polygraph is a valid measure of deception and that deceptive readings will have severe negative consequences. To the extent people hold these beliefs, they are deterred from engaging in behaviors they believe the polygraph might detect. If people came to have an equal or greater level of faith in some other technique for the physiological detection of deception, it would acquire a deterrent value equal to or greater than that now pertaining to polygraph testing.
Eliciting Admissions and Confessions
Polygraph testing is used to facilitate interrogation (Davis, 1961). Polygraph proponents believe that individuals are more likely to disclose information about behaviors that will lead to their punishment or loss of a valued outcome if they believe that any attempts to conceal the information will fail. As part of the polygraph pretest interview, examinees are encouraged to disclose any such information so that they will “pass” the examination. It can be important to security organizations to have their employees admit to past or current transgressions that might not disqualify them from employment but that might be used against them, for example, by an enemy who might use the threat of reporting the transgression to blackmail the employee into spying. Anecdotes suggest that the polygraph context is effective for securing such admissions. As re-
ported by the U.S. Department of Defense (DoD) Polygraph Program (2000:4 of 14) on the cases in which significant information was uncovered during DoD counterintelligence-scope polygraph examinations covered in the report:
It should be noted that all these individuals had been interviewed previously by security professionals and investigated by other means without any discovery of the information obtained by the polygraph examination procedure. In most cases, the information was elicited from the subject in discussion with the examiner [italics added].
There is no scientific evidence on the ability of the polygraph to elicit admissions and confessions in the field. However, anecdotal reports of the ability of the polygraph to elicit confessions are consistent with research on the “bogus pipeline” technique (Jones and Sigall, 1971; Quigley-Fernandez and Tedeschi, 1978; Tourangeau, Smith, and Rasinski, 1997). In bogus pipeline experiments, examinees are connected to a series of wires that are in turn connected to a machine that is described as a lie detector but that is in fact nonfunctional. The examinees are more likely to admit embarrassing beliefs and facts than similar examinees not connected to the bogus lie detector. For example, in one study in which student research subjects were given information in advance on how to respond to a classroom test, 13 of 20 (65 percent) admitted receiving this information when connected to the bogus pipeline, compared to only 1 of 20 (5 percent) who admitted it when questioned without being connected (Quigley-Fernandez and Tedeschi, 1978).
Admissions during polygraph testing of acts that had not previously been disclosed are often presented as evidence of the utility and validity of polygraph testing. However, the bogus pipeline research demonstrates that whatever they contribute to utility, they are not necessarily evidence of the validity of the polygraph. Many admissions do not depend on validity, but rather on examinees’ beliefs that the polygraph will reveal any deceptions. All admissions that occur during the pretest interview probably fall into this category. The only admissions that can clearly be attributed to the validity of polygraph are those that occur in the posttest interview in response to the examiner’s probing questions about segments of the polygraph record that correctly indicated deception. We know of no data that would allow us to estimate what proportion of admissions in field situations fall within this category.
Even admissions in response to questions about a polygraph chart may sometimes be attributable to factors other than accurate psychophysiological detection of deception. For example, an examiner may probe a significant response to a question about one act, such as revealing classified information to an unauthorized person, and secure an admission of a
different act investigated by the polygraph test, such as having undisclosed contact with a foreign national. Although the polygraph test may have been instrumental in securing the admission, the admission’s relevance to test validity is questionable. To count the admission as evidence of validity would require an empirically supported theory that could explain why the polygraph record indicated deception to the question on which the examinee was apparently nondeceptive, but not to the question on which there was deception.
There is also a possibility that some of the admissions and confessions elicited by interrogation concerning deceptive-looking polygraph responses are false. False confessions are more common than sometimes believed, and standard interrogation techniques designed to elicit confessions—including the use of false claims that the investigators have definitive evidence of the examinee’s guilt—do elicit false confessions (Kassin, 1997, 1998). There is some evidence that interrogation focused on a false-positive polygraph response can lead to false confessions. In one study, 17 percent of respondents who were shown their strong response on a bogus polygraph to a question about a minor theft they did not commit subsequently admitted the theft (Meyer and Youngjohn, 1991).
As with deterrence, the value of the polygraph in eliciting true admissions and confessions is largely a function of an examinee’s belief that attempts to deceive will be detected and will have high costs. It likely also depends on an examinee’s belief about what will be done with a “deceptive” test result in the absence of an admission. Such beliefs are not necessarily dependent on the validity of the test.
Thus, admissions and confessions in the polygraph examination, as important as they can be to investigators, provide support for claims of validity only in very limited circumstances. Admissions can even adversely affect the assessment of validity in field settings because in field settings an admission is typically the end of assessment of the polygraph— even if interrogation and investigation continue. The polygraph examination is concluded to have been productive. In our efforts to secure data from federal agencies about the specific circumstances of admissions secured during security screening polygraph examinations, we have learned that agencies do not classify admissions according to when in the examination those admissions occurred. This practice makes it impossible to assess the validity of federal polygraph screening programs from the data those programs provide. Polygraph examinations that yield admissions may well have utility, but they cannot provide evidence of validity unless the circumstances of the admission are taken into account and unless the veracity of the admission itself is independently confirmed. Using the polygraph record to confirm an admission that was elicited because of the polygraph record does not count as independent confirmation.
Fostering Public Confidence
Another purpose of the polygraph is to foster public confidence in national security. Public trust is obviously challenged by the revelation that agents acting on behalf of foreign interests occupy sensitive positions in the U.S. government. Counterintelligence necessarily includes programs that are secret. Because these programs’ responses to revelations of spying cannot be made public, they do little to reassure the public of the integrity of U.S. national security procedures. Calls for increased polygraph testing appear to us to be intended in part to reassure the public that all that can be done is being done to protect national security interests. To the extent that the public believes in the polygraph, attribution theory (Jones, 1991) suggests it may serve this function. We know of no scientific evidence to assess the net effect of polygraph screening policies on public confidence in national security or security organizations. We note that as with the value of the polygraph for deterrence and for eliciting admissions and confessions, its value for building confidence depends on people’s beliefs about its validity and only indirectly on its proven validity.
Public confidence in the polygraph that goes beyond what is justified by evidence of its validity may be destructive to public purposes. An erroneously high degree of belief in validity can create a false sense of security among policy makers, among employees in sensitive positions, and in the general public. This false sense of security can in turn lead to inappropriate relaxation of other methods of ensuring security. In particular, the committee has heard suggestions that employees may be less vigilant about potential security violations by coworkers in facilities in which all employees must take polygraph tests. Some agencies permit new hires who have passed a polygraph but for which the background investigation is not yet complete to have the same access to classified material as other employees with no additional security precautions.
Implications for Assessing Validity of Polygraph Testing
The detection of deception from demeanor, deterrence, and effects on public confidence may all contribute to the utility of polygraph testing. These effects do not, however, provide evidence of the validity of the polygraph for the physiological detection of deception. Rather, those effects depend on people’s beliefs about validity. Admissions and confessions, as noted above, provide evidence supportive of the validity of polygraph tests only under very restricted conditions, and the federal agencies that use the polygraph for screening do not collect data on admissions and confessions in a form that allows these field tests to be used to assess polygraph validity. Moreover, even with data on when in the examina-
tion admissions or confessions occurred and on whether the admitted acts corresponded to significant responses to relevant questions about those specific acts, information from current field screening examinations would have limited value for assessing validity because of the need for independent validation of the admissions and confessions.
There is in fact no direct scientific evidence assessing the value of the polygraph as a deterrent, as a way to elicit admissions and confessions, or as a means of supporting public confidence. What indirect scientific evidence exists does support the plausibility of these uses, however. This evidence implies that for the polygraph or any other physiological technique to achieve maximal utility, examinees and the public must perceive that there is a high likelihood of deception being detected and that the costs of being judged deceptive are substantial. If people do not have these beliefs, then the value of the technique as a deterrent, as an aid to interrogation, and for building public confidence, is greatly diminished. Indeed, if the public does not believe a technique such as the polygraph is valid, using it to help reinstate public trust after a highly visible security breach may be counterproductive.
Regardless of people’s current beliefs about validity, if polygraph testing is not in fact highly accurate in distinguishing truthful from deceptive responses, the argument for utility diminishes in force. Convincing arguments could then be made that (a) polygraphs provide a false sense of security, (b) the time and resources spent on the polygraph would be better spent developing alternative procedures, (c) competent or highly skilled individuals would be or are being lost due to suspicions cast on them by erroneous decisions based on polygraph tests, (d) agencies that use polygraphs are infringing civil liberties for insufficient benefits to the national security, and (e) utility will decrease rapidly over time as people come to appreciate the low validity of polygraph testing. Polygraph opponents already make such arguments.
The utility benefits claimed for the polygraph, even though many of them are logically independent of its validity, depend indirectly on the polygraph being a highly valid indicator of deception. In the long run, evidence that supports validity can only increase the polygraph test’s utility and evidence against validity can only decrease utility. The scientific evidence for the ability of the polygraph test to detect deception is therefore crucial to the test’s usefulness. The evidence on validity is discussed in Chapters 3, 4, and 5.
CRITERION VALIDITY AS VALUE ADDED
For the polygraph test to be considered a valid indicator of deception, it must perform better against an appropriate criterion of truth than do
indicators that have no validity. That is, it must add predictive value. It is therefore necessary to define the nonvalid indicators that serve as points of comparison.13
One possible reference point is the level of performance that would be achieved by random guessing about the examinee’s truthfulness or deceptiveness on the relevant questions. In this comparison, the predictive validity of the polygraph test is the difference between its predictive value and that of random guessing. This reference point provides a minimal comparison that we consider too lenient for most practical uses, and particularly for employee screening applications. For the polygraph to have sufficient validity to be of more than academic interest, it must do considerably better than random guessing.
A second possible reference point is the extent to which deception is accurately detected by other techniques normally used in the same investigations as the polygraph (background checks, questionnaires, etc.). Comparisons of the incremental validity (Fiedler, Schmid, and Stahl, in press) of the polygraph consider the improvement provided by the polygraph over other methods of investigation (e.g., background checks). We consider this reference point to be important for making policy decisions about whether to use the polygraph (see Chapter 7), but not for judging validity. The scientific validity of the polygraph is unaffected by whether or not other techniques provide the same information.
A third possible reference point for the validity of polygraph testing is a comparison condition that differs from the polygraph examination only in the absence of the chart data, which is purportedly the source of the valid physiological detection of deception in the polygraph examination. This logic implies a comparison similar to the placebo control condition in medical research. The reference point is an experimental treatment condition that is exactly the same as the one being investigated, except for its active ingredient. For the polygraph, that would mean a test that both the examiner and examinee believed yielded valid detection of deception, but that in fact did not. Polygraph research does not normally use such comparisons, but it could. Doing so would help determine the extent to which the effectiveness of the polygraph is attributable to its validity, as distinct from other features of the polygraph examination, such as beliefs about its validity.
Bogus pipeline research illustrates what might be involved in assessing validity of the polygraph using an experimental condition analogous to a placebo. An actual polygraph test might be compared with a bogus pipeline test in which the examinee is connected to polygraph equipment that, unbeknownst both to examiners and examinees, produced charts that were not the examinee’s (perhaps the chart of a second examinee whose actual polygraph is being read as the comparison to the bogus
one). The polygraph’s validity would be indicated by the degree to which it uncovered truth more accurately than the bogus pipeline comparison. Such a comparison might be particularly useful for examining issues of utility, such as the claimed ability of the polygraph to elicit admissions and confessions. These admissions and confessions might be appropriately attributed to the validity of the polygraph if it produced more true admissions and confessions than a bogus pipeline comparison condition. However, if similar proportions of deceptive individuals could be induced to admit transgressions when connected to an inert machine as when connected to a polygraph, their admissions could not be counted as evidence of the validity of the polygraph.
We believe that such a comparison condition is an appropriate reference point for judging the validity of polygraph testing, especially as that validity contributes to admissions and confessions during the polygraph interview. However, we have found no research attempting to assess polygraph validity by making this kind of comparison. This gap in knowledge may not present a serious threat to the quality of laboratory-based polygraph research, in which examinees normally do not admit their mock crimes, but it is important for making judgments about whether research on polygraph use under field conditions provides convincing evidence of criterion validity.
CONCLUSIONS
Validity and Utility
-
The appropriate criteria for judging the validity of a polygraph test are different for event-specific and for employee or preemployment screening applications. The practical value of a polygraph testing and scoring system with any given level of accuracy also depends on the application because in these different applications, false positive and false negative errors differ both in frequency and in cost.
-
No clear consensus exists on what polygraphs are intended to measure in the context of federal employee security screening.
-
Evidence of the utility of polygraph testing, such as its possible effects of deterring potential spies from employment or increasing the frequency of admissions of target activities, is relevant to polygraph validity only under very restricted circumstances. This is true in part because any technique that examinees believe to be a valid test of deception is likely to produce deterrence and admissions, whether or not it is in fact valid.
-
The federal agencies that use the polygraph for screening do not collect data on admissions and confessions in a form that allows these field tests to be used to assess polygraph validity.
-
There is no direct scientific evidence assessing the value of the polygraph as a deterrent, as a way to elicit admissions and confessions, or as a means of supporting public confidence. The limited scientific evidence does support the idea that these effects will occur when examinees (and the public) perceive that there is a high likelihood of deception being detected and that the costs of being judged deceptive are substantial.
Measurement of Accuracy
-
For the purposes of assessing accuracy, or criterion validity, it is appropriate to treat the polygraph as a diagnostic test and to apply scientific methods based on the theory of signal detection that have been developed for measuring the accuracy of such tests.
-
Diagnostic test performance depends on both the accuracy of the test, which is an attribute of the test itself, and the threshold value selected for declaring a test result positive.
-
There is little awareness in the polygraph literature and less in U.S. polygraph practice of the concept that false positives can be traded off against false negatives by adjusting the threshold for declaring that a chart indicates deception. We have seen indications that practitioners implicitly adjust thresholds to reflect perceived organizational priorities, but may not be fully aware of doing so. Explicit awareness of the concept of the threshold and appropriate policies for adjusting it to reflect the costs of different kinds of error would eliminate a major source of uncontrolled variation in polygraph test results.
-
The accuracy of the polygraph is appropriately summarized by the accuracy index A, as defined in the theory of signal detection. To estimate the accuracy of the polygraph, it is appropriate to calculate values for this index for the validation studies that meet standards of scientific acceptability and to consider whether these values are systematically related to other factors, such as populations of examinees, characteristics of individual examinees or examiners, relationships established in the interview, testing methods, and the use of countermeasures.
NOTES
|
|
equal variances per se, as measures of accuracy they share the same “symmetric” features of d’. A second class of standard measures of association, which do depend on marginal totals, are functions of the correlation coefficient; they include Cohen’s kappa and measures derived from the Chi-square coefficient, such as the Phi, or four-fold point, coefficient. Like the “percentage correct” index, these measures vary with the base rate of positive cases in the study sample and with the diagnostician’s decision threshold, in a way that is evident only when their ROCs are derived. Their ROCs are not widely known inasmuch as the measures were designed for single 2-by-2 or 2-by-3 tables, rather than for the 2-by-n table that represents the multiple possible thresholds used in estimating an ROC. However, these measures can be shown to predict an ROC of irregular form—one that is not concave downward or that intersects the ROC axes at places other than the (0.0, 0.0) and (1.0, 1.0) corners. Moreover, some of these latter measures were developed to determine statistical significance relative to hypotheses of no relationship, and they lack cogency for assessing degree of accuracy or effect size. Several of these alternative statistics have been analyzed and their theoretical ROCs compared with a broad sample of observed ROCs (Swets, 1986a, 1986b); the two classes of association statistics are discussed by Bishop, Fienberg, and Holland (1975). |
|
8. |
The accuracy index (A) is equal to the proportion of correct signal identifications that would be made by a diagnostician confronted repeatedly by pairs of random test results, one of which was drawn from the signal category and one from the noise category. For example, a decision maker repeatedly faced with two examinees, one of whom is truthful, will make the correct choice 8 out of 10 times by using a test with A = 0.8. In other situations, A does not translate easily to percent correct. Under a great many assumptions about test situations that are realistic in certain applications, the percent correct is quite different from A, as is illustrated in Table 2-1. (The measure A is applied to diagnostic performance in several fields; see Swets, [1988, 1996:Chapter 4].) |
|
9. |
A conventional way of representing decision thresholds quantitatively is as the slope of the tangent to the ROC curve drawn at the cutoff point that defines the threshold. It can be shown that this slope is equal to the ratio of the height of the signal distribution to the height of the noise distribution (the “likelihood ratio”) at that threshold (see representations in Figure 2-1). At point F in Figure 2-2, this slope is 2, at point B it is 1, and at point S it is 1/2 (Swets, 1992, 1996:Ch. 5). |
|
10. |
Computer software exists to give maximum-likelihood fits to empirical ROC points (e.g., Metz, 1986, 1989, 2002; Swets, 1996). There are two common approaches: to draw straight line segments interpolating between estimated ROC points and the lower left and upper right corners of the plotting square; or to assume a curved form that follows from underlying distributions of the measure of evidence that are normal (Gaussian), often with arbitrary variances but sometimes with these assumed equal, and to use maximum likelihood estimation. In either case, A is determined as the area under the estimated ROC; standard errors and confidence bounds for A may also be computed. These methods have technical limitations when used on relatively small samples, but they are adequate to the level of accuracy needed here. |
|
11. |
A different distinction between validity and utility is made in some writings on diagnostic testing (Cronbach and Gleser, 1965; Schmidt et al., 1979). That distinction concerns the practical value of a test with a given degree of accuracy in particular decision-making contexts, such as screening populations with low base rates of the target condition. We address these issues in this report (particularly in Chapter 7), but do not apply the term “utility” in that context. Our usage of “utility” in discussing the polygraph follows the usage of the term by polygraph practitioners. |


