
SCIENCE AND ENGINEERING IN MATERIALS ACTIVITIES
Nature and Style of Materials Science and Engineering
In its two decades as a discernibly evolving field, materials science and engineering has reflected growing awareness of the central role of materials in society and has experienced increasingly stringent demands imposed on materials by complex technologies. The significance of the field has been reinforced in the past few years by public concern over the quality of the environment and the availability of natural resources.
Activities in materials science and engineering typically range from basic, curiosity-motivated research to applications-directed development. In its most ambitious reaches, the field relates fundamental understanding of the behavior of electrons, atoms, and molecules to the performance of devices, machines, and structures. It links basic research to the solution of practical problems. At the same time, materials scientists and engineers rely heavily on empirical (experienced-based) knowledge. One instance is the management of the pervasive problem of stress-corrosion cracking, which, for example, can cause catastrophic failure in vessels and piping in the electric-power and other industries. This complex problem is still inadequately understood in fundamental terms. Often it can be avoided, nevertheless, by the use of experience-based knowledge in materials selection and design.
The application of basic and empirical knowledge to function is exemplified by the transistor. The device grew out of a practical need, foreseen in the mid-1930’s, to bypass certain intrinsic limitations
of vacuum tubes and relays in communication systems. Various approaches to the problem were examined and abandoned. The search narrowed eventually to solid materials, where a few scientists settled on a hunch that the answer lay in semiconductors. To move from the hunch to the transistor, however, required intensive basic research on the behavior of semiconducting materials. It required also the semiempirical development of zone refining and other techniques to make virtually perfect single crystals of silicon of unprecedented purity.
This close linkage of knowledge to function is characteristic of the achievements of materials science and engineering. Selected examples appear in Table 2. A second characteristic of the field is that the initiative for new materials developments, and for the attendant basic research, springs most often from a practical problem, however dimly perceived. It is true that fundamental work on materials has turned up unexpected, momentous discoveries, such as high-field super-conductors. But more frequently, the basic studies have been stimulated by a discovery or invention whose exploitation required greatly expanded fundamental research. Thus the tunnel diode and the laser largely preceded and spurred the extensive basic work on the tunnel and laser effects in materials.
Multidisciplinarity and Interdisciplinarity
The bodies of knowledge required for progress in materials, and particularly for solving complex technological problems, often do not coincide with those of the traditional disciplines. Materials science and engineering, as a result, has come to embrace a number of traditional disciplines and segments of disciplines (Figure 7), and
TABLE 2
Selected Achievements in Materials Science and Engineering
|
Examples of Applications |
Material or Process |
Basic Research |
|
Transistor, integrated circuits, tunnel diodes, impatt diodes, charge-coupled devices. |
Zone refining, float-zone crystal growth, controlled doping in Czochralski growth, epitaxial growth, controlled alloying, diffusion, oxide masking, photo- and electron-beam lithography. |
Elemental semiconductors, effects of impurities on conduction properties, impurity chemistry (segregation, alloy systems), crystal-growth studies, dislocations, surface chemistry. |
|
Abrasives. |
Synthesis of diamond. Boron nitride. |
Phase equilibria studies under extremes of pressure and temperature. |
|
Superconducting solenoids for high magnetic fields. Ultrasensitive electromagnetic signal detectors. Cryogenic logic. |
New superconductors: high transition temperature, high critical current (e.g., β-tungstens). Superconducting switches. New effects-Josephson effect—in thin superconducting films. |
Superconductivity. Electrical, magnetic, and thermodynamic properties of metals at extremely low temperatures. Many-body theory. Lattice modes. |
|
Cheaper plate glass. |
Float-glass process. |
|
|
Joining techniques. Scotch tape. Band-aides. Epoxy cements |
Structural adhesvies. Pressure-sensitive adhesives. Anaerobic adhesives. |
Rheology. Physical chemistry of surfaces. Synthesis of compounds. |
|
Cheaper steelmaking. Longer-life furnace linings. |
Chemistry of steelmaking. Basic oxygen process. |
High-temperature phase equilibria. |
|
Ovenware |
Glass-ceramics. |
Thermal expansion of ceramics. Nucleation and phase separation. |
|
Aerospace alloys. Aluminum conductor cables. Copper conductors, electrical contacts. High-strength and magnetic alloys. |
Dispersion alloys: Internally oxidized particles to strengthen materials; thoria-dispersed nickel; dispersion-hardened aluminum, copper, and silver. Spinodally decomposed alloys. |
Thermodynamics of phase diagrams, chemical processes. Particle strengthening. |
|
Examples of Applications |
Material or Process |
Basic Research |
|
Aerospace. Turbine blades. Razor blades. Quality cutlery. Magneto-resistance devices. High-strength magnetic alloys. Spring metals. Heat-shrinkable metals. |
Directional solidification, continuous casting, amorphous metals, precipitation-hardened alloys, and sheet rolling. |
Solidification studies with transparent analogs. Texture and deformation studies. Heat-treatment effects: precipitation, recrystallization, superplasticity |
|
Optical communications. Ranging for ordnance and surveying. Machining. |
Optically-pumped lasers. |
Spectroscopy of impurities in crystalline hosts. |
|
Synthetic textiles. |
Spinning of fibers from melts and solutions: rayon, nylon, acrylics, polyesters. |
Orientation of macromolecular chains. |
|
Tires. |
Vulcanization. |
Role of molecular networks in determining the properties of rubber. |
|
In these examples of materials science and engineering at work, note that the flow of events is not necessarily, or even usually, from basic research to application. The transistor grew from a perceived need, followed by basic research. The float-glass process was developed originally without benefit of basic research. Vulcanized tires were in use long before molecular networks became accessible to study, but the research that came later has made vulcanization a much more effective process. |
||
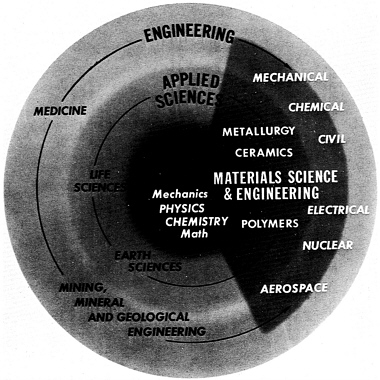
FIGURE 7. Disciplinary Mix in Materials Science and Engineering
Subjects within the shaded sector above are considered to be in the field of materials science and engineering. Subjects partly or wholly outside the sector are involved in the field to varying degrees. COSMAT estimates, for example, that among the 150,000 chemists in the country, there are the equivalent of 50,000 chemists working full time in materials. (Illustration adapted from Mineral Science and Technology: Non-metallic Materials, National Academy of Sciences, Washington, D.C. 1969, page 12.)
provides a framework in which the constituent disciplines can assess various opportunities to advance knowledge and help solve societal problems. Together with conventional discipline-oriented activities, the field encompasses both multidisciplinary and interdisciplinary work. In multidisciplinary efforts, scientists and engineers from different disciplines tend to work independently, but readily consult among themselves to benefit from cross-fertilization. In interdisciplinary efforts, two or more individuals from different disciplines collaborate closely on problems or missions that do not fit into single disciplines.
The notion of interdisciplinarity has become increasingly important in the past three decades in materials research and development and in other fields, such as the environmental sciences. Nonetheless, interdisciplinary research remains somewhat contradictory to the scientific tradition that has evolved in the universities. The academic structure—promotion policies, funding mechanisms, peer-group recognition—tends to be geared to the individual investigator, working primarily in a single discipline. The fostering of interdisciplinary academic programs in materials, in fact, was one of the goals of the 17 interdisciplinary laboratories established at universities in the early 1960’s and funded by the Advanced Research Projects Agency, the Atomic Energy Commission, and the National Aeronautics and Space Administration (see page 37).
The interdisciplinary spirit is more evident in industrial and other mission-oriented organizations. Even there, however, the effectiveness of the mechanism is sensitive to the manner in which the laboratory
is organized and managed. It is especially dependent on the steps taken to ease communication among individuals, to create an atmosphere in which people from different disciplines can recognize their need for each other’s expertise and the advantages of working together on programs of common purpose.
The transition from research to development also requires care. Early in a project an interdisciplinary research and development group may include mainly basic research people with a few engineers. As the work progresses toward application, more engineers may join the group while some of the basic scientists move on to other programs. This flexible, evolutionary process helps to combat the “not invented here” syndrome that can afflict programs in which research and development are done in sequential steps by different groups.
The establishment of an institutional focus or mission appears to be especially important to laboratories in materials science and engineering. The mission must be carefully chosen and stated, and it must transcend the aspirations of individuals. Themes like communications, energy, and transportation have proved broad enough in some laboratories to draw on many disciplines and yet are specific enough to give the interacting scientists and engineers a sense of common purpose, even in their long-range research. Shorter-range development and engineering problems, in particular, are seldom solved by individuals working on self-chosen bits and pieces related to the problem but not germane to its solution.
National and Institutional Capability
Materials activities are clearly sizable in this country, where 6 percent of the world’s population accounts for somewhere between a
quarter and a half of the world’s annual consumption of natural resources. The United States is very strong in materials science and engineering, but certain weaknesses, if unattended to, could progressively erode the nation’s ability to meet the materials needs of its people. These weaknesses are due in part to the diffusion of responsibility for materials plans and programs at the federal level. To a considerable degree, the same diffusion of responsibility is found in the universities, in both education and research. Contributing also to weaknesses in materials are shortcomings in the generation and application of basic knowledge.
National capability in materials science and engineering relies on the trained manpower and basic knowledge produced by the universities and on the application of basic knowledge by industry and other mission-oriented institutions. An organization is better able to assess and exploit new knowledge generated elsewhere when it is able itself to generate new knowledge. Thus knowledge moves more readily from the universities to industry when companies do an appropriate amount of well-chosen basic research. It moves more efficiently also when universities conduct an appropriate amount of applied research. Current difficulties on both scores are pointed out under Universities (page 37) and Industry (page 41).
The importance of materials suggests that materials science and engineering should be a prolific producer of knowledge. That this is so is indicated by the literature as abstracted in Chemical Abstracts. In 1970 Chemical Abstracts abstracted 276,674 papers and patents, of which 45 percent were in materials science and engineering. Over the past two decades, the world-wide literature in materials science and
engineering has maintained an annual growth rate of 9 percent whereas the annual growth rate for Chemical Abstracts as a whole has dropped from 8.8 percent in 1950–60 to 6.7 percent in 1960–70. Materials literature originating in the United States has been growing in recent years at 11 percent annually as compared with 13 percent for the Soviet Union, which overtook the United States in materials publications as far back as 1957. The United States produced about 25 percent of the materials papers in 1970; the Soviet Union 33 percent; and Japan 5.8 percent. In the United States, educational institutions were the chief source (50 percent) of the materials literature, followed by industry (25 percent) and government (15 percent). The United States accounted for 40 percent of the world’s patents in 1970, and Japan 12.9 percent.
Manpower
Existing data on scientific and engineering manpower generally are not categorized along the multidisciplinary lines of materials science and engineering. We have used a list of specialties characterizing the field, therefore, to extract manpower data from prime sources. On this basis it appears that materials science and engineering involves some 500,000 of the 1.8 million scientists and engineers in the United States. We estimate (Table 3) that there is a full-time equivalent of 315,000 scientists and engineers in the field, including about 115,000 full-time practitioners. Within the latter group are approximately 50,000 professionals holding materials-designated degrees. Engineers, even without counting the materials-designated professionals, constitute the largest manpower group in materials science and engineering; they number 400,000 individuals, and constitute a full-time equivalent of
TABLE 3
Estimates of Manpower in Principal Disciplinary Sectors of Materials Science and Engineering
|
|
Full -Time Equivalent |
||
|
Discipline |
Total Manpower |
MSE Manpower |
|
|
Total |
Doctorates |
||
|
Chemists |
150,000 |
50,000 (16%) |
19,000 (51%) |
|
Physicists |
45,000 |
15,000 (5%) |
8,000 (22%) |
|
Metallurgists |
40,000 |
40,000 (13%) |
5,000 (13%) |
|
Ceramists |
10,000 |
10,000 (3%) |
1,000 (3%) |
|
Other Engineers |
1,200,000 |
200,000b (63%) |
4,000 (11%) |
|
|
1,445,000a |
315,000 (100%) |
37,000 (100%) |
|
a The total number of scientists and engineers in the United States is about 1.8 million. b Approximately 400,000 engineers are involved significantly in materials science and engineering. We estimate, conservatively, that they divide their efforts equally between materials and other engineering activities and thus are equivalent to 200,000 engineers working full time in materials. |
|||
200,000. The situation with respect to women and minority groups in the materials field appears to be no different from that in science and engineering generally.
The current state of manpower data for materials science and engineering, and our knowledge of the relevant patterns of manpower flow, do not permit reasonable comparisons of the field with the traditional disciplines. However, as the role of materials science and engineering in meeting societal needs becomes more widely understood, it is quite possible that there will be an increasing demand for scientists and engineers in the materials field.
It should be emphasized that the boundaries of materials science and engineering are blurred and continually evolving. The central disciplines and subdisciplines include solid-state physics and chemistry, polymer physics and chemistry, metallurgy, ceramics, and portions of many engineering disciplines. In a broad sense the field also includes segments of mechanics; of organic, physical, analytical, and inorganic chemistry; and of chemical, mechanical, electrical, electronic, civil, environmental, aeronautical, nuclear, and industrial engineering (Table 4),
Government
Materials science and engineering has been shaped in a major way in the past two decades by federal research and development programs that evolved in response to national needs and goals. Direct federal funding of materials research and development totaled some $260 million* in
TABLE 4
Distribution of Materials Scientists and Engineers by Category of Activity
|
Category |
% of Professionals in Category Who Are in MSE |
% of Total MSEa |
|
|
FROM THE SCIENCE REGISTER |
|||
|
Polymer and Organic Chemistry |
51 |
6.7 |
|
|
Physical Chemistry |
76 |
3.4 |
|
|
Analytical Chemistry |
60 |
2.6 |
|
|
Solid-State Physics |
93 |
2.0 |
|
|
Inorganic Chemistry |
85 |
1.8 |
|
|
Other Physics |
17 |
1.6 |
|
|
Other Chemistry |
15 |
1.5 |
|
|
Atomic and Molecular Physics |
96 |
0.7 |
|
|
Optics |
38 |
0.5 |
|
|
Earth Sciences |
2 |
0.2 |
|
|
|
21% |
||
|
FROM THE ENGINEERS REGISTER |
|||
|
Structural Engineering |
42 |
12.6 |
|
|
Metallurgical Engineering |
100 |
11.0 |
|
|
Electromagnetic Engineering |
42 |
10.2 |
|
|
Chemical Engineering |
92 |
9.5 |
|
|
Work Management and Evaluation |
18 |
8.8 |
|
|
Dynamics and Mechanics |
40 |
7.7 |
|
|
Engineering Processes |
60 |
5.4 |
|
|
Heat, Light, and Applied Physics |
75 |
5.4 |
|
|
Automation & Control Instrumentation |
45 |
4.7 |
|
|
Ceramic Engineering |
100 |
1.9 |
|
|
Information and Mathematics |
20 |
1.8 |
|
|
Other Engineering |
30 |
0.1 |
|
|
|
79% |
||
|
|
100% |
||
|
a The distributions between the science and engineering portions of this listing have been adjusted to 21 percent and 79 percent, respectively, in accordance with the physics plus chemistry percentages shown in Table 3. Source: 1968 National Register of Scientific and Technical Personnel (National Science Foundation) and 1969 National Engineers Register (Engineering Manpower Commission). |
|||
fiscal 1971, according to the Interagency Council for Materials; in constant dollars this figure is about equivalent to $185 million spent in fiscal 1962. (Indirect federal funding of materials research development through hardware contracts is estimated at least to equal direct funding, giving a total of some $0.5 billion in federal materials research and development in 1971). The funding is widely scattered (Tables 5, 6). Only one agency, the National Science Foundation, has an identified mandate to support science and technology generally. All the others, commanding 90 percent of the budget, support the science and technology related to their missions.
Governmental materials laboratories, which received about a third of the federal research and development funds in materials in 1971, concentrate primarily on identified, mission-oriented problems. To support this work they do exploratory research at a level that appears to vary from laboratory to laboratory in the range of 5 to 15 percent of their total funding. Some federal laboratories have become centers of excellence in specific areas. These include the Air Force Materials Laboratory, Wright-Patterson Air Force Base, Dayton, Ohio, in composite materials; the Atomic Energy Commission’s Oak Ridge National Laboratory in radiation damage and neutron diffraction; and the National Bureau of Standards in polymeric materials.
The federal government also operates the National Standard Reference Data System, which is administered and coordinated by the National Bureau of Standards. This program provides critically evaluated numerical data on the physical and chemical properties of well-characterized substances and systems. The Bureau, in addition, operates the Standard Reference Materials program, which now can provide standard samples of more than 800 materials.
TABLE 5
Direct Federal Funding of Materials Research and Development by Agency, Type of Research, and Performer
(Fiscal year 1971; millions)
|
|
|
|
|||||||
|
Agency |
Basic Research |
Applied Research |
Experimental Development |
University |
Federal Contract Research Centers |
Other Non-Profit |
Industry |
Government In-House |
Total |
|
Agriculture |
$ 9.6 |
$ 11.8 |
$ 1.3 |
$ 0 |
$ 0 |
$ 0 |
$ 0 |
$ 22.6 |
$ 22.6 |
|
AEC |
39.3 |
42.9 |
0 |
18.5 |
57.7 |
2.5 |
2.6 |
0.8 |
82.2 |
|
NBS |
2.1 |
8.4 |
0 |
0 |
0 |
0 |
0 |
10.5 |
10.5 |
|
ARPA |
14.0 |
6.0 |
0 |
10.7 |
0 |
0.7 |
6.6 |
1.9 |
20.0 |
|
Army |
3.3 |
13.9 |
0 |
1.7 |
0 |
0.3 |
2.3 |
12.9 |
17.2 |
|
Navy |
10.3 |
9.7 |
4.4 |
2.6 |
0 |
1.2 |
5.1 |
15.4 |
24.4 |
|
Air Force |
3.9 |
23.4 |
11.5 |
2.5 |
0 |
0.3 |
26.6 |
9.4 |
38.8 |
|
HEW |
1.4 |
2.2 |
0 |
1.4 |
0 |
1.2 |
0.9 |
0 |
3.6 |
|
HUD |
0 |
0 |
0 |
0 |
0 |
0 |
0 |
0 |
0 |
|
Interior |
0.1 |
3.4 |
0 |
0.3 |
0 |
0 |
1.8 |
1.3 |
3.5 |
|
NASA |
4.7 |
14.7 |
3.2 |
0.8 |
0 |
0.8 |
3.9 |
17.0 |
22.6 |
|
NSF |
8.9 |
1.7 |
0 |
10.7 |
0 |
0 |
N.A. |
0 |
10.6 |
|
DOT |
0 |
2.0 |
2.2 |
3.0 |
1.0 |
0 |
0 |
0.5 |
4.2 |
|
Totalsa |
$ 97.6 |
$ 140.0 |
$ 22.6 |
$ 52.2 |
$ 58.7 |
$ 7.1 |
$ 49.9 |
$ 92.4 |
$260.0 |
|
|
|
|
|||||||
|
a Totals may not add exactly because of rounding in the several compilations used for these figures. Source: Interagency Council for Materials. Note: Other data suggest that the $260 million total shown above may be as high as $300 million and the University total as high as $75 million, depending on definition of terms. Some agencies, and COSMAT, consider research in solid-state physics to be materials research, for example, while others do not. |
|||||||||
TABLE 6
Direct Federal Funding of Materials Research and Development by Agency and Field of Materials
(Fiscal year 1971; millions)
|
Agency |
Metallic Materials |
Organic Materials |
Inorganic Nonmetallic Materials |
Composite Materials |
Fuels, Lubes, Fluids |
Other Materials |
|
|
Agriculture |
$ 0 |
$ 22.8 |
$ 0 |
$ 0 |
$ 0 |
$ 0 |
|
|
AEC |
38.4 |
4.7 |
34.1 |
3.4 |
0 |
1.6 |
|
|
NBS |
1.8 |
1.9 |
2.5 |
0 |
0 |
4.3 |
|
|
ARPA |
8.1 |
2.2 |
9.3 |
0.5 |
0 |
0 |
|
|
Army |
7.3 |
3.9 |
2.0 |
1.5 |
2.4 |
0 |
|
|
Navy |
12.5 |
3.9 |
4.6 |
2.2 |
0.9 |
0.3 |
|
|
Air Force |
12.0 |
7.3 |
3.2 |
14.2 |
0.5 |
1.5b |
|
|
HEW |
0.6 |
1.6 |
0.1 |
1.5 |
0 |
0 |
|
|
HUD |
0 |
0 |
0 |
0 |
0 |
0 |
|
|
Interior |
2.2 |
1.0 |
0.3 |
0 |
0 |
0 |
|
|
NASA |
12.6 |
4.2 |
1.7 |
2.6 |
1.5 |
0 |
|
|
NSF |
2.1 |
0.6 |
0 |
8.1c |
|||
|
DOT |
0.2 |
0.2 |
4.2 |
0 |
0 |
0 |
|
|
Totalsd |
$ 97.6 |
$ 53.6 |
$ 61.9 |
$ 25.9 |
$ 5.3 |
$ 15.9 |
|
|
|
Total: $260 million |
||||||
|
a Not reported under materials research and development b Materials physics, solid state c $7.6 solid state, 0.5 biomaterials d Totals may not add exactly because of rounding in the several compilations used for these figures. Source: Interagency Council for Materials. Note: Other data suggest that the $260 million total shown above may be as high as $300 million, depending on definitions of terms. Some agencies, and COSMAT, consider research in solid-state physics to be materials research, for example, while others do not. |
|||||||
Universities
Some areas of materials science and engineering, such as metallurgy and ceramics, are full-fledged academic disciplines. Areas represented as formal degree programs include materials science, polymer science, solid-state science, and materials engineering. Despite the increasing definitiveness of such programs, the nature and uses of materials are so broad and pervasive as to continue to require close interaction among many disciplines.
At least half of the identifiable research on materials in universities is done on the 28 campuses where materials research centers have been established in the past decade. Twelve of these were selected in the early 1960’s as the sites of interdisciplinary laboratories (IDL’s). These laboratories were sponsored by the Advanced Research Projects Agency in the Department of Defense (ARPA) as an experiment in improving the sophistication of materials research and increasing the number of materials specialists. A notable feature of these laboratories has been the availability of block funding for locally selected research programs and central facilities. Responsibility for the interdisciplinary laboratories program was assumed on July 1, 1972, by the Materials Research Division of the National Science Foundation; the laboratories were then renamed Materials Research Laboratories. In the spring of 1973 the Foundation announced plans for two new Materials Research Laboratories. One will focus on the technology of joining, the other on polymers.
The National Aeronautics and Space Administration (NASA) set up three block-funded programs at universities in the 1960’s, but at
lower levels of support than for the interdisciplinary laboratories. In the same period the Atomic Energy Commission (AEC) established block-funded materials research centers at two universities, one of them already housing an interdisciplinary laboratory. Since the start of these 17 programs set up by ARPA, NASA, and AEC, 11 additional universities have formed analogous materials research centers, mainly on their own initiative. They use the concept of central facilities, but are mostly without block funding.
The COSMAT study found that, typically, these 28 centers ranked high in education and individual basic research, the traditional functions of the university. Most of the centers ranked low in interaction with industry and in innovative methods of operation. Some centers are doing a relatively significant amount of interdisciplinary work, one measure of which is the authorship of the resulting scientific papers. In three quarters of the centers, 10 to 15 percent of the papers covered by our evaluation were written jointly by faculty from two or more departments. This contrasts with an average of 2 percent for papers from materials-designated departments.
Because of the difficulty of obtaining comparable data from different schools, this evaluation cannot be fully accurate and complete. However that may be, universities have produced relatively little so far in the way of new materials per se. An important reason, we believe, is that the academic community traditionally has resisted interdisciplinary and applied research. We have noted already that the reward structure within the university is tilted strongly toward the disciplines; moreover, no funding agencies have clearly rewarded
excellence in interdisciplinary activities at universities. All the materials research centers indicated that they plan to shift their emphasis somewhat toward applied research. The area mentioned most often was biomaterials. This field is highly interdisciplinary and intellectually stimulating, but the corresponding body of technology is much smaller than in other areas, such as ceramics, polymers, and electronic materials.
Materials Degrees. Formal undergraduate curricula in materials appear to be confined to materials-designated degree programs, which are located almost entirely in engineering schools. Some 60 programs of this kind are accredited in the country’s 250 engineering schools. These and 30 unaccredited programs award annually somewhat more than 900 materials-designated baccalaureate degrees, or about 2 percent of the total engineering baccalaureates conferred annually. Currently, more than half of the materials-designated departments average fewer than 10 baccalaureates per year, a situation which will become increasingly difficult to justify.
About 50 institutions in the United States offer graduate degrees in materials. The 270 materials-designated doctorates awarded in 1971–72 amounted to about 7% of the total engineering doctorates conferred. In solid-state physics, which provides a major component of the professional manpower in materials science and engineering, doctorates awarded annually appear to number about 370. Annual output of materials-research doctorates awarded in chemistry and in nonmaterials-designated engineering programs is at least double the number in solid-state physics. Thus we estimate that the annual output of doctorates
in the field of materials is about 1400, but there is much uncertainty in this figure because of difficulties in the “materials identification.”
Research Funding. University research in materials is supported almost entirely by federal funds at an annual level (in 1971) of about $52.2 million* (Table 5). This was 20 percent of the $260 million** in total, direct federal support for materials research and development in 1971 and about 3 percent of total federal support for research and development in the universities. Some 35 percent of the support for university research in materials was provided by the Atomic Energy Commission and about 20 percent each by the National Science Foundation and the Advanced Research Projects Agency. (In fiscal 1973 the Foundation estimates its materials research support at $35 million, more than triple the $10.7 million of 1971, but the major part of the increase arises from internal regrouping into the materials research category.) Relatively little identified support is available as yet from agencies like the Departments of Health, Education, and Welfare; Housing and Urban Development; and Transportation.
Almost 60 percent of the federal support for university research in materials goes to the 12 universities where the National Science Foundation Materials Research Laboratories are located. About 15 percent of the support goes to the 16 additional schools that have
materials research centers of other kinds. On the 12 campuses where the NSF Materials Research Laboratories are located, slightly more than 25% of materials-research funds are received by materials-designated departments, slightly less than 15% by other engineering departments, and about 60% by physics and chemistry departments.
Industry
Materials are vital to any nation’s economy. The consumption of basic materials in the United States has been rising steadily (Table 7), along with the population and standard of living. The resulting drain on resources has drawn sharp attention at various times, but especially in the past few years, as has the impact of waste or residual materials on the environment. From these concerns has emerged a need to think in terms of specific materials flows. One such flow diagram (Figure 8) has been developed to show the interplay of residuals and recycling in relation to environmental quality. Though qualitative, it portrays the materials streams that might be involved in a quantitative model.
We mentioned at the outset that without materials there would be no gross national product. By the same token, analysis of the gross national product is useful in putting materials into perspective. It shows that, broadly considered, about a fifth of this country’s gross national product may be said to originate in the extracting, refining, processing, and forming of materials into finished goods other than food and fuel (Table 8). These operations on materials account for perhaps one tenth of the nation’s consumption of fuels. A third
TABLE 7
Consumption of Selecteda Basic Materials in the United States
(Millions of Tons)
|
|
1950b |
1971b |
|
Aluminum |
1.3 |
5.5 |
|
Calcium |
N.A. |
90.3 |
|
Copper |
2.0 |
2.4 |
|
Iron |
94.5 |
122.2 |
|
Lead |
1.4 |
1.3 |
|
Magnesium |
N.A. |
1.1 |
|
Manganese |
1.1 |
1.2 |
|
Phosphorus |
1.7 |
5.1 |
|
Potassium |
1.2 |
4.5 |
|
Sodium |
N.A. |
19.0 |
|
Sulfur |
6.8 |
12.4 |
|
Zinc |
1.1 |
1.2 |
|
Clays |
39.5 |
55.1 |
|
Gypsum |
11.4 |
15.7 |
|
Pumice |
0.7 |
3.5 |
|
Sand and gravel |
370.9 |
987.7 |
|
Stone, crushed |
N.A. |
823.0 |
|
Stone, dimension |
N.A. |
1.8 |
|
Talc |
0.6 |
1.1 |
|
. . . |
||
|
Agricultural fibers |
N.A. |
2.1 |
|
Forest products |
N.A. |
237.0 |
|
Plastics |
1.0 |
10.0 |
|
a Commodities used in excess of 1 million tons in 1971. Totals include government stockpiling, industry stocks, and exports. Foods and fuels are not included. b 1950 actual; 1971 estimated. Source: First annual Report of the Secretary of the Interior under the Mining and Minerals Policy Act of 1970, March 1972. Figures for agricultural fibers, forest products, and plastics compiled by COSMAT from various sources. |
||
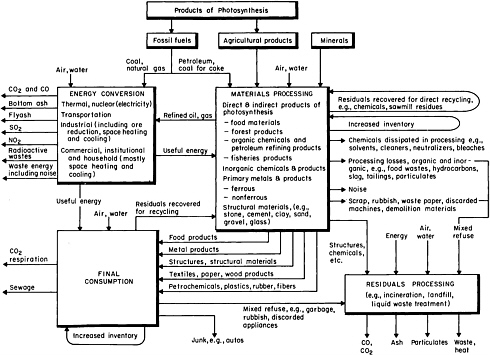
TABLE 8
Selected Industry Components of the Gross National Product (1971)
(1971 GNP=$1,050,356 million)
|
|
Millions |
% of GNP |
|
Metal Mining |
$ 1,290 |
0.12 |
|
Mining and Quarrying of Nonmetallic Metals |
1,654 |
0.16 |
|
Stone, Clay and Glass Products |
8,710 |
0.83 |
|
Primary Metal Industries |
18,923 |
1.80 |
|
Fabricated Metal Products |
16,427 |
1.56 |
|
Machinery, except Electrical |
26,066 |
2.48 |
|
Electrical Machinery |
22,388 |
2.13 |
|
Transportation Equipment, except Motor Vehicles |
14,582 |
1.39 |
|
Motor Vehicles and Motor Vehicle Equipment |
22,824 |
2.17 |
|
Instruments |
6,456 |
0.61 |
|
Miscellaneous Manufacturing Industries |
4,144 |
0.39 |
|
Chemicals and Allied Products |
20,387 |
1.94 |
|
Rubber and Miscellaneous Plastic Products |
7,371 |
0.70 |
|
Lumber and Wood Products, except Furniture |
6,395 |
0.61 |
|
Furniture and Fixtures |
3,984 |
0.38 |
|
Paper and Allied Products |
9,357 |
0.89 |
|
Textile Mill Products |
8,234 |
0.78 |
|
Apparel and Other Fabricated Textile Products |
9,293 |
0.88 |
|
Leather and Leather Products |
2,219 |
0.21 |
|
|
$210,704 |
20.03 |
|
Source: U.S. Department of Commerce. |
||
measure is manufacturing employment related to materials, which was just over 16 million in 1970 or about 21 percent of total employment.
Still another view of the economic significance of materials is provided by an analysis of structural changes in the economy arising from changes in technology.* The analysis was based on input-output tables for 1947 and 1958, a period in which tonnages and dollar values of materials were rising steadily. The results show strikingly the trend toward a service economy during this period, as indicated by the relative increases in “nonmaterial” or “general” inputs, which were largely balanced by relative decreases in the inputs of materials and semifinished goods. The iron and steel sector, for example, declined relatively some 27 percent although it grew about one third in absolute terms.** Besides the trend toward a service economy, the decline reflected substitution of aluminum and plastics for steel as well as weight-reducing design changes based on improvements in the properties of steel. Nonferrous metals decreased 23 percent, relatively, as the greater use of aluminum was more than offset by declines in other nonferrous metals. The analysis showed also that:
“The classical dominance of single kinds of material—metals, stone, clay and glass, wood, natural fibers, rubber, leather, plastics, and so on—in each kind of production has given way by 1958 to increasing diversification of
the bill of materials consumed by each industry. This development comes from interplay between keenly competitive refinement in the qualities of materials and design backward from end-use specifications.”
Industrial Research and Development. Accurate figures are not available for materials research and development in industry. Data for industrial research and development in general (Table 9) indicate that “All Industries” planned a 4 percent increase in spending in 1972 including federally-funded industrial research and development. The metals-producing industries—steel, nonferrous metals, fabricated metals—were expected to remain essentially level in 1971–72 in constant dollars. This would have meant an 8 to 10 percent decrease in research and development actually performed because of rising costs. Decreases in work performed were also indicated in paper and in stone, clay, and glass. “All Manufacturing” showed an estimated increase of only 2 percent in 1972, again amounting to a decrease in research and development actually performed. Even in high technologies like aerospace (no change in 1972) and electrical machinery and communications (up to 2 percent), research and development has not kept up with rising costs. Industrial research and development as a percentage of sales (Table 10) held level or declined in 1972 in all areas except aerospace. Federally funded research and development in All Manufacturing (Table 11) is declining, both in dollars and as a percentage of total industrial research and development.
More recent figures (Table 12) show a brightening picture for company-funded research and development, although substantial differences exist among individual industries. Spending on basic research
TABLE 9
Industrial Research and Development
(Includes federally funded industrial R&D)
|
|
Expenditures |
Change |
||||
|
|
1970 |
Est. |
Planned |
|
||
|
|
Actual |
1971 |
1972 |
1975 |
1971–72 |
1972–75 |
|
|
(Millions) |
(Percent) |
||||
|
Steel |
$ 131 |
$ 122 |
$ 132 |
$ 149 |
8 |
13 |
|
Nonferrous Metals |
134 |
165 |
155 |
234 |
–6 |
51 |
|
Machinery |
1,727 |
1,831 |
1,923 |
2,173 |
5 |
13 |
|
Electrical Machinery & Communications |
4,324 |
4,410 |
4,498 |
5,353 |
2 |
19 |
|
Aerospace |
5,173 |
4,914 |
4,914 |
5,061 |
0 |
7 |
|
Autos, Trucks & Parts & Other Transportation Equipment |
1,475 |
1,475 |
1,504 |
1,609 |
2 |
7 |
|
Fabricated Metals & Ordnance |
183 |
176 |
183 |
210 |
4 |
15 |
|
Professional & Scientific Instruments |
694 |
756 |
824 |
972 |
9 |
18 |
|
Lumber & Furniture |
24 |
31 |
36 |
38 |
16 |
6 |
|
Chemicals |
1,809 |
1,827 |
1,882 |
2,145 |
3 |
14 |
|
Paper |
119 |
133 |
133 |
166 |
0 |
25 |
|
Rubber Products |
238 |
281 |
295 |
336 |
5 |
12 |
|
Stone, Clay & Glass |
188 |
169 |
169 |
198 |
0 |
17 |
|
Petroleum Products |
608 |
492 |
522 |
606 |
6 |
16 |
|
Food & Beverages |
198 |
208 |
225 |
263 |
8 |
17 |
|
Textile Mill Products & Apparel |
64 |
60 |
66 |
81 |
10 |
23 |
|
Other Manufacturing |
98 |
117 |
124 |
161 |
6 |
30 |
|
ALL MANUFACTURING |
17,187 |
17,167 |
17,585 |
19,755 |
2 |
12 |
|
Nonmanufacturing |
669 |
723 |
1,063 |
1,711 |
47 |
61 |
|
ALL INDUSTRIES |
17,856 |
17,890 |
18,648 |
21,466 |
4 |
15 |
|
Source: National Science Foundation (1972). |
||||||
TABLE 10
Industrial Research and Development as Percent of Salesa
|
|
1970 |
1971 |
1972b |
1975b |
|
Steel |
.34% |
.31% |
.28% |
.26% |
|
Nonferrous Metals |
.76 |
.90 |
.79 |
.93 |
|
Electrical Machinery |
8.51 |
8.17 |
7.72 |
7.23 |
|
Machinery, Other |
3.08 |
3.08 |
2.96 |
2.61 |
|
Aerospace |
19.02 |
20.05 |
20.88 |
17.92 |
|
Autos, Trucks & Parts & Other Transportation Equipment |
2.73 |
2.23 |
2.05 |
1.71 |
|
Stone, Clay & Glass |
1.06 |
.81 |
.74 |
.70 |
|
Fabricated Metals |
.44 |
.41 |
.40 |
.37 |
|
Instruments |
5.71 |
6.39 |
6.27 |
5.52 |
|
Chemicals |
3.71 |
3.54 |
3.41 |
3.16 |
|
Paper |
.74 |
.51 |
.47 |
.45 |
|
Rubber |
1.36 |
1.49 |
1.43 |
1.34 |
|
Petroleum |
2.29 |
1.76 |
1.73 |
1.66 |
|
Textiles |
.29 |
.26 |
.26 |
.24 |
|
Food & Beverages |
.20 |
.20 |
.20 |
.19 |
|
Other Manufacturing |
.13 |
.14 |
.14 |
.13 |
|
ALL MANUFACTURING |
2.63% |
2.47% |
2.32% |
2.08% |
|
a Sales figures are based on company data classified by major product line. b 1972 estimated; 1975 planned. Source: 1972 McGraw-Hill Survey of Industry Research and Development. |
||||
TABLE 11
Federally Financed Industrial Research and Development
(Amounts and percent of total R&D spending by industry)
|
|
1971 |
1972b |
1975 |
|||
|
INDUSTRY |
Percent |
Million Dollars |
Percent |
Million Dollars |
Percent |
Million Dollars |
|
Steel |
|
|
|
|||
|
Nonferrous Metals |
5% |
$ 8 |
6% |
$ 9 |
6% |
$ 14 |
|
Machinery |
12 |
220 |
10 |
192 |
8 |
174 |
|
Electrical Machinery & Communications |
50 |
2,205 |
48 |
2,159 |
42 |
2,248 |
|
Aerospace |
80 |
3,931 |
76 |
3,735 |
72 |
3,644 |
|
Autos, Trucks & Parts & Other Transportation |
13 |
192 |
12 |
180 |
10 |
161 |
|
Fabricated Metals & Ordnance |
3 |
5 |
3 |
5 |
3 |
6 |
|
Professional & Scientific Instruments |
25 |
189 |
23 |
190 |
21 |
204 |
|
Lumber & Furniture |
|
|
|
|||
|
Chemicals |
10 |
183 |
10 |
188 |
11 |
236 |
|
Paper |
1 |
1 |
1 |
1 |
1 |
2 |
|
Rubber Products |
15 |
42 |
14 |
41 |
12 |
40 |
|
Petroleum Products |
5 |
25 |
5 |
26 |
5 |
30 |
|
Food & Beverages |
1 |
2 |
1 |
2 |
1 |
3 |
|
Textile Mill Products & Apparel |
|
|
|
|||
|
Other Manufacturing |
|
|
|
|||
|
ALL MANUFACTURING |
41% |
$7,008 |
38% |
$6,731 |
34% |
$6,770 |
|
Nonmanufacturing |
68 |
492 |
65 |
691 |
60 |
1,027 |
|
ALL INDUSTRIES |
42% |
$7,500 |
40% |
$.7,422 |
36% |
$7,797 |
|
a Less than $500,000 b 1972 estimated; 1975 planned. Source: National Science Foundation (1972). |
||||||
TABLE 12
Company-Funded Industrial Research and Development
(Millions)
|
|
Total R & D |
Basic Research |
||||
|
|
1971 |
1972 |
1975 (Est.) |
1971 |
1972 |
1975 (Est.) |
|
All Industries |
$10,643 |
$11,400 |
$13,950 |
$ 494 |
$ 520 |
$ 650 |
|
Drugs & Medicine |
505 |
560 |
750 |
95 |
105 |
140 |
|
Industrial Chemicals |
864 |
890 |
1,025 |
100 |
105 |
125 |
|
Petroleum |
488 |
495 |
525 |
22 |
23 |
25 |
|
Electrical Equipment |
2,230 |
2,400 |
3,000 |
109 |
115 |
145 |
|
Aircraft & Missiles |
1,012 |
975 |
1,150 |
34 |
30 |
40 |
|
All Other |
5,544 |
6,080 |
7,500 |
134 |
142 |
175 |
|
Source: National Science Foundation (1973). |
||||||
in “All Industries” is projected to rise 25 percent in 1972–75, to $650 million; spending on research and development overall is expected to rise 22 percent in the same period, to just under $14 billion. The source of these figures, the National Science Foundation, notes the changing nature of industrial basic research. Companies generally are shifting toward “shorter-term, more relevant, and hence more economically-justifiable projects.”
Need for Research and Development. Industry in this country and abroad has produced many of the outstanding achievements of materials science and engineering. They include nylon; the transistor; the high-field superconductor; the laser; phosphors for television, radar, and fluorescent lamps; high-strength magnetic alloys; magnetic ferrites; and polyethylene. These developments occurred in industries that conducted long-range research to expand the basic knowledge on which the industry ultimately relied. By thus supplementing their experience-based approach to materials research and development, these industries established technological leadership for themselves and for their countries. The resulting cumulative national payoff, though difficult to measure, is substantial.
Our current shift from aerospace, atomic energy, and defense toward more civilian-oriented technologies offers industry a wide variety of fresh technical challenges: in the environment, in energy, in the quality and safety of consumer goods. Many such challenges will be met only with the help of sustained basic and applied research. Yet industry has been cutting back its relatively basic programs in the
past few years. The science-intensive industries have retrenched significantly; the experience-based industries in many cases have virtually eliminated what little basic research they were doing.
Competitive pressures and the cost of research and development are rising steadily. A not-uncommon view is that the penalties of failure in research and development and the liability of high engineering risk have grown too great, while the rewards of success and the achievement of advanced product performance are too easily appropriated by others. Some companies now are reluctant to undertake programs that do not promise to begin to pay for themselves in 5 to 10 years at the most. The payoff period for basic research in materials, in contrast, although it tends to be shorter than in other areas, may sometimes exceed 10 years. A company that is not a technological leader may find that new technology is obtained more sensibly from other companies, by cross-licensing or by royalty agreements. But the company striving to achieve or maintain technical leadership will find a balanced research and development program essential to its success.
More broadly, were basic research in materials science and engineering to be eliminated, the rate of introduction of new technology might not slow noticeably for several years. But then the nation’s capability would decline—precipitously in some high-technology areas. The country could sink to a seriously inferior position internationally in 10 to 20 years. Many industrial managements and, perhaps, the general public are not prepared to wait that long for the fruits of research. But industry should recognize more widely, we believe, that research in materials characteristically has
returned good value and that the payoff is more assured than in many other fields. Progress in materials may not depend on public support to the same extent as does progress in astronomy, let us say, but for government, as for industry, materials science and engineering represents a sound investment. As in other fields, the decisions to be made often relate to the appropriate roles of government and private initiative in undertaking research. These can be hard decisions, but they must be made.


