
TABLE 7.1 Annual Requirements for Principal Primary Materials Used in the United States (Pounds per capita, 1972)
|
A. Nonmetallic Inorganic Materials: |
|
|
|
Sand and gravel |
9000 |
|
|
Stone |
8500 |
|
|
Cement |
800 |
|
|
Clays |
600 |
|
|
Salt |
450 |
|
|
Other |
1200 |
20550 |
|
B. Metals: |
|
|
|
Iron and steel |
1200 |
|
|
Aluminum |
50 |
|
|
Copper |
25 |
|
|
Lead |
15 |
|
|
Zinc |
15 |
|
|
Other |
35 |
1340 |
|
C. Natural Organic Materials: |
|
|
|
Forest products |
2750 |
|
|
Natural fibers and oils |
50 |
|
|
Natural rubber |
10 |
2810 |
|
D. Synthetic Organic Materials: |
|
|
|
Synthetic polymers |
116 |
|
|
(including rubber) |
|
116 |
|
|
TOTAL |
24816 |
|
(Equivalent total for entire U.S. population = 2.57 billion short tons.) |
||
technology that may make it feasible to mine down to 4 pounds per ton.
While advances in extraction technology are capable of easing our dependence on foreign sources of raw materials, improved technology in other stages of the materials cycle could enhance the effectiveness of materials utilization and hence relieve pressure on new supply. Figure 2.4 of Chapter 2*illustrates some of the social and technical pressures that operate at various stages of the economic utilization of materials. A strong materials technology is a key element in permitting industry to be responsive to these pressures and yet still produce goods at reasonable cost.
MATERIALS IN INDUSTRY
Consideration was directed in Chapter 2 to the changing world conditions in which the institutions of the materials field—in industry, government, and universities—must function. Attention is now given to illustrating in more detail the principal features of industrial areas which operate to meet man’s present and future needs for materials to perform desired functions in goods and services. The features are highlighted by examining three key materials-producing industries (metals, inorganic nonmetals, and plastics), and five industries that are major users of materials (electronics, lighting, containers, automobile, and building). Finally, in the closing part of this section, the important role of materials standards and specifications is reviewed.
Before discussing the individual industries, it is useful to view their relative efforts devoted to process and product improvement and innovation through their R&D activities. Although accurate information for these industries is unavailable, some comparison with the full range of U.S. manufacturing industry is given by data in Tables 2.19, 2.20, and 2.21 of Chapter 2. The industries listed in these tables are the Standard Industry Classification (SIC) sectors often used in national statistics. While these sectors do not always exactly match the industries to be discussed here, they are close enough to indicate two important points. The first is that the metals and inorganic-nonmetals producing industries—like most primary product industries—show R&D expenditures that are considerably smaller in absolute terms than the four industry sectors leading the list, and they also stand lower as a proportion of the industry sales revenue. The second point is that, unlike the leading industries (except for chemicals, in which the plastics industry would be included), these materials-producing industries essentially fund their own R&D and receive little federal R&D support. While presently available national statistics do not permit a more detailed analysis of industrial materials R&D, Table 2.21 indicates that total R&D in the materials-producing industries is somewhat more than one billion dollars, almost all of which is supported by industrial funds. In addition, a substantial amount of R&D is carried out in the materials-using industries, although the actual dollar value has not been ascertained.
Principal Materials-Producing Industries
Metals Industry
Table 7.2 shows the expected demand for metals over the next 15 years. Iron and steel continue to be the leading metals industry in scale and value and a significant indicator of the nation’s economic wellbeing. In terms of both quantity and value, aluminum and copper are the principal metals in the nonferrous group. They are followed by 44 other elements, ranging from the precious metals, gold, silver, and platinum, with very high unit values but relatively small volume usage, through the industrial metals such as lead, zinc, mercury, and the light metals such as magnesium and titanium.
Major applications and future growth areas are strongly oriented toward consumer goods, transportation and construction industries, and the generation and use of electrical energy. Continuing increases in the real costs of production and an anticipated growth in utilization are the principal factors contributing to an increase in domestic demand for the nonferrous commodities (from about 15% of the 1970 value for all mineral commodities up to about 18% of the total in 1985).
Industry Structure: A large part of the metals industry is concentrated, i.e. is characterized by large vertically integrated companies which are able to optimize both their raw materials sources and their markets. Major factors leading to this structure are the worldwide occurrences of ores and raw materials and the complex coproduct-byproduct relationships. Thus, dispersion of raw material sources encourages formation of multinational companies, and broad-based markets results from the production of the many metals of interrelated occurrence. The latter is especially true in the base metals. The significance of imports and import sources to the U.S. is illustrated in Table 7.3. Similarly, Table 7.4 shows the metal byproducts recovered in the processing of ores for the major metal content.
A tendency toward horizontal integration along functional lines has developed during the last two decades. For example, major copper-producing companies have expanded their operations to include production of primary aluminum. Primary aluminum producers are likely to become involved in primary copper production within the next decade. Because of the many common markets shared by the light metals, aluminum, magnesium, and titanium, the production and processing of two or more of these elements by single firms will tend to expand during the remainder of this century. The similarities in uses and properties of titanium and alloys of iron have already led steel companies to invest in primary production facilities for both of these elements. The following paragraphs illustrate these various structural features for specific metals industries.
In iron and steel, an estimated 60% of domestic iron ore production was accounted for by nine steel companies; these same organizations produced about 75% of the nation’s crude steel in 1970. The two largest U.S. companies produced 34% of the domestic iron ore, 40% of the crude steel, and also accounted for the bulk of U.S. imports of iron ore from mines in Canada, Venezuela, Liberia, and Chile.
TABLE 7.2 U.S. Demand for Selected Primary Metals, 1970 and 1985*
|
|
|
Demand |
Growth, percent |
||
|
Metal |
Units |
1970 |
1985 |
Annual Compound |
Total 1970–1985 |
|
Ferrous: |
|
||||
|
Iron |
Million S.T. |
84 |
113 |
2.0 |
135 |
|
Manganese |
Thousand S.T. |
1,327 |
1,770 |
1.9 |
135 |
|
Chromium |
Thousand S.T. |
462 |
700 |
2.8 |
150 |
|
Vanadium |
S.T. |
7,066 |
14,700 |
5.0 |
210 |
|
Nickel |
Thousand lb. |
311,400 |
492,200 |
3.1 |
160 |
|
Molybdenum |
Thousand lb. |
49,104 |
96,500 |
4.6 |
195 |
|
Tungsten |
Thousand lb. |
16,200 |
34,200 |
5.1 |
210 |
|
Nonferrous: |
|
||||
|
Aluminum |
Thousand S.T. |
3,951 |
11,500 |
7.4 |
290 |
|
Copper |
Thousand S.T. |
1,572 |
2,900 |
4.2 |
185 |
|
Zinc |
Thousand S.T. |
1,302 |
1,820 |
2.3 |
140 |
|
Lead |
Thousand S.T. |
829 |
1,100 |
1.8 |
130 |
|
Magnesium** |
Thousand S.T. |
96 |
235 |
6.1 |
245 |
|
Tin |
Thousand L.T. |
53 |
70 |
1.9 |
130 |
|
Titanium** |
Thousand S.T. |
24 |
65 |
6.9 |
270 |
|
Mercury |
Thousand fl. (flasks) |
54 |
66 |
1.3 |
120 |
|
Silver |
Thousand Troy oz. |
73,100 |
124,000 |
3.6 |
170 |
|
Gold |
Thousand Troy oz. |
6,147 |
9,200 |
2.7 |
150 |
|
Platinum |
Thousand Troy oz. |
407 |
634 |
3.0 |
155 |
|
* From First Annual Report of Secretary of the U.S. Department of Interior, March 1972. ** Metal only, all others include both metallic and nonmetallic applications. |
|||||
TABLE 7.3 U.S. Imports by Source and as Percent of Apparent Consumption, 1970
|
Metal |
Imports /Consumption, percent |
Major Import Source |
|
Ferrous: |
||
|
Iron |
33 |
Canada, Venezuela |
|
Manganese |
82 |
Brazil, Gabon, Rep. South Africa, India |
|
Chromium |
84 |
U.S.S.R., Rep. South Africa, Turkey, Philippines |
|
Vanadium |
29 |
Rep. South Africa, U.S.S.R., Chile |
|
Nickel |
75 |
Canada, Norway |
|
Molybdenum |
Nil |
|
|
Tungsten |
8 |
Canada, Peru, Mexico |
|
Nonferrous: |
||
|
Aluminum |
118 |
Jamaica, Surinam, Canada, Australia |
|
Copper |
19 |
Chile, Peru, Canada |
|
Zinc |
51 |
Canada, Mexico, Peru |
|
Lead |
27 |
Canada, Australia, Peru, Mexico |
|
Magnesium* |
3 |
Canada |
|
Tin |
76 |
Malaysia, Thailand |
|
Titanium* |
40 |
Japan, U.S.S.R. |
|
Mercury |
35 |
Canada, Spain |
|
Silver |
48 |
Canada, Peru, Mexico, Honduras |
|
Gold |
47 |
Canada, Switzerland, United Kingdom, Nicaragua |
|
Platinum |
139 |
United Kingdom, Rep. South Africa, Japan, U.S.S.R. |
|
* Metal only, all others include both metallic and nonmetallic applications. |
||
TABLE 7.4 Byproduct Relationships for Selected Metals, 1970
|
Ore |
100 Percent of Total Output |
Less Than 100 Percent of Total Output |
||
|
Iron |
Cobalt |
|
Manganese Copper |
Gold Silver |
|
Aluminum |
|
Gallium |
|
|
|
Copper |
Arsenic Rhenium |
Selenium |
Palladium Tellurium Gold Silver Molybdenum |
Platinum Nickel Zinc Iron Lead |
|
Lead |
Bismuth |
|
Antimony Zinc Silver Tellurium |
Gold Copper Manganese |
|
Zinc |
Cadmium Germanium |
Indium Thallium |
Lead Silver Manganese Gallium |
Gold Mercury Copper |
In aluminum, four of the 12 domestic firms producing primary aluminum and representing about 72% of total productive capacity in 1970 were vertically integrated from mining through production of semifabricated shapes. Two of the remaining firms were owned or associated with foreign integrated firms. Others produced aluminum from purchased bauxite or alumina, and all had facilities for producing semifabricated shapes. Worldwide, the aluminum industry is vertically integrated with very few exceptions. Six companies control or influence (by majority or minority interests) over 75% of the world productive capacity for primary aluminum.
In copper, 25 mines accounted for 93% of the U.S. copper output in 1970. The five largest produced 42%, and three companies accounted for a little more than half of the domestic mine production. Virtually all copper ore continued to be treated at concentrators near the mines. Concentrates were processed at 17 smelters—eight in Arizona and one each in Utah, Michigan, Montana, Nevada, New Mexico, Tennessee, Texas, New Jersey, and Washington. Copper smelting capacity in the U.S. in 1970 totaled 9.2 million tons of charge, equivalent to about 1.9 million tons of smelter product; four companies constituted nearly 80% of the capacity. Refinery capacity totaled 2.7 million tons of which 89% was electrolytic refining capacity and 11% was fire-refining (including Lake copper) capacity.
Many large domestic copper producers, through subsidiaries or stock holdings, operate or control foreign copper-producing properties in Canada, Mexico, Peru, the Republic of South Africa, and Zambia. In addition to copper and the usual byproducts, some of these companies are also major producers of aluminum, cadmium, chromium, germanium, lead, titanium, uranium, vanadium, zinc, asbestos, fluorspar, precious metals, and liquid and solid fuels.
In lead, domestic companies accounted for 61% of the lead mined and practically all of the primary smelter production in 1970. These large companies are vertically integrated (from mine to refined lead) and are also horizontally integrated with other base-metal production. Other companies in the industry are essentially mine operators utilizing, to a varying degree, custom plants for concentration, smelting, and refining. The leading 25 mines accounted for over 95%, and the leading 5 mines for 64% of the total domestic primary production in 1970. Four states produced 97% of the total domestic production; Missouri contributed 74%; Idaho, 11%; Utah, 8%; and Colorado, 4%.
In zinc, companies prominent in the U.S. zinc mining or smelting industry likewise have substantial interests in important mines and related operations in foreign countries. Conversely, certain foreign firms have significant interests in segments of the U.S. zinc industry. In 1970, the primary zinc producing industry in the U.S. was dominated by six large vertically integrated firms that controlled mines, smelters, and/or refineries. These six, along with one company having only an electrolytic refiner, accounted for 90% of the slab zinc produced domestically. Nine prominent U.S. companies have substantial interests in foreign zinc activities. Holdings are in properties located in Canada, Mexico, Argentina, Peru, Australia, and southwestern Africa.
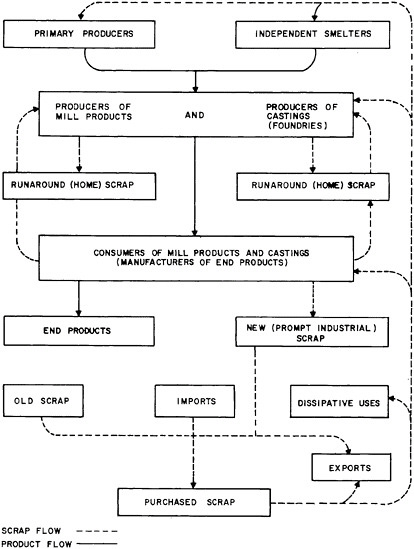
Recycling of Metals: Published statistics on the reuse of metal wastes through recycling are frequently confusing in that they often fail to distinguish between scrap recovered from the materials-producing or using
industry (home or prompt industrial scrap) and that derived from post-consumer wastes (old scrap) or imports. Figure 7.2, which is based on the aluminum industry, illustrates the origins of these types of scrap at the different stages of metal flow through the materials system. Clear delineation of these separate scrap sources is especially important in the light of current material concerns about the management of waste or residual flows for purposes of environmental protection and materials conservation.
Table 7.5 shows the current levels of total scrap recovered in the U.S. for the major metals. These data indicate the modest recovery of secondary aluminum and zinc (17% of consumption) compared with that for secondary copper (i.e. copper recovered from scrap as metal, as alloys without separation of the copper, or as compounds). Both the intrinsic value and long-established recovery technologies contribute to the higher rate for copper. The largest amount recovered as metal is reclaimed by the primary copper producers as electrolytic copper. However, alloyed copper, principally brass and bronze, comprises more than 50% of the total recovery and is prepared by secondary smelting and casting processes.
Lead, like copper, has a high annual rate of recovery—amounting to 44% of consumption. Half of the lead consumed each year is added to the lead-in-use resource, i.e. becomes available for recycling. In contrast to copper and lead, only 17% of zinc supply comes from scrap. Most of the zinc from old scrap (such as manufactured items discarded because of wear, damage, or obsolescence) is recovered in the form of die-castings, engravers’ plates, brass, and bronze, but this represents less than 5% of the total supply. New scrap, principally zinc-base and copper-base alloys from manufacturers, and drosses, from molten galvanizing and die-casting pots, contribute 10–15%. The large usage of zinc in galvanizing and in compounds (such as paints) where the zinc is lost is a major obstacle to improved recycling of zinc.
Over the last 30 years, total annual consumption of ferrous scrap by the iron and steel industry has been close to a 1:1 ratio with virgin pig iron. Home scrap accounts for well over 60% of the scrap used in the steelmaking furnaces; less than 15% is prompt scrap, and the balance is obsolete material.
Currently, the development of sophisticated processing and materials-handling equipment is revolutionizing major areas of the purchased-scrap industry. For example, giant shredders, or fragmentizers, with magnetic separators and pneumatic cleaning devices can convert up to 1,000 automobile bodies per day into scrap (i.e. at a rate of less than 30 seconds each). The combined national capacity of about 70 super-shredders and small-to-medium sized shredders in operation in 1968 was described as over 6 million tons, about equalling the tonnage of cars junked that year. Advances in balers, automatic shears, and conveyors contributed to the mechanization trend. Improved quality-control equipment permits the processor to deliver scrap material to more exacting specifications. In contrast with such changes, economically viable technologies for metals recovery from another major source—urban wastes—remain to be developed.
Environmental Considerations: Environmental-quality requirements introduced over the past decade have significant impacts on the mineral industry. For instance, fumes from zinc smelters may contain cadmium, those from copper smelters may contain arsenic, and both operations generate sulfur dioxide.
To control such pollutants within acceptance limits requires add-on equipment to remove them or even changes in the technology of the extraction processes themselves. Thus, in order to assist in minimizing the release of such pollutants, there is a need to improve the methods of recovery of “associated” metals (e.g. bismuth antimony, rhenium, cadmium, indium, and others) that occur with copper, lead, and zinc ores. Ordinarily, these associated metals are present in such small amounts that they are disregarded in commercial smelting operations.
In addition to problems in processing, the actual utilization of some metals is being reduced because of environmental concern. Examples are the curtailed demand for mercury and the decrease in the demand for lead as automobile fuel is switched away from leaded gasoline. Conversely, demand for other metals is likely to increase due to construction requirements for pollution-control equipment. One specific example is the expected increase in demand for platinum in automobile catalytic mufflers to meet the requirements of the Clean Air Act of 1970. Correspondingly, petroleum refineries may need more platinum for catalysts as demand for lead-free gasoline is increased.
The following summarizes the capital expenditures expected in the various metal industries to comply with environmental regulations over the next several years. To control air and water pollution associated with the smelting and refining of aluminum, an investment of $935 million will be required for the period 1972 through 1976. Annual costs are estimated to range from $22 million in 1972 to approximately $290 million in 1976. Cost increases per pound of aluminum in 1976 may average $0.020 to $0.032.2 For copper, control of smelter stack-gas emissions is the most pressing problem facing the U.S. industry. Estimated capital investment for air- and water-pollution controls required of the copper industry between 1972 and 1976 is expected to total $300 million to $690 million, with a most likely estimate of $340 million. Annual costs are estimated to increase from $6 million in 1972 to $95 million in 1976. Per pound of refined copper, these costs would average $0.001 in 1972 and $0.025 in 1976, with a possible high estimate of $0.05 in 1976.2
For lead, the total capital expenditure required to control the pollution associated with smelting and refining, might be about $70 million for the 1972 to 1976 period, with annual costs increasing from $1.1 million in 1972 to $20 million in 1976. Costs per pound of lead in 1976 have been estimated at $0.012 to $0.017.2 However, these studies did not consider the substantial changes in the lead markets that might be caused by other pollution abatement regulations such as those to reduce the lead content of gasoline. For zinc smelting and refining, $62 million of capital expenditures are estimated for the period 1972 to 1976. Annual pollution-control costs may increase from $1.5 million in 1972 to $27 million in 1976, averaging $0.0123 to $0.0267 per pound of zinc, with an expected cost of $0.0135 per pound.2
Inorganic Nonmetals Industry
Demand for inorganic nonmetallic materials accounted for 8% of total mineral tonnage in 1950, an estimated 8% in 1971, and is projected to be 11% in 2000. These materials include a wide range of substances, from large-bulk items such as sand, gravel, stone, and clay, through intermediate processed materials such as ceramics, electronic crystals, and synthetic high-hardness abrasives. In general, they are produced in response to near-term demand, and domestic reserves for most major nometallics are large. Domestic mineral production of nonmetallics in 1971 was valued at $5.9 billion. The corresponding variety of materials is shown in Table 7.6. Many are large tonnage items, of initial low value in the unprocessed stage, but acquiring substantial added value in the form of glass, ceramics, chemicals, etc.
Nonmetal mining or industrial-minerals operations tend to be diverse in size and degree of integration. In general, the abundance of these items is such that there is no reclaimed material production. For the most part, the secondary or reclamation segment of the nonmetallic minerals industry is limited to some reclaimed fluorine, diamonds, and abrasives. Pollution-control regulations may force an increase in recycling but high transportation costs are likely to limit the size and market for such operations.
In the following, attention is given to some of the major categories of materials involved in order to illustrate the principal features of the industry. The categories are ceramics, construction materials, fertilizer minerals, and a selection of the other major nonmetallic materials.
Ceramic Materials: The technology of ceramic materials may be divided into two major categories. One branch produces large quantities of relatively simple products which in total play a significant role in the U.S. economy: cement, brick, tile, glass, whiteware, refractories, clay products, etc. The technology of these materials has, in general, kept pace with needs. In recent years, however, the float process for flat glass came from abroad, and glass imports have been sufficiently large to cause some problems for the domestic industry. Another branch of ceramics is more closely allied to the frontiers of materials science, solid-state physics, and solid-state chemistry. This branch has developed the transistor, synthetic diamonds, luminescent phosphors, and high-temperature oxides, carbides, nitrides, borides, etc. Nuclear fuels are an important development of this activity. These specialized materials require the application of scientific thinking and practices, and have resulted in the establishment of whole new industries. However, continued progress in the science of such materials is dependent upon further extensive research of the most fundamental nature and the interchange of information among widely differing scientific disciplines.
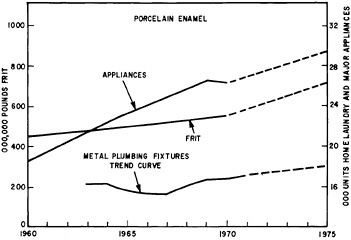
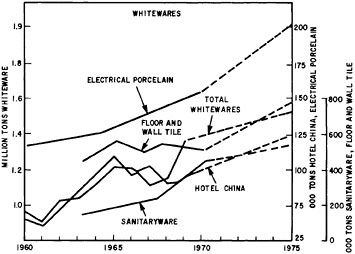
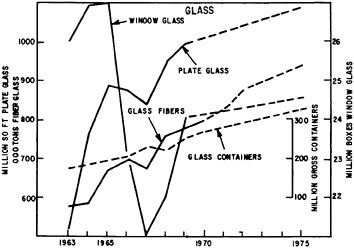
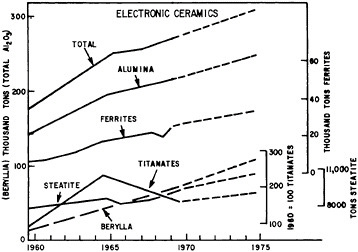
Shipments of products from the ceramic industry which totalled some $15 million in 1972 are important inputs into the construction, container, auto, lamp, and electronics industries discussed in other sections of this chapter. In addition, nuclear fuels, refractories, carbon, and graphite are important components of energy supplies, containment, and use. Materials listed in Table 7.7 illustrate the wide variety of essential ceramic products and the industries to which they contribute. Figures 7.3 through 7.6 show the different growth characteristics of some of the principal ceramic materials and products since the early 1960’s.
TABLE 7.6 Nonmetallic Minerals, 1971 (Preliminary Data)* Short Tons
TABLE 7.7 Ceramic Industry—Total Value of Shipments* (in billions of dollars)
|
|
1972** |
1967 |
1963 |
1958 |
1954 |
1947 |
|
Construction Ceramics |
||||||
|
Flat Glass |
.732 |
.611 |
.549 |
.385 |
.371 |
.224 |
|
Cement Hydraulic |
1.370 |
1.247 |
1.177 |
1.074 |
.811 |
.409 |
|
Brick & Structural Clay Tile |
.445 |
.362 |
.366 |
.287 |
.250 |
.145 |
|
Wall & Floor Tile |
.198 |
.161 |
.165 |
.136 |
.097 |
.041 |
|
Structural Clay Products NEC |
.196 |
.153 |
.160 |
.135 |
.111 |
.076 |
|
Vitreous Plumbing Fixtures |
.260 |
.170 |
.156 |
.143 |
.116 |
.068 |
|
Mineral Wool |
.504 |
.454 |
.392 |
.241 |
.157 |
.073 |
|
TOTAL CONSTRUCTION |
3.705 |
3.158 |
2.965 |
2.401 |
1.913 |
1.036 |
|
Consumer Ceramics |
||||||
|
Glass Containers |
1.988 |
1.352 |
1.004 |
.862 |
.635 |
.422 |
|
Pressed & Blown Glass NEC |
1.205 |
.886 |
.631 |
.445 |
.411 |
.235 |
|
Vitreous China Food Utensils |
.092 |
.067 |
.051 |
.048 |
.044 |
.043 |
|
Fine Earthenware Food Utensils |
.064 |
.047 |
.059 |
.050 |
.066 |
.072 |
|
Pottery Products NEC |
.107 |
.096 |
.096 |
.079 |
.055 |
.039 |
|
** Metal Stamped Enameled Products |
.183 |
.126 |
.090 |
.080 |
.066 |
.050 |
|
** Porcelain Enameled Stove Equipment |
.137 |
.095 |
.079 |
.067 |
.056 |
.036 |
|
** Porcelain Enameled Refrigeration Equipment |
.212 |
.147 |
.122 |
.066 |
.048 |
.028 |
|
** Porcelain Enameled Domestic Laundry Parts |
.134 |
.094 |
.076 |
.062 |
.045 |
.027 |
|
** Porcelain Enameled Electrical Appliance Parts |
.103 |
.053 |
.047 |
.045 |
.037 |
.028 |
|
Porcelain Teeth |
.014 |
.013 |
.012 |
.014 |
.013 |
.011 |
|
TOTAL CONSUMER |
4.239 |
2.976 |
2.267 |
1.818 |
1.476 |
.996 |
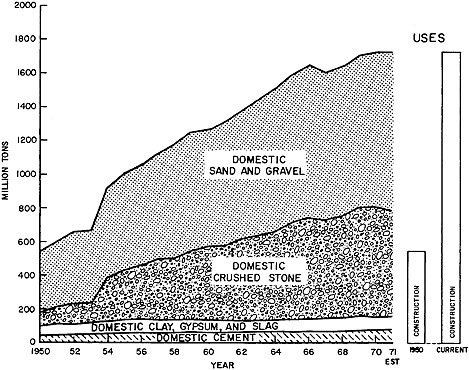
Construction Materials: Figure 7.7 shows that the use of nonmetallics in construction has more than tripled over the past two decades. These materials are produced almost wholly within the U.S. and imports are negligible. Further, except for the reuse of some old brick, and of building rubble as construction fill, recycling is not a factor. It is apparent that there have been steady and roughly proportionate increases in the use of cement, stone, and sand and gravel; these substances are commonly mixed together in specific proportions to make the heavy construction material for foundations, bridges, buildings, airports, roads, dams, etc. The consumption of clay and gypsum has increased slightly in recent years; clay is used to make a variety of products such as tile, pipe, and ceramics for construction, and gypsum is used to make plaster board which is in wide demand for its insulating and fire-retardant properties.
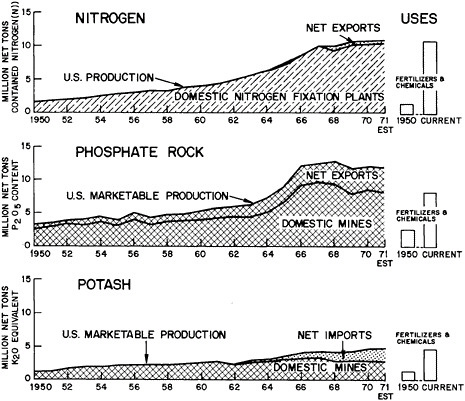
Fertilizer Materials: Figure 7.8 shows the rise in the U.S. use of the three major fertilizer ingredients—nitrogen, phosphorus, and potassium (N-P-K). The major increase in domestic agricultural productivity since World War II has resulted, in significant degree, from the intensive application of N-P-K, and other trace elements. Figure 7.8 also shows that exports of phosphate rock have provided a substantial market for the domestic phosphate mines, and indicates the increasing role of potash imports in the past several years.
Other Nonmetallic Minerals: Other nonmetallic minerals of importance to the U.S. economy include asbestos, barium, boron, bromine, calcium, corundum, diamonds, diatomite, emery, feldspar, fluorine, garnet, graphite, gypsum, kyanite, lithium, mica, perlite, pumice, quartz, sodium, strontium, sulfur, talc, soapstone, pyrophyllite, and vermiculite.
Asbestos demand is expected to increase domestically at an annual rate of 2.7 to 3.5% over the next few years. The worldwide shortage once predicted for the mid-70’s may be alleviated by the regulation of its use because of toxicity. Substitutes for asbestos are being sought for many applications. Currently, about 70% of asbestos consumption is in the cement products and construction field where the fibers are reinforcing agents. Other uses are: floor tile (10%), paper products (7%), transportation products (3%), textiles (2%), paints and caulking (2%), and plastics industries (1%). Nine companies produced all of the asbestos in the U.S. in 1970. Fully integrated companies, which are producer, consumer and end-product retailer, are common in this industry.
Barite demand is forecast to increase domestically at an annual rate of 1%. The U.S. is the world’s largest consumer, and while it produces about 20% of the world output, it is still a large importer. The major use for barite is as a weighting agent in oil- and gas-well drilling muds; this accounted for 79% of the 1970 consumption. The manufacture of barium chemicals takes up 10% of barite consumption. Most of the remaining 11% is used as a flux, oxidizer, and decolorizer in producing glass, and as a filler in paint and rubber. Four companies accounted for 69%, and 10 companies for 93% of the 1970 mine output, which was valued at $854,000.
Boron demand is expected to increase at an annual rate of 3 to 4%. For the next twenty years or more, these increased needs are expected to be met
largely by expanded domestic production. Important uses of boron compounds are in the manufacture of starch adhesives, ceramics, paints, soaps and detergents, fiberglass, flameproofing, gasoline additives, electrolytic condensers, glass, leather tanning, nonferrous-metal refining, nuclear-reactor control rods, photographic chemicals, and porcelain enamels. Boron compounds are also used in fungus control, herbicides, and agriculture. Glass and glassware accounted for about 42% of total U.S. consumption of boron; vitreous enamel and paints, 10%; soaps, cleansers, and detergents, 16%; fertilizers, 5%; and other uses, 27%.
Clay demand is forecast to increase at an annual rate of 3.5% and will be met by expanded domestic production. Reserves are plentiful and few problems of supply are expected. Imports declined nearly 25% to an all-time low of 64,000 short tons in recent years. Clay uses are many and varied, and sources are widely distributed throughout the country. Principal applications in 1970 were: structural clay products, 40%; hydraulic cement, 21%; and expanded clay, 18%. Other important markets were iron-ore processing, paper mills, and nonferrous metals.
Clay was produced at 1,457 mines in 1970, in all States except Alaska and Rhode Island. Brick plants and cement mills are scattered all over the country. Specialty clays such as ball clay, bentonite, fuller’s earth, and kaolin, are produced in localized areas and are shipped throughout the country.
Corundum demand is forecast to decrease domestically at an annual rate of 2%. U.S. requirements, which were met by imports from Southern Rhodesia until trade was stopped because of U.N. sanctions, have been supplied since 1969 from industry and government inventories. A single U.S. company acquired the entire surplus of corundum after the stockpile objective was reduced to zero and this supply was authorized for disposal.
Emery demand is forecast to increase domestically at an annual rate of 3%. However, the number of producers in New York, where the only commercial deposits of emery are found, has decreased to one; and zoning restrictions may close the remaining one. Corundum in its grain or powder form is used as an abrasive for lens grinding, (45%); pressure blasting of fabricated metals (40%); and other uses (15%). Emery is used primarily in the U.S. for nonskid concrete floors (45%), on highways (30%), and other miscellaneous abrasive applications (25%) which include coated abrasives, bonded products, polishing grain, and pressure blasting. One company in Massachusetts is the sole importer, processor, and distributor of corundum abrasives in the U.S. A New York company is the sole emery producer in the U.S.
Industrial diamond demand is forecast to increase domestically at an annual rate of 4 to 5.5%. Much of the increased need can be met by domestic manufactured synthetic diamond (25 mesh or finer). The U.S. has no domestic resources of natural diamond. The principal uses are in dies, grinding wheels, bits, tools, and in lapping and polishing compounds. The principal markets are in the manufacture of transportation equipment, 21%; electrical, 16%; concrete construction, 11%; exploration, 9%; dimension stone, 7%; stone, clay and glass, 4%; and all other uses, 15%.
Diatomite demand is expected to increase domestically at an annual growth rate of about 5%, and can be met by increasing production from existing open-pit operations in the Western States. In 1970, industrial and
and municipal water, food, beverage, and pharmaceutical processing required 58% of the diatomite production; industrial chemicals, 19%; thermal insulation, 4%; and other, 19%. During 1970, nine companies operating 11 plants principally produced and prepared all the domestic diatomite valued at $32.6 million.
Feldspar demand is forecast to increase domestically at an annual rate of 3.4 to 5.8%. These needs can be met by increasing production capacity through more than adequate reserves. (Note: Since a high percentage of feldspar supply is consumed in the manufacture of disposable bottles, legislation regulating their use may significantly alter the market for feldspar.) Feldspar is used in glassmaking to increase workability and chemical stability. Applications are for container glass, 44%; flat glass, 11%; ceramics (principally as a flux), and pottery making, 36%; enameling, 2%; and other uses such as abrasives, scouring soap, fillers, welding-rod coatings, 7%. Three firms accounted for 62%, and 7 firms accounted for 90% of 1970 mine production of the domestic feldspar (650,000 tons total).
Fluorspar demand is forecast to increase domestically at an annual rate of 3.6 to 4.6%, a rate which is faster than the probable domestic supply. In the near future, the importation of fluorspar is expected to continue at current or increasing rates. About 36% of the fluorspar consumed in the U.S. is used in the fluorocarbon industry; 40% in the steel industry; 21% in the aluminum industry; and the remaining 3% in miscellaneous electrometallurgical, chemical, ceramic, and other industries. In 1971, 2 large companies and 13 small companies operated 27 mines in 9 states. Fluorspar ores are concentrated in heavy-media and/or flotation plants. In 1971, U.S. companies produced finished fluorspar having a total value of $17 million.
Garnet demand is forecast to increase domestically at an annual rate of 2.1% for abrasive quality and 4.7% for sandblast quality. The increased needs are expected to be met by expanded domestic production. Uses for garnet are: grinding and polishing flat glass and optical glass, 32%; aircraft, 28%; other transportation, 10%; wood furniture, 10%; plastic products, 6%; semiconductors, 6%; fabricated leather products, 5%; and miscellaneous, 3%. In these applications, garnet competes with other natural and artificial abrasives. One company produces all the abrasive-quality garnet in the U.S. and accounts for all U.S. exports. Three other companies produce sandblast quality.
Graphite demand is forecast to increase domestically at an annual rate of 1 to 2% based on 1969 consumption of 61,000 tons. The increased needs are expected to be largely met, for the short term, by expanded imports. Nationalization of the Ceylonese mines has created uncertainty about future U.S. supplies from there. In 1970, natural graphite was used for foundry facing, 33%; crucibles, 9%; other refractories, 15%; a carbon raiser in steelmaking, 10%; dry lubricants, 10%; pencil leads, 4%; batteries, 3%; truck and bus brake linings, 3%; and other uses, 13%. Two hundred and thirty-five manufacturing plants account for an estimated 65% of graphite. Many small firms consume the rest. Primary metals use 43%; stone, clay, and glass products, 26%; nonpetroleum lubricants, 10%; pencils, 4%; and other uses, 17%.
Kyanite demand is predicted to increase domestically at an average rate of 3.8 to 6.7% annually. This rate could decline substantially if the direct
reduction process for steel production becomes commercially feasible. More complete recovery and use of byproducts such as pyrite, silica, and flake mica should be feasible with future advances in technology. The U.S., already the world’s largest producer of kyanite and synthetic mullite, could become the largest exporter of these commodities. Nearly 90% of the 1970 consumption of kyanite and mullite was for refractories employed in the production of iron, steel, glass, ceramics, and nonferrous metals. Three firms, each with combined mining and processing facilities, supplied 100% of marketable production in 1971. Synthetic mullite was produced in 1970 by 7 firms.
Mica scrap and flake demand is forecast to increase domestically at an annual rate of about 4.5%. Increasing demand can be met from several domestic resources which are amenable to economic benefication techniques. Although foreign producers will endeavor to increase their future scrap exports to the U.S., domestic production should remain competitive. Good quality scrap mica is delaminated and fabricated into mica paper for the electronic and electrical industries. The remaining scrap and flake is processed into ground mica for various industrial end uses, with a significant quantity of good quality scrap being delaminated for fabrication into reconstituted mica products. In 1970, scrap and flake mica were processed by 20 companies operating 22 grinding plants in 14 states. End uses for ground mica were: mica paper, 4%; gypsum plasterboard cement, 30%; roofing, 25%; paint pigment extender, 22%; molded rubber products, 6%; and other miscellaneous items, 13%. There are approximately 20 flake mica producers in the U.S. The 1970 flake mica production was valued at $2.5 million.
Mica sheet, consisting of block, film, and splittings is expected to decline in demand domestically at an average rate of 8% annually, because of the substitution impact of solid-state electronics and the availability of suitable alternate materials, both mica and nonmica based. Sheet mica is used in the manufacture of vacuum tubes, capacitors, and other electrical and nonelectrical items. Muscovite block and film was consumed by 17 companies in 8 states during 1970. Splittings were fabricated into built-up mica products by 13 companies in 9 states. Six companies accounted for almost four-fifths of total consumption.
Perlite demand is forecast to increase domestically at an annual rate of 3 to 4%. No immediate raw-material source problem is seen. Further growth in consumption is likely to be proportional to the rate of building construction. Expanded perlite is consumed as follows: aggregates (plaster, concrete, and insulating board), 59%; industrial water, food, beverage, and pharmaceutical processing, 23%; thermal insulation, 3%; agriculture, 4%; and other uses, 11%. Crude perlite was produced by 12 companies at 14 mines in 7 states. The value of crude perlite sold and used to make expanded material in 1970 was $4.9 million; the value of expanded perlite sold and used by 89 plants in 33 states was nearly $25 million.
Natural quartz crystal demand is predicted to increase domestically at a maximum annual growth rate of 0.25%. Substitution of synthetic manufactured quartz for natural quartz has lowered U.S. dependence on Brazilian imports. Practically all electronic-grade natural quartz is processed into finished crystals for electronic frequency-control or selection equipment. A very small quantity is used for prisms, wedges, lenses, and other optical
purposes. Raw quartz crystal in 1970 was consumed by 26 cutters in 12 states. Quartz crystal is used in the manufacture of oscillator plates, 73%; filter plates, 18%; telephone resonator plates, 8%; and other miscellaneous items, 1%.
Sodium carbonate or soda ash demand is expected to grow at an annual rate of about 4%. In the past, most soda ash has been produced from salt by the solvay process, but an increasing quantity (41% in 1971) is being produced from natural sources of sodium carbonate. New soda ash production facilities are dependent entirely on natural sodium carbonate minerals rather than salt. Some solvay plants have been ordered to close because their effluent could not meet new standards set by environmental protection authorities. Of the total sodium carbonate produced in the U.S., about 50% was consumed in the manufacture of glass, and 40% in the production of other chemicals. The processing of wood pulp into paper required 8%, and the remainder was consumed in soap, detergents, and other uses. Sodium carbonate is derived from natural sources by four companies. Five companies produce sodium carbonate from salt.
Sodium sulfate demand is expected to increase at an annual rate of 4%. In 1971, 46% of domestic output came from natural sources and the remainder was produced by byproducts from salt and sulfur compounds in manufacturing rayon, cellophane, and other commodities. Sodium sulfate is used in the production of kraft paper (74%) and in other miscellaneous products such as glass, ceramic glazes, detergents, stock feeds, dyes, textiles, medicines, and other chemicals. In 1971 natural sodium sulfate was produced by six companies, valued at $12.6 million.
Talc-group minerals demand is forecast to grow at between 2.5 and 4.6% annually. Domestic resources will be more than adequate to meet domestic needs. Talc and soapstone uses in 1970, in order of importance, were: ceramics, 27%; paint, 18%; paper, 6%; roofing, 5%; insecticides, 4%; rubber, 3%; toilet preparations, 2%; textiles, 1%, and other products, 34%. Talc, soapstone, and pyrophyllite are consumed by many firms in all parts of the country. Uses by industry in 1970 were: stone, clay and glass products, 34%; chemicals, 29%; paper, 6%; asphalt, 4%; rubber, 3%; and other uses, 24%. Mine output came from 40 operations and was valued at $7.8 million in 1970. Crude output was processed by about 40 grinders, mostly in the same locations.
Vermiculite demand is predicted to increase domestically at an annual rate of 3.5%. In an expanded form, vermiculite is important commercially as a concrete aggregate and as a thermal insulating material, but faces competition from other low-cost products with similar properties such as perlite and pumice. Improvements to minimize the treatment losses in fine fractions or to provide a market for fine-size vermiculite could enhance the competitive position of vermiculite. Uses for vermiculite are many; it is a loose-fill insulating medium with or without the addition of a binder. Mixed with gypsum plaster, vermiculite forms an acoustical medium for sound absorption; with portland cement, a lightweight concrete results. Gypsum, clay, asbestos, and suitable cements are added to vermiculite to produce a fireproofing medium that can be applied to building structures. Agricultural uses are as soil conditioner, a plant growing medium, and a packing material for nursery stock. Construction utilizes 80% of production; agriculture, 14%; and other uses, 6%. One company accounted for nearly all of 1970 mine output, valued at $6.5 million, from three mining operations. One company predominates in exfoliating
and operates 23 large plants in 20 states. In all, 25 companies operate 52 exfoliating plants in 33 states.
Plastics Industry
For the past twenty years, plastics production has been growing at an annual rate of between 10% and 15%. The 1969 production total was about 10 million tons, which is comparable with the nonferrous metals. Moreover, as first pointed out by Houwink3, the volume of plastics being produced is rapidly approaching that of all metals. Table 7.8 shows cubic feet of plastics, elastomers (rubbers), and fibers for 1968 and 1973 compared with ferrous and nonferrous metals4.
The production of key plastics by type, based on data by Jenest5 is shown in Table 7.9 for 1969 and estimated 1974. The “big three” (known commonly as the polyethylene-polystyrene family and PVC) draw heavily on petroleum as a raw material, as shown in Table 7.10. Many additives are employed to modify plastic materials; the scale of their use is shown by the fact that such additives had a 1969 value of $0.8 billion compared to $3.8 billion for the plastic materials themselves6.
The financial characteristics of the plastics industry have been well summarized by Jenest5. Two aspects having a materials orientation are worth noting here. The first is the price-volume relationship. Figure 7.9 is a double logarithmic plot of pounds of different plastic materials sold in 1969 as a function of selling price. The line, as drawn, has a slope of -3, indicating the extreme sensitivity of sales volume to selling price. Certain plastics, notably Nylon 6 and fluorocarbons are sold in greater quantities than would be indicated by their price alone. Secondly, in comparing cost of plastics with metals, the large difference in density often requires that costs be expressed in price per unit volume. For example, a polycarbonate resin selling at about 75c/lb. costs 3.3c/cu. in. Zinc selling for about 18c/lb. costs 4.5c/cu. in. Thus, the polycarbonate is more than competitive with zinc in applications where its properties are adequate, particularly since the polycarbonate is easier to fabricate.
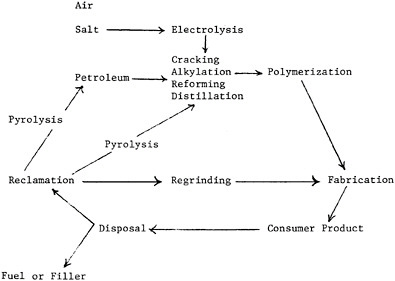
The major types of plastics-fabrication processes in use today5 are shown in Table 7.11. One significant recent trend in plastics fabrication is that major end-users of plastics parts, such as the appliance and automotive industries, are undertaking the fabrication themselves with large and sophisticated facilities. Another trend is the increasing attention being given to the disposal of post-consumer plastic wastes. Reuse and recycling possibilities are currently receiving greater attention, as well as disposal via energy generation as fuel. Table 7.12 diagrams schematically the waste and recycle aspects of plastics.
TABLE 7.8 Production of Principal Polymers and Metals in the U.S.
|
|
1968 (Cu. Ft. 107 |
1973 (Cu. Ft. 107, Estimate) |
|
Synthetic Polymers |
400 |
710 |
|
Plastics |
260 |
500 |
|
Elastomers |
80 |
110 |
|
Fibers |
60 |
100 |
|
Steel and Nonferrous Metals |
424 |
574 |
|
Steel |
370 |
500 |
|
Aluminum |
40 |
50 |
|
Zinc |
6 |
7 |
|
Copper |
4.5 |
4.7 |
|
Magnesium |
2 |
3 |
|
Lead |
1.5 |
1.6 |
TABLE 7.9 Production of Plastic Materials by Type, 1969–1974
|
|
1969 Production |
|
||||||||
|
Type |
Value $ Millions |
% of Total Value |
Average Price (c/lb., dlvd.) |
Billion Lb. |
1974 Production Billion Lb. |
|||||
|
Polyethylene |
|
725 |
|
19 |
|
13 |
|
5.5 |
|
10.7 |
|
Low density |
470 |
|
12 |
|
12 |
|
3.9 |
|
7.2 |
|
|
High density |
225 |
|
7 |
|
16 |
|
1.6 |
|
3.5 |
|
|
Styrenes |
|
645 |
|
17 |
|
19 |
|
3.4 |
|
6.0 |
|
Polystyrenea |
475 |
13 |
17 |
2.8 |
4.8 |
|
||||
|
ABS |
170 |
4 |
28 |
0.6 |
1.2 |
|
||||
|
Polyvinyl Chloride |
405 |
11 |
14 |
2.9 |
4.9 |
|||||
|
Phenolic |
265 |
7 |
22 |
1.2 |
1.7 |
|||||
|
Polypropylene |
250 |
7 |
21 |
1.2 |
3.0 |
|||||
|
Methacrylate |
200 |
6 |
55 |
0.4 |
0.7 |
|||||
|
Polyester |
195 |
5 |
28 |
0.7 |
1.4 |
|||||
|
Alkyd |
180 |
5 |
26 |
0.7 |
0.8 |
|||||
|
Cellulosic |
130 |
3 |
65 |
0.20 |
0.24 |
|||||
|
Urea |
120 |
3 |
20 |
0.6 |
0.9 |
|||||
|
Polyvinyl Acetate |
100 |
3 |
25 |
0.4 |
0.6 |
|||||
|
Epoxy |
90 |
2 |
50 |
0.2 |
0.4 |
|||||
|
Polyamide (nylon) |
80 |
2 |
82 |
0.1 |
0.2 |
|||||
|
Fluorocarbon |
75 |
2 |
350 |
0.02 |
0.03 |
|||||
|
Melamine |
60 |
2 |
30 |
0.2 |
0.3 |
|||||
|
All Otherb |
280 |
7 |
22 |
1.3 |
2.2 |
|||||
|
Total |
3820 |
100c |
20 |
19.0 |
34.0 |
|||||
|
a Includes impact grades. b Includes other vinyls (e.g. saran, polyvinyl butyral, polyvinyl alcohol), acrylates , urethane resins, polycarbonate, silicones, acetal, coumarone-indene, and others; values calculated by subtraction. c Does not add because of rounding. Sources: U.S. Tariff Commission; Modern Plastics, January and June, 1970; and Arthur D.Little, Inc., estimates. |
||||||||||
TABLE 7.10 Percentage Raw Material Make-up of Key Plastics
|
|
Ethylene |
Propylene |
Benzene |
Chlorine |
Cellulose |
Other |
|
Polyethylene |
100 |
— |
— |
— |
— |
— |
|
Polypropylene |
— |
100 |
— |
— |
— |
— |
|
Polystyrene |
27 |
— |
73 |
— |
— |
— |
|
Phenolic |
— |
— |
70 |
— |
— |
30b |
|
Epoxy |
— |
37 |
44 |
— |
— |
19c |
|
PVC |
43 |
— |
— |
57 |
— |
— |
|
Cellulosea |
12 |
— |
— |
— |
75 |
— |
|
a Cellulose triacetate assumed for calculations. The figure would be 100% for cellophane. b Carbon, oxygen, and hydrogen. c Oxygen. |
||||||
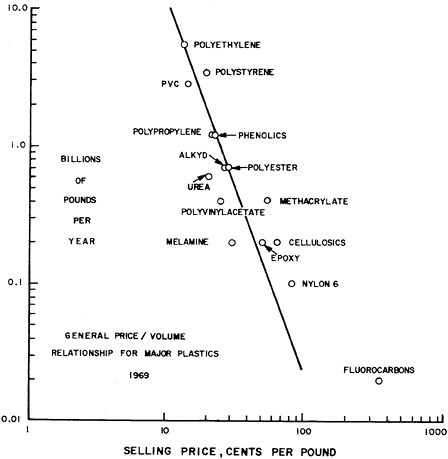
TABLE 7.11 Common Fabrication Methods for Plastics
|
Casting (curing of liquid components in a mold) Compression molding Transfer molding Injection molding of thermoplastics Extrusion Calendering Blow molding (for hollow shapes such as bottles) Thermoforming of plastic sheet with vacuum with pressure Rotational molding (for hollow shapes such as gasoline tanks) Slush molding (with chopped glass fiber—polyester resins) Injection molding of thermostats Matched die molding of glass reinforced plastics Hand lay-up of glass-reinforced plastics followed by heat curing |
Plastics as used for engineering purposes are usefully considered in terms of two major classes—engineering plastics and composition. Engineering plastic materials are specific polymers that have a combination of properties—strength, temperature resistance, solvent resistance, creep resistance, etc. —which permits them to be employed for structural purposes in engineered end-applications. Such materials are nylon, polyacetals, teflon, polycarbonates, polyphenylene oxide, etc. Composites—as the name implies—are mixtures of polymers or of polymers and inorganic materials in physical forms and ratios designed to develop specific properties:
-
Fiber-reinforced thermoplastics and thermosets: Glass fibers in the form of chopped fiber, continuous roving, and cloth are used to reinforce plastics of both thermoset types: polyester and epoxy, as well as in thermoplastics such as polyethylene, polypropylene, polystyrene, nylon, etc.
-
Rubber-reinforced (high impact) polymers: The toughness of brittle plastics such as polystyrene, polymethyl-methacrylates, and PVC can be enhanced by blending the plastic with an unvulcanized rubber (elastomer).
-
Polymer/polymer blends: Polymer/polymer blends are used to improve one or more of such factors as cost, melt processing or physical properties. Since any two polymers are typically incompatible, a rather complex two-phase morphology results. The MSE aspects are similar to those for rubber/plastic blends.
-
Metal/plastic laminates: A laminate of aluminum sheet and an ethylene-acrylic acid copolymer (for good adhesion) is used as cable sheathing for power and communication cables. Ease of fabrication plus enhanced properties are achieved. A sandwich made of two sheets of metal with an inner core of a plastic having high internal friction is an efficient sound deadener. As with a metal skin on a foamed plastic core, sandwich panels provide a high section modulus, thermal insulation, gas barrier, and light weight.
-
Plastics in concrete: The brittleness of concrete can be overcome to some extent by incorporating fibers such as nylon and glass, polyethylene particles, or latex.
In its utilization of technical manpower, the plastics industry has traditionally employed the following professionals in the role of materials scientists and engineers:
|
Organic Chemists |
Mechanical Engineers |
|
Analytical Chemists |
Microscopists |
|
Physical Chemists |
Plastics Engineers |
|
Physicists Polymer |
Chemists and Physicists |
Sixteen plastic producers list the following distribution of personnel in their R&D operations:
|
1% |
Biochemists |
|
26% |
Chemists |
|
7% |
Chemical Engineers |
|
1% |
Mathematicians |
|
1% |
Physicists |
|
22% |
Other Professionals |
|
27% |
Technicians |
|
15% |
Other Support |
Finally, in considering long-term ecological aspects of the plastics industry, it is important to recall that the major raw material in plastics has shifted from cellulose to natural gas and petroleum. The trend away from cellulose as a base has been largely an economic one arising from the cost of raw materials and the high capital investment involved in converting natural cellulose to moldable plastics. The average selling price of cellulose plastics (excluding cellophane) is about 65c/lb. compared with an average of 20c/lb. for all plastics and 13c/lb. for polyethylene. It appears unlikely at the present time that, in the absence of legislation based on ecological considerations or a dramatic change in price or availability of petroleum, the plastics industry will expand the use of cellulose derivatives, cellophane film, and chemically-treated wood. Nevertheless, it is worth noting that the greater use of cellulose could have the following effects on ecology in addition to conserving petroleum:
-
Newsprint and waste cotton fabric might be recycled to become a raw-material base for plastics.
-
Cellulose-rich plastics might be more biodegradable than hydrocarbon or chlorohydrocarbon polymers.
-
At the same time, other ecological aspects might be worsened such as greater use of insecticides and fertilizer in the growing of cotton or wood as a raw material for plastics.
Examples of Major Materials-Using Industries
In a very real sense, no industry is independent of materials to construct or produce its products—whether goods or services. Thus, the limited number of industries described in this section have been selected for attention because they illustrate the different ways in which materials enter into the manufacturing process and they also represent key sectors of
U.S. industry. The order in which they are discussed—electronics, electric lamps, containers, automobiles, and construction—corresponds both to an increasing scale of the product involved, and to a shift of emphasis from electrical to mechanical properties in designing materials for the product.
Electronics Industry
Illustration of the Role of Materials Science and Engineering: Even before the invention of the transistor in July 1948, electronics was a substantial industry with an emerging area of manufacture and application of several semiconductors. In fact, a large effort had been exerted on silicon and germanium during the late 1930’s and during World War II, principally in support of detector and mixer technology at radar frequencies. Thus, knowledge of the science and technology of both silicon and germanium had become rather advanced both in this country and abroad. However, the 1948 announcement of the first transistor by Bardeen and Brattain at Bell Telephone Laboratories initiated a new era unique in the interplay it engendered between science and technology and between materials and device concepts, a phenomenon that has characterized the industry now for a quarter of a century. This interplay has been complex because of the great number of device requirements and the variations of materials, designs, and processes to be controlled to widely different parameters and to close tolerances. What has resulted is a variety of new electronic materials, new devices, and a wide variety of applications that have had major impact on man’s situation in the world and his perception of it.
The current period has been variously called “the computer age,” “the space age,” and “the age of communications.” All of these now-familiar features of the present world have depended crucially on the transistor, and have greatly influenced the character of warfare, international politics, and advances in the automation and control of production processes. The understanding of the solid state that has come as a byproduct of these developments in the electronics industry may turn out to be an even greater contribution. Because of this general importance, it is useful to examine some of the technical developments that have led to this understanding.
In the same year that the invention of the transistor was announced, and in the same Laboratories, Teal and Little began experiments to grow large single crystals of high structural perfection in germanium by a pulling technique to test their idea that grain boundaries and other defects normally present masked the desirable electronic properties. Buehler and Teal also improved the purity by repeated recrystallization methods. These single crystals had, as well as improved uniformity, such strikingly new and different properties in contrast to polycrystalline germanium as lifetimes of minority carriers 20–300 times greater and mobilities 3–4 times greater. Analogous success was attained in early 1951 with preparing single crystals of silicon.
With the development of useful devices, the demands for these high-purity materials increased sharply. Satisfaction of these demands was greatly simplified, in 1951, when Pfann developed a method particularly appropriate for production—the process of zone refining—in which a
molten zone is repeatedly passed through an ingot by relative motion between the heat source and the crystal. By the middle 1950’s, this identification of the importance of purity was requiring measurement techniques never before considered feasible for routine materials scrutiny, namely, a sensitivity of one part per billion (equivalent to detecting three people in the earth’s population).
The first transistor was an experimental triumph in that it was not really clear what processes were actually taking place at the all-important conductor point brought into contact with the semiconductor material. However, during the next year (1949), Shockley analyzed the rectification in p-n junctions and showed the possibility of obtaining transistor action using p-n junctions in bulk material. In response to this development, Sparks devised a unique method for preparing p-n junctions by modifying the Teal-Little crystal-pulling apparatus to allow controlled addition of impurities during crystal growth; the resulting new kind of transistor was first prepared in 1950. These single crystal materials not only provided a revolutionary electronic device, but also gave media sufficiently perfect to test the validity of solid-state theories, and so further their development. The same basic techniques of making multiple junction structures was applied later to silicon, then a more difficult material to work with than germanium, and was the exclusive method for making commercial silicon transistors, beginning in 1954, for several years.
In 1950, an alloying technique was used successfully to prepare single p-n junctions in germanium by Hall and Dunlap of General Electric, and Saby prepared p-n-p transistors in the same manner. Application of the alloying technique to silicon was delayed until an improved silicon purification technique, floating-zone refining, was developed by Theuerer (and independently by Emeis and Keck). Pfann’s initial zone-refining method could not be used on silicon because of interaction between the molten silicon and its containing boat. However, other experimenters conceived the idea of setting up a stable molten zone in a vertical rod of material by virtue of surface tension, which meant that zone purification could then be extended to silicon. (Diffusion processes rapidly displaced alloying techniques and alloyed silicon transistors never became as significant as in the earlier application to germanium.)
Engineering demands to make semiconductor devices operate at higher and higher frequencies stimulated work on materials processes that would provide the smaller and smaller geometries that were required. Following original work of Fuller at the Bell Telephone Laboratories and Dunlap at General Electric, the Bell Telephone Laboratories published in early 1956 descriptions of both germanium and silicon transistors made by diffusion techniques. The combination of diffusion technology with the earlier processes, and the device designs made possible by the new approach, produced a wide variety of innovative devices of increasing performance.
During the next year or so, two particular milestones in materials technology were passed which were of special importance in the light of later events: (a) the observation by Frosch that a thermally-grown oxide on silicon impeded the diffusion of certain impurities, coupled with photographic masking against etching, provided a powerful tool for silicon processing; and (b) the studies by Dash of dislocations in silicon resulted in developing methods for growing silicon single crystals with essentially no
dislocations.
In June 1960, the Bell Laboratories announced a new method of fabricating transistors using epitaxial single crystals grown from the gas phase with controlled impurity levels. The advantages of this method broke the 12-year-old requirement of having to start with a high-purity crystal and then add impurities in a controlled manner to obtain the characteristics required in the device.
In 1958, Kilby (Texas Instruments) fabricated the first integrated circuit. This concept made possible the implementation of many functions on a single chip of silicon, viz., the elements of a complete circuit, such as resistors, capacitors, transistors, and diodes. Key modifications to the technology already developed for discrete devices included diffusion through the epitaxial layer of an integrated circuit to provide the high resistance of a reversed-bias p-n junction as isolation for adjacent devices and the MOS concept. The field-effect device proposed originally by Shockley, and now called the MOS transistor—for metal-oxide-semiconductor transistor— became possible because of advances in materials surface-treatment techniques; for some applications, the MOS technology, because of its low-power requirements, high-packing densities, fewer processing operations, and other characteristics, turns out to be markedly superior to the conventional bipolar technology. Now, after little more than a decade, the integrated circuit has evolved from Kilby’s primitive phaseshift oscillator to the high-production manufacturing of circuits with over 10,000 components apiece.
The preceding discussion provides an illustrative example of some of the significant advances made in electronic materials. It is confined to semiconductor work with the two significant elemental materials, germanium and silicon; and dwells principally on the beginnings through the 1960’s with only sketchy reference to the recent years. Nevertheless, the outline does demonstrate the tremendous degree to which the materials technologist has achieved control of electronic materials: for example, the extremes of purity; the control over doping at very low levels; the variety of techniques for creating junction structures by introducing impurities at exactly the right positions in the lattice and with very close tolerances on their positions and concentration profiles; the intricate combinations of single-crystal regions in device structures; crystals of high structural perfection; crystal-growth techniques.
An additional, but especially important, point is the cross-fertilization effect for research on other classes of materials. For instance, the extended study of semiconductor crystals has increased understanding of the mechanical behavior of structural materials; dislocations were first seen in semiconductor materials, and much of our direct knowledge of defects in solids was obtained initially from studying these materials. The creation of dislocation-free crystals was of great significance for the scientist and engineer working with nonelectronic materials.
At the time of the invention of the transistor, solid-state physics was a minor part of physics, but now it is the largest single subfield of physics. The present sophisticated understanding of the electronic structure of solids grew from the semiconductor work, first on carrier behavior and then followed by the study of band structure.
An unique aspect of the advances in electronics materials described
above is the pace. As indicated by the sequence of dates, achievement after achievement crowded one upon the other, somewhat reminiscent of the urgency of wartime development of technology. During the decade when the principal production consisted of discrete devices, process gave way to process in such quick succession that manufacturers hesitated to invest in technically possible mass-production equipment because it might become obsolete in literally a few months. Although the normal research communication media of journal publications and seminars continued to be used, the visit and the telephone seemed to have become the mode of exchange among scientists, metallurgists, engineers, and the many varieties of production people. In this mode, it is often difficult to determine in which of the conventional disciplines a given individual is acting. An additional feature was that the sequence of invention often was reversed from the older concept of first conceiving the device and then developing the material which makes it possible; in many instances, it was research on semiconductor materials that laid the basis for a new device design.
Some Characteristics of the Electronics Industry: Figure 7.10 shows the values of shipments of electronic components by U.S. manufacturers for the years 1960–1970. These particular components can be regarded as the major ones in the industry. The various curves are mutually exclusive except that the “monolithic integrated circuits” are also included in the data for the more general “integrated circuit packages.” The most important components on the basis of 1970 values are seen to be the “integrated circuit packages” and “semiconductor devices;” each being close to $900 million. Next, fairly tightly grouped, are: TV picture tubes, $464 million; capacitors, $440 million; resistors, $365 million; connectors, $346 million; power and special purpose tubes, $337 million; transformers (and reactors), $335 million; relays (for electronic applications), $271 million; and receiving tubes, $212 million. Finally, having declined in relative importance over the 1960’s, are quartz crystals at $45 million.
The shapes of the curves shown in Figure 7.10 are especially significant as indicators of the stage of maturity of a given device. Thus, the topmost curve for most of the decade, semiconductor devices, displays the characteristics of a “mature” industry—the leveling-off being associated with its partial replacement by integrated-circuit packages. Its principal predecessor, receiving tubes, is past maturity and is now steadily declining. It is interesting to note that the power and special purpose tubes, which are not as easily replaced by semiconductor devices or integrated circuits, still maintain an upward trend. For the TV picture-tube curve, the unusual shape arises largely from the superposition of two curves—black and white TV picture tubes and color TV picture tubes. In 1970, total shipments were about 9 million tubes (3 million black and white and 7 million color), and the ratio in per-tube value had declined to about 4.5.
Six classes of components appear to be holding essentially steady growth. These are capacitors, resistors, power and special purpose tubes, connectors, transformers (and reactors), and relays. All had comfortable growth experience with no prominent peaks, starting the decade in the range from $169
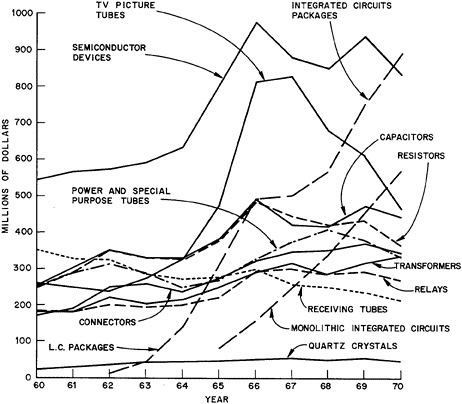
million to $255 million and ending in the range from $271 million to $440 million.
The most spectacular curve in Figure 7.10 is that for integrated circuit packages, which is roughly paralleled by its subclass, monolithic integrated circuits. Starting at $14 million in 1962, integrated circuit packages achieved a rapid climb to $888 million in 1970, an average increase per year of almost 68 percent for eight years. Monolithic integrated circuits started at $85 million in 1965 (the first year for which statistics are available) and reached $576 million in 1970, an average increase per year of almost 47 percent in five years. Over this same period of five years, the whole integrated circuit class averaged 23 percent growth per year.
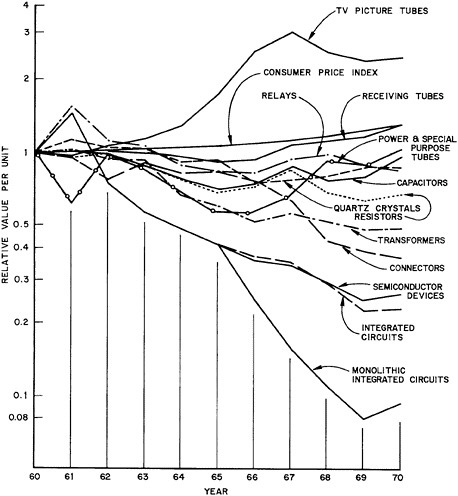
Whereas value of shipments is a useful industry measure of a components sector performance, from the users’ point-of-view the better measure is price for comparable quality and quantity. Such a measure is indicated in Figure 7.11, where all unit values for the components are normalized to unity in 1960. For reference, the analogous consumer prize index is also plotted to provide a measure of inflation over the period. A significant general characteristic is the stiffening of per-unit values from 1969 to 1970, when curves tend to change slope toward a positive direction. As in the previous figure, the most distinctive behavior is exhibited by integrated circuits; assuming that this sector branches off from the parent semiconductor devices in 1965, the equivalent per-unit value declined by 1970 to less than one-tenth that of 1960. Even the semiconductor devices, which have a history of continuous decline in unit-value over the whole decade, still have a per-unit value in 1970 of 26% compared with the value in 1960.
Processing of Semiconductor Materials: The most commonly used semiconductor material in the electronics industry is silicon. Next to oxygen as the most abundant element, silicon makes up about one-fourth of the crust of the earth. Not found in elemental form, it occurs chiefly as the oxide, silica (SiO2), and as various silicates in such familiar forms as sand, quartz, rock crystal, amethyst, agate, flint, jasper, opal, etc. Almost without exception, the type required by the electronics industry is monocrystalline, high-purity silicon; this is prepared by reducing silica with carbon to produce metallurgical grade silicon (98–99% purity), as the usual “raw material” for the electronics industry.
The characteristics of semiconductor materials that make them useful in electronic devices are profoundly influenced by impurities. Controlled addition of desired impurities (dopants) in the range from 0.001 to 100 parts per million (in silicon) to the high-purity host material causes it to become either a p-type (positive holes being the majority carrier) or n-type (negative electrons being the majority carrier) conductor. In “bipolar” transistors, certain sensors, and diodes, the electrical behavior of the junction between p-type and n-type materials accounts for the basic function of the particular device. Accordingly, semiconductor-device technology is focused principally on the controlled doping of materials and the formation of junctions between materials of different impurity concentrations while maintaining a continuous single-crystal structure, without appreciable defects, from one side to the other of each junction.
For the preparation of multiple junctions, successive dopants are added
by diffusion; the silicon slice is held at a temperature in the range from 900 to 1300° C (depending on the dopant and the desired results), and a carrier-gas bearing the impurity is passed over the slice. Diffusion depth and concentration are controlled by the time and temperature of exposure as well as by the chemistry of the dopant gas.
To provide insulation between layers or to install a mask against a succeeding diffusion, silicon dioxide is grown on the silicon surface by heating the silicon and exposing it to oxygen or steam. Selective diffusion or placement of a contact is done by cutting a window through the silicon dioxide layer to get at the semiconductor surface. (A similar process is used to etch selectively the metallized layers into the desired configurations of electrical conductors.) To make ohmic (nonrectifying) electrical contacts on the semiconductor material or electrical conductors, aluminum or gold is vacuum-evaporated onto all exposed surfaces.
By a succession of steps like those described above, hundreds of microscopic, intricate circuits made up of transistors, diodes, resistors, and capacitors are created on a single 2-inch slice of single-crystal silicon. The representative processes discussed show how the steps of material processing, device design, circuit design, and system design have been telescoped and blended so that one activity often cannot be distinguished from another.
In contrast to these developments in integrated circuitry, which are focused on the task of packing more and more components (of the order of 10,000) into tiny chips of silicon, progress in another branch of silicon technology has led to large discrete devices capable of controlling power in the 10 to 100Kw range. The basic element used to perform this function is the thyristor, the semiconductor analog of the gas-discharge thyratron. Thyristors range in size from those used in light dimmers and speed controls for home appliances up to large industrial devices capable of controlling load currents of hundreds of amperes at a thousand volts or more. They are now being used to rectify and invert power for DC transmission lines at the 100Mw level.
The applications for individual semiconductor devices and integrated circuits are increasingly requiring improvement in the economics of materials usage as well as in performance and reliability. To reduce overall process costs in integrated circuits, the trend is toward 3-inch or larger diameter starting crystals. Such large diameters are generally achieved by pulling the crystals from quartz crucibles—a technique that serves the larger part of the semiconductor market. For the thyristor, in order to avoid the traces of oxygen found in crystals pulled from quartz, long-lifetime float-zone material is used almost exclusively. Since the working current that can be controlled by a single thyristor is limited by the diameter of the starting crystals presently available, there is strong incentive for obtaining material of the highest quality in purity and homogeneity together with still larger diameters. Such enhancement in quality may also lead to improved electrical performance in terms of higher voltage ratings.
Another illustration of the critical dependence of device performance upon material quality is afforded by the semiconductor detectors used for measuring the energy spectra of nuclear particles. For example, gamma-detectors consist of germanium p-n junctions, reverse biased, and operated at liquid nitrogen temperature; the absorption of a gamma ray produces a pulse
of current whose amplitude gives an accurate measure of the energy of the gamma ray.
Until recently, a process extremely difficult to control reliably—the lithium-drift process—had to be invoked as a means of compensating residual impurities in order to obtain the very thick depletion regions that are required for high sensitivity in this device. The new availability of germanium crystals of increased purity (large, highly perfect crystals, containing less than 1 part in 1012 of residual electrically active impurities) now make it possible to fabricate the equivalent detector structures without the attendant pitfalls that have beset the lithium-drift process. The development of material of this unprecedented level of purity depended on new approaches to the detection and elimination of trace impurities, along with significant advances in the techniques of measurement and characterization.
Figure 7.10 shows a 1970 value of $832 million for semiconductor devices. Of this total, $172 million represent “special and light-sensitive semiconductor devices,” many of which are made from compound semiconductors— mostly from the chemical groups III and V. Compounds of the II–VI and IV–VI types are also receiving some attention. The devices in this area include infrared detectors, electroluminescent devices, electron-emission devices, thermoelectric devices, microwave devices, high-power laser windows, and solar cells. The following paragraphs outline some of the key materials features involved in such solid-state products.
Infrared detectors, developed initially for military use, are now finding more general application. The ability of these devices to delineate heat sources makes them useful in such techniques as specialized geographical mapping from aircraft and in clinical detection of human abnormalities. The relevant electronic materials of current importance are indium arsenide, indium antimonide, mercury-cadmium telluride, lead-tin telluride, doped germanium, and doped silicon. The specific choice for a given application depends principally upon the desired wavelength range of sensitivity, which in turn depends upon the characteristics of the radiation emitted from what is to be “seen.”
Electroluminescent devices utilize the phenomenon that when current is passed in a forward direction across a p-n junction in certain III–V compounds, radiation of optical wavelength (sometimes in the infrared) is emitted. Optically, this can be handled by collecting the light incoherently, or a laser beam can be generated along the junction. The present light-emitting diodes (LED’s) that exploit such effects are made from gallium arsenide, gallium phosphide, alloys of gallium arsenide-phosphide or of gallium-aluminum phosphide. With the gallium arsenide, which is the LED material, infrared emissions can be produced at room temperatures with an efficiency ranging from 10 to 30 percent. The LED’s of brightest visibility are in the red-yellow-green range. In the case of room-temperature laser diodes (which are now made of gallium arsenide and aluminum-gallium arsenide alloy), the critical processing technique is to form a heterojunction to guide the growing optical wave that constitutes the laser beam. In the optimum process, instead of changing just the nature of the dopant (which is measured in only parts per million) from one side to the other of the junction, alloys of varying composition are deposited exitaxially to form the heterojunction directly.
Electron-emission devices are long familiar in that, for several decades, many different electronic devices have depended on emission of electrons from solid surfaces into vacuum; the most familiar example is the vacuum tube with its heated cathode. Two newer ways of causing emission at the cathode (photoemission) and the impact of electrons liberated in this process on further electrodes (dynodes) causes secondary emission. However, the fundamental problem in all three kinds of emission from surfaces is the same: more emission is desired with the same or less energy. Progress in overcoming this problem has been achieved through semiconductor technology, where its “principle of effective negative electron affinity” (NEA) has already improved the performance of photomultiplier tubes an order of magnitude over what was possible with the older photocathodes. As a result, photomultiplier sensitivity is reaching into the infrared wavelengths of low photon energy.
Thermoelectric generators were originally attractive because of the possibility of high conversion efficiencies in devices which have no moving parts, operate silently, and require little maintenance. However, in practice, efficiencies have reached only some 10%, and 5 to 7% is more common. Nevertheless, in spite of high cost and low efficiency, numerous important applications have been found where remote, unattended power sources are desirable. Good examples are telephone repeaters, unmanned lighthouses and navigation buoys, space satellites, and scientific instruments on the moon.
In the case of microwave devices, relatively conventional semiconductor units already serve in a number of applications—compact power sources, amplifiers, mixers, and demodulators. More recently, the special property of gallium arsenide, negative differential mobility, has provided a new dimension for the design of microwave devices. Thus, while silicon transistors and trapped-plasma-avalanche-transit-time (TRAPPAT) oscillators can operate effectively up to about 4 GHz, gallium arsenide devices take over—on the basis of noise, power, bandwidth, and efficiency—up to approximately 30 GHz (millimeter waves). These devices operate as transferred electron oscillators (TEO) in either the domain (Gunn effect) or limited-space-charge accumulation (LSA) modes and as Schottky barrier (SB) impact-ionization-avalanche-transit-time (IMPATT) oscillators. Most gallium arsenide microwave devices require an epitaxial layer 0.5 to 20 microns thick on the arsenide substrate, which itself must have a low density of defects in order to avoid their propagation into the thin layer. Gallium arsenide mixer diodes, while competing with silicon diodes in the 2 to 10 GHz range, are used exclusively in the millimeter range because of superior noise figure and conversion-loss characteristics. Gallium arsenide variable capacitance (varactor) diodes are employed currently as low-noise, radio-frequency amplifiers and as nonlinear elements in frequency-multiplication channels of digital communication systems; an anticipated new application is for UHF television tuning.
Windows for high-power lasers is an increasingly important application for semiconductor compounds. As greater and greater optical powers are designed into lasers, sometimes many megawatts per square centimeter, interactions between the beam and the material through which it is transmitted occur and failure of the material results. The most common failure mode is thermal fracturing caused by stresses due to thermal gradients, although sometimes the heating causes failure by melting and flowing. Gallium arsenide, unlike most materials used for windows, resists such failure modes and is
stable until dissociation occurs at extreme loading. Currently, the wavelength ranges in the infrared of most importance are 2 to 6 microns (which is receiving most of the attention) and the region around 10.6 microns of the several alkali halides, II–VI and III–V compound semiconductors, germanium, and three commercially available infrared materials explored as window materials; monocrystalline gallium arsenide with resistivities above 104 ohm-cm looks especially promising.
Solar-cell conversion is almost unique among power-generation processes in not causing thermal, gaseous, or particle pollution; consequently, interest in terrestrial application is strong. The major barrier is the high cost of making solar cells; this cost would have to be reduced to about a hundredth or even a thousandth of the present level to make such devices economical. Unfortunately, progress has been slow and over the last ten years efficiencies of silicon cells have improved only by about 20%. A possible hope for terrestrial applications is the II–VI semiconductor, cadmium sulfide, in that it can be used in polycrystalline form for solar cells and, because single-crystal technology is not required, may overcome the cost problem. The photovoltaic mechanism in this material is still not well understood, and cells made by a wide variety of techniques all seem to end up with the same properties and operational characteristics. For space application, the III–V semiconductor, gallium arsenide, which has been explored as a solar cell material for 15 years, compares favorably with silicon in the two desirable space characteristics of radiation resistance and high-temperature operation (to 250° C), but such devices would cost at least ten times as much as current silicon cells.
Challenges in the Application of Solid-State Materials: Despite the revolutionary advances that have been made in electronics solid-state materials for use by industry, a number of major problems remain to be resolved. This section identifies the most critical of these items and indicates the current state of progress.
First, there is an urgent need for a better awareness and scientific understanding of the interplay between materials, processing, and device technology. From the point-of-view of materials, this understanding rests heavily on characterization. It is no longer sufficient to effectively characterize only the starting materials, but also to apply the techniques necessary to measure all the useful attributes of the subsequent device materials throughout the whole manufacturing sequence to the finished product. Although the ultimate reason for applying materials in the electronics industry is to insure effective performance of a device or system in service, too often the thinking that starts with materials research and ends with the operation of the complete system is too compartmentalized. The materials specialist tries to meet the specifications set by the device expert, who in turn aims to satisfy the circuit designer, who is trying to fit his designs into the subsystem, etc. As a result, there are too many “catalog” items used in each sequence rather than an overall optimization. Since the overall goal is, in fact, maximization of performance for minimum total cost (that is, the ratio Performance/Annualized Cost of Manufacture, Installation, Operation, and Maintenance), it would appear that
increasing this ratio requires some concentration on the final performance from the very beginning. One procedure that would help make this happen is field-failure reporting and analysis—both during initial development of the device or system and also during commercial operation so as to continue the improvement. As an example, hybrid systems, the interconnections of similar and different integrated materials subsystems, are currently expensive to fabricate. If batch processing from the raw materials to final assembly were planned as early as the applied research on a given hybrid system and applied during development rather than deferred to pilot production, cost reduction could be expected from lower initial costs through greater yields, and also from lower annual service cost due to increased reliability through better process control.
Some broadly applicable materials areas which require improvements are the following. Research on the effect of so-called nondoping impurities such as oxygen and carbon is needed to clear up many anomalies observed during processing. Thus not enough is known about the theoretical and practical limits of parameters like minority and majority carrier lifetimes as a function of impurity content. Likewise, continued research effort is required on the potentially useful class of amorphous semiconductor materials; without basic understanding of their behavior, device work is likely to be premature and wasteful. With respect to measurements, more effective methods are needed to determine the chemical purity and electrical characteristics of silicon at all stages of manufacture from raw chemical input through polycrystalline deposition, single crystal growth, and epitaxial deposition. In-process control measurements incorporating nondestructive testing and “adjust” techniques (like electron-beam or laser-beam testing) could increase yields and produce better devices. In addition, since the precise measurement of epitaxial-layer thickness and resistivity becomes progressively more difficult as the layers become thinner with advancing device technology, the development of improved rapid, nondestructive methods for characterizing such thin layers would be of substantial value in almost all device developments. In connection with processing, the preparation of silicon slices by sawing, lapping, and polishing wastes more than half the starting material, and more economic slice-producing methods are needed both for existing and newer applications. For example, to reduce parasitic capacitance (thus increasing speed) in MOS and bipolar circuitry, an economic supply of very thin silicon on insulating supports is essential. In the fabrication of materials and devices, much more use could be made of particulate radiative methods for planned introduction of defects—as by ion implantation, sputtering, or electron-gun evaporation. In particular, ion implantation can lead to device characteristics that cannot be achieved with more traditional processes. For the preparation of conducting films, present methods of applying metals in device fabrication, assembly, and packaging are far from satisfactory in that the high-temperature processing steps tend to be destructive to present metal systems. The phenomenon of ohmic contact remains little understood. Passivation films in the form of improved dielectrics that can be deposited at low temperatures are needed and better film-characterization techniques have to be found for silicon nitride, silicon dioxide, and aluminum oxide. The availability of a truly hermetic low-temperature passivation layer would markedly improve the reliability of semiconductor devices and reduce packaging costs.
As device geometries continue to shrink in size, new processing problems appear. Consequently, imaging technology to transfer mask and other configurations of the order of one micron and below will have to be mastered within a few years. Again, dielectric-silicon interfaces become more critical because impurity and structural defects at these boundaries can dominate the electrical behavior of the device. Finally, in this listing of processing problems, it is important to point out that packaging and testing before and after packaging account for a large part of total device cost. In this light, research and engineering expended on these tasks is likely to have considerable benefit on both cost and reliability.
Turning now to specific devices, the following notes delineate research problems or development areas that require particular attention. In electron-emission devices, laser applications would benefit by increasing photocathode response at 1.06 micrometers (for neodynium-doped yttrium aluminum garnet) and by extending the long wavelength response to 1.6 micrometers (for eye-safe erbium-doped yttrium aluminum garnet). Applied research on III–V alloy systems is a promising approach for the first objective; exploratory materials research is required for the second. To attain the transmission mode required for imaging applications of electron-emission devices, thin crystal layers will have to be grown on a substrate transparent to the incident radiation. Moreover, a heterojunction technology having a graded alloy region between the substrate and photocathode material has to be developed. In spite of a trend from vacuum electronics to the solid state, a real need persists for a practical cathode capable of operating near room temperature and at high current densities. To meet such a need would appear to require appropriate research on III–V semiconductors and their alloys.
In microwave-device research, improved reliability and higher yield of gallium arsenide devices are important goals. Related to these is an obvious role for better correlation between device performance and materials properties.
In thermoelectric research, the major problems common to all telluride alloys are related to their poor mechanical properties and chemical instabilities. Particular difficulty is encountered in fabricating contacts with these alloys at the hot junctions of power-generating thermocouples.
For high-power laser windows, the solution of the failure problem seems to lie in gallium arsenide developments, although this is sufficiently uncertain of success that it should be backed up by exploratory research on other materials.
For solar cells, improvements in resistivity and lifetime of the starting silicon are essential. Again, developments of new materials applications may also point the way to significant terrestrial application of these devices.
Infrared detectors, in contrast to the above two kinds of devices, operate so close to ideal performance when made correctly that there is no real need for exploratory research on new materials. Instead, effort is required in the processing to maintain stoichiometry, structural perfection, purity, and chemical homogeneity.
Electroluminescent devices, somewhat like infrared detectors, are being made out of satisfactory material, provided that red and orange-yellow-green are acceptable colors; but chemical purity, crystal quality, and limitations of seed substrates need considerably better control.
In magnetic materials, ferrite and ferromagnet properties depend on the nature of inhomogeneity and aggregation, which are inadequately characterized with present techniques. Single-crystal ferrites particularly require better characterization, and fabrication methods for new high-energy-product ferro-magnetic materials are inadequate.
In the new magnet-bubble technology, both the fabrication and the characterization of the propagating material are still difficult, and methods of detection of the magnetic bubbles need improvement.
In composite structures, the chief problem is the characterization and understanding of defect and impurity interactions in insulating films and at insulator-metal, insulator-semiconductor, and insulator-insulator interfaces. Particular examples are the influence of hydrogen on silicon dioxide, doping at insulator-semiconductor interfaces, the effect of the metal-insulator interface on metal-insulator-semiconductor device properties, surface charge buildup on insulating layers, lack of integrity of metal and insulating films, measurement of film and interface properties, and metal systems for contacting semiconductors. Other problems are the development of nonsilicon systems for special purposes and the development of ambient gas and pollutant detectors.
Among the needs in inorganic dielectric materials are optical materials for information storage and display, glasses and crystals suitable for communication networks at optical frequencies, improved dielectric materials at microwave frequencies, better dimensional stability in materials for filters and resonant structures at optical and microwave frequencies, adequate substrates for growth of single-crystal films, and higher dielectric-constant and dielectric-strength materials for capacitors.
Finally, in organic dielectric materials, problems lie in uniformity, purity, reduction of voids, compatibility with associated materials, insufficient thermal conductivity, the difficulty of making thin sheets, films, and coatings, microcharacterization, the number of different materials in use, and stability. Stability must be maintained relative to temperature and mechanical changes. In certain applications, the organic material must also display stability against moisture and oxygen transmission.
Electric Lamp Industry
The devices by which electrical energy is converted into light originated with the carbon-arc lamp. The more convenient and more broadly applicable method of illumination created by Edison’s invention of the carbon filament or incandescent lamp in the 19th century rapidly transformed domestic and public lighting away from the earlier gas lamps. The range of contemporary lamp types includes discharge, fluorescent and photoflash lamps. However, as shown by Table 7.13, the incandescent lamp (using a tungsten filament) continues to be the dominant device produced by the lamp industry.
In all of these lamp types, the availability of suitable materials has been critical to the device function. The actual materials involved are few in number and relatively modest in the amounts consumed by the industry (see Table 7.14). Nevertheless, each performs a unique function, and the
TABLE 7.13 Lamp Production for U.S. Market, 1969
|
Type |
Volume (millions of units) |
Value ($ millions) |
|
Incandescent Lamps |
1480 |
264 |
|
Automotive Lamps |
602 |
44 |
|
Fluorescent Lamps |
254 |
165 |
|
High-Intensity Discharge Lamps |
6 |
37 |
|
Photoflash Lamps |
1452 |
105 |
|
The overall growth rate of the lamp industry is approximately 4% per year. The total employment is 40,000-50,000. |
||
successful evolution of the industry has been controlled in large part by the developments in materials processing and performance. The following paragraphs illustrate some of the material characteristics for each of the major types.
It is obvious from the high-technology content of electric lamps, and particularly from the great importance of the relevant materials, that materials scientists and engineers are key people in this field. There are no specific statistical figures available, but an approximate estimate is that there are 300–500 professionally trained people engaged in work closely related to materials technology in the U.S. lamp-producing industry.
In the original carbon-filament lamp, the most critical and obvious materials problem was the provision of the filament itself. In practice, many materials problems had to be solved before the Edison lamp became reliable and reasonable in cost. Thus, a suitably transparent glass had to be fabricated to the desired envelope shape and thickness, by a processing technique suited to high-speed production. Suitable seals had to be developed so that the electric power could be led to the filament inside the evacuated envelope. The transition to the modern incandescent lamp using a tungsten filament required the development of a material and a powder-metallurgy process that would provide a metal with sufficient ductility so it could be drawn into the fine wire needed for filaments and would retain its integrity over a long operational life. The advantage of the tungsten filaments was in their ability to operate at higher temperatures compared to carbon filaments, resulting in more light in the visible wavelength range per watt-hour of energy expended.
Despite the substantial technological advance with this type of filament, a major limitation on the life of tungsten lamps has been the progressive thinning and eventual failure of the filament due to evaporation of the tungsten at the elevated operating temperature. To overcome this problem, a small amount of a halogen is included inside the lamp envelope. In the so-called iodide or halide cycle, when tungsten is deposited on the lamp envelope, it subsequently chemically combines with the halogen to form a volatile tungsten halide. These halides, however, are unstable at the higher temperature of the lamp filament. When a molecule of the halide comes into contact with the lamp filament, it is decomposed, redepositing the tungsten on the lamp filament and regenerating free halogen to transport more tungsten from the envelope to the filament. In this way, the envelope wall is kept clean, the filament can be operated again at higher temperatures, and the light output per watt is increased. Today, tungsten-filament incandescent lamps are in extensive use—in particular, for household illumination and for headlamps and other lamps in automobiles. It is interesting to note that the use of lamps in automobiles has increased from the initial two headlamps and a tail-light to more than 20 lamps per automobile.
In discharge lamps, light is produced by electronic transitions in the plasma of an electric arc. A typical high-pressure mercury lamp consists of a 400-watt arc inside a fused-quartz arc tube, which in turn is encased in an outer glass envelope. A small amount of fluorescent material (phosphors) is placed on the inside of this envelope in order to convert part of the 365 nm ultraviolet mercury line to visible light. Otherwise, the useful light from a mercury vapor lamp is confined to the four longer wavelengths: 405,
436, 546, and 578 nm.
It is the higher bulb temperature of these discharge lamps that requires the use of vitreous silica (or “fused quartz”), which is substantially pure SiO2, rather than conventional glasses. Nevertheless the operating efficiency of these lamps has been restricted by the “materials problem” arising from the corrosion resistance and operating temperature limitations of the fused quartz. In about 1955, the use of an improved envelope material became possible in that research led to new understanding of the factors controlling sintering and then to the development of processes for making aluminum oxide (corundum) with theoretical density. The essential discovery was of additives that would reduce grain-boundary mobility, in order to avoid the normal exaggerated grain growth. (This discontinuous grain growth results in a porous ceramic which appears white because incident light is scattered.) A pore-free ceramic transmits well over 90% of the incident light. Furthermore, corundum has a much higher melting point than does silica glass, and is much more resistant to attack by alkali metal vapors. Hence, the availability of pore-free alumina allowed for improved lamps as well as other kinds of discharge than those based on mercury. With a translucent alumina envelope, a sodium vapor-discharge lamp can be made to operate without envelope deterioration at high temperatures and with high sodium pressures. As a result, more atomic transitions in the plasma are excited, and the lamp produces a continuous spectrum of nearly white light (it is slightly green-deficient). This advance in materials provided for the first lamp with a continuous spectrum operating at over 100 lumens per watt.
The fluorescent lamp is essentially a mercury discharge lamp operated at a very low mercury pressure (10-5 atmospheres) so that about 60% of the radiation is at 253.7 nm wavelength. This ultraviolet radiation excites fluorescence in phosphors which are coated on the inner surface of the tubular lamp envelope. The basic phosphor in white fluorescent lamps is calcium halophosphate and various additions are made to modify or control the color of the lamp.
Photoflash lamps represent the only important illumination device involving a chemical reaction to heat matter to incandescence. The initial photoflash lamps, developed in Germany, consisted of aluminum foil in an oxygen-filled glass envelope, which could be ignited by an electrically fired primer, so that the foil burned to Al2O3 in about 20–30 milliseconds. Subsequent developments have substituted wire for foil, shredded zirconium and, most recently, shredded hafnium metal for aluminum. As a result, the light output per unit volume has increased several fold. Meanwhile, the use of these lamps by amateur photographers has increased to the point that more lamps are produced for flash purposes than any other single application.
Container Industry
The container industry is the largest segment of the packaging industry; it is defined, for the purposes of this report, as that part of the packaging industry involved in the manufacture of rigid packaging such as cans, bottles, boxes, and tubes. The balance of the packaging industry can be described generally as involved in the manufacture of flexible packaging, such as
pouches, wraps, strapping, bags, etc. Figure 7.12 illustrates the normal flow of packaging, including containers, from manufacture to disposal or reuse. In the following, each of the principal classes of containers—glass, plastic, metal, and paperboard—are reviewed from the point-of-view of materials needs, availability, and recycling characteristics.
Glass Containers: The continued growth of glass-container shipments from 1900 to 1970 is illustrated in Figure 7.13. The growth rate was about 4.5% per year for the period, but is expected to slow down to less than 4% for the immediate future. Table 7.15 illustrates the distribution of glass-container shipments by end use.
Materials needs in the glass-container industry are conditioned by the fact that, unlike other packaging materials, glass cannot be shipped as an intermediate raw material to a converter for fabrication. For this reason, the glass producer also produces the container, which is then shipped to the packager for filling, sealing, and shipment. Figure 7.14 shows these characteristics of the industry structure. The volume of major raw-material needs (Figure 7.15) is large: 7.2 million tons of sand, 2.35 million tons of soda ash, and 2.35 million tons of limestone were needed to manufacture the 10.8 million tons of glass containers, representing 37 billion packaging units, produced in 1970. Color can be controlled in nearly all glasses by additions in glassmaking of a variety of compounds. Some colors require or are enhanced by oxidation of the coloring agents. Coating of glass containers is quite common and often involves two layers, for example, titanium oxide followed by a lubricious coating such as polyethylene. Some glass containers (such as for aerosols) have rather thick coatings of a polymer resin for protection against mechanical damage as well as for aesthetic appeal. Thick opaque or translucent oxide and metallic coatings are sometimes applied to provide desired color effects or light protection.
Materials availability does not appear to be a problem for glass containers since, for the present and foreseeable future, there are adequate reserves of the three main ingredients of glass—sand, limestone, and soda ash.
Recycling is readily feasible technically for glass containers, whether as containers or as material, because glass is chemically inert, and does not break down chemically or biologically. However, when bottles and jars are littered, the inertness of the glass means they do not disappear by degradation, but remain visible and can become hazardous wastes. Discarded glass containers do find use as a good aggregate base for construction and in cullet. The latter, which is obtained from two sources: scrap dealers and glass-plant wastes, normally represents between 15 to 30% of the input materials used in glassmaking (the major portion of the cullet comes from the inhouse waste). Examples of direct use of cullet are as a substitute for stone to form a paving material in conjunction with an asphalt binder, and for soil conditioning. A variety of possibilities for secondary uses of glass are technically feasible; their practicality will depend largely on the development of economical collection methods for the discarded and frequently dispersed containers.
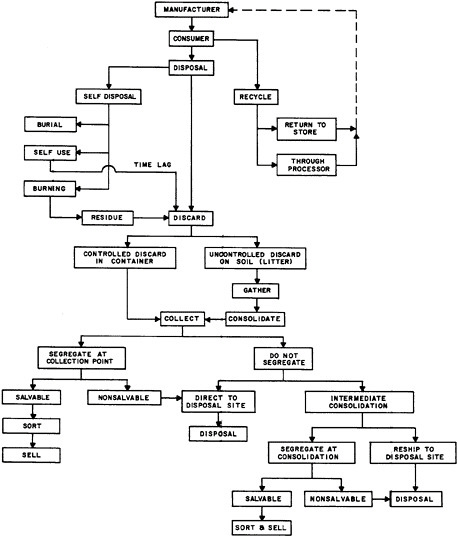
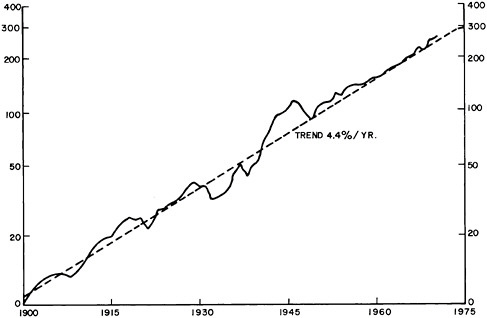
TABLE 7.15 Distribution of Glass-Container Shipments by End-Use: 1958 to 1976
|
|
Est. |
|||||||
|
End-Use |
1958 |
1960 |
1962 |
1964 |
1966 |
1970 |
1973 |
1976 |
|
Food |
42.9 |
41.3 |
40.6 |
39.5 |
36.7 |
32.9 |
30.7 |
27.9 |
|
Beverage |
25.0 |
27.7 |
32.5 |
36.6 |
40.9 |
48.8 |
53.3 |
58.6 |
|
Drug and Cosmetic |
23.9 |
22.5 |
21.4 |
19.9 |
19.6 |
16.5 |
14.7 |
12.6 |
|
Chemical, Household, and Industrial |
8.2 |
8.5 |
5.5 |
4.0 |
2.8 |
1.8 |
1.3 |
0.9 |
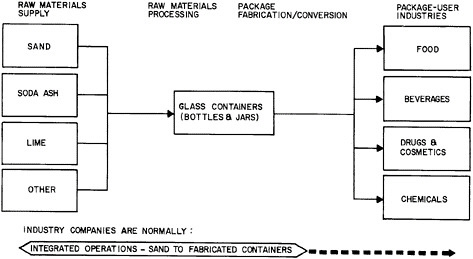
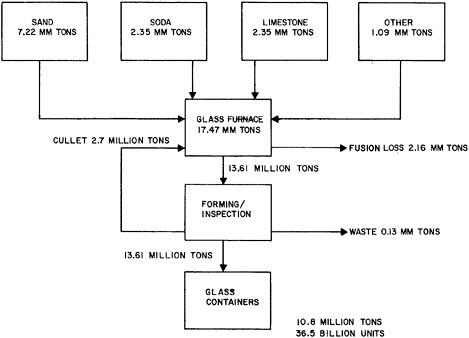
Plastic Containers: The principal materials flows and structural features of the plastics-container industry are illustrated in Figure 7.16. Plastics have some unique performance characteristics in packaging applications which account for their growth. For example, readily formed (blow-molded) plastic containers—especially from nonbreakable polyethylene—have essentially replaced glass jugs for many applications. The volume of plastics in packaging of all kinds has grown to 3.6 billion pounds in 1970. This growth and the major end-uses are shown in Table 7.16.
The materials needs of the industry are derived mainly from the single petroleum and the natural-gas derivatives, ethylene—which is the source of the three major plastics, polyethylene, polyvinyl chloride, and polystyrene (see Figure 7.17). The other major plastic, polypropylene, is obtained from a process by which ethane and propane are produced from natural gas or petroleum fractions. Polyethylene accounted for 61.5% of the volume of container plastics consumed in 1971 or a total of 2.47 billion pounds. Polystyrene packaging utilized 876 million pounds to rank second in usage at 22%. Polyvinyl chloride (PVC) usage was 6.8% or 270 million pounds, and polypropylene accounted for 5.0% at 200 million pounds. The biggest percentage gain in the last five years occurred in PVC, which rose from 4.0% of the market in 1966 to 6.8% of the market in 1971. Another family of plastics whose use is just beginning to take hold is acrylics—which appear promising for soft-drink bottling. The total volume of plastics consumed by the container industry is expected to double in the period 1970–76.
Materials availability is directly related to the availability of the primary raw materials, natural gas and petroleum reserves, and to competition with their use for energy applications. For details, see section on Plastics Industry.
Recycling of plastics from residential and commercial refuse is little practiced at present. In contrast, plastic wastes are collected commercially by scrap dealers from industry, plastic extruders, converters, molders and fabricators—and can usually be completely recycled. However, polyethylene, which accounts for the bulk of packaging plastics, is virtually worthless as scrap at present.
Metal Containers: The flow of the principal materials—in steel and aluminum—in the metals-packaging industry is shown in Figure 7.18. Generally, steel containers are manufactured by independent converters or by packagers from rolled tinplate purchased from the steel industry. In contrast, although aluminum containers account for only a small percentage of total aluminum output (11% in 1969), aluminum producers are also container producers. The distribution of the output of the industry by end-use and its change with time shown in Table 7.17 illustrates the dramatic growth in beverage-can use and decline in nonfood use. Overall, the ten-year rate of increase in cans consumed (1966–1976) is expected to be 3.7% per year.
The materials needs of the industry are significant in scale as shown by the fact that, in 1966, 14.3 billion pounds of metals were converted into packages; 73% being converted into metal cans, which constituted 54.4 billion packaging units. In 1976, over 16.8 billion pounds of metals will be for packaging.
A summary of the quantities of metals consumed in container applications
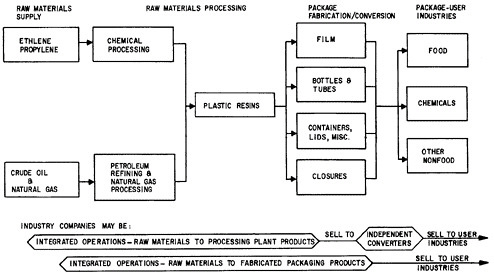
TABLE 7.16 Consumption of Plastics in Packaging by End-Use: 1958 to 1976
|
|
In Millions of Pounds |
|||||||
|
|
Est. |
|||||||
|
End-Use |
1958 |
1960 |
1962 |
1964 |
1966 |
1970 |
1973 |
1976 |
|
Rigid and Semi-Rigid: |
|
|||||||
|
Bottles |
23 |
65 |
175 |
227 |
304 |
730 |
1150 |
1700 |
|
Tubes |
|
3 |
15 |
30 |
35 |
40 |
||
|
Formed and Molded |
61 |
120 |
175 |
288 |
478 |
800 |
1000 |
1400 |
|
Closures |
22 |
22 |
58 |
66 |
85 |
120 |
160 |
210 |
|
Total |
106 |
207 |
408 |
584 |
882 |
1680 |
2345 |
3350 |
|
Film: |
630 |
776 |
874 |
1026 |
1317 |
1940 |
2350 |
2910 |
|
Overall Total |
736 |
983 |
1282 |
1610 |
2199 |
3620 |
4695 |
6260 |
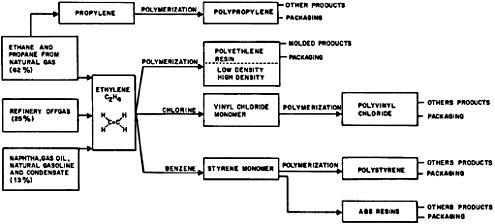
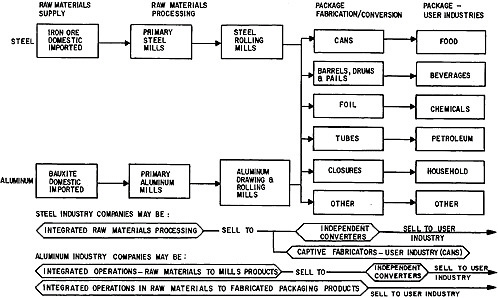
TABLE 7.17 Number of Cans Consumed by End-Use: 1958 to 1976
|
|
Millions of Cans |
|||||||
|
|
Est. |
1966 to 1976 Rate of Change (percent annually) |
||||||
|
End-Use |
1958 |
1960 |
1963 |
1966 |
1970 |
1973 |
1976 |
|
|
Foods |
25,562 |
26,513 |
26,096 |
26,164 |
27,190 |
28,050 |
28,990 |
1.0 |
|
Beverages |
9,685 |
10,693 |
12,512 |
19,557 |
25,040 |
30,130 |
36,860 |
6.5 |
|
Nonfood |
6,075 |
4,288 |
4,093 |
4,395 |
5,010 |
5,310 |
5,820 |
-3.3 |
|
Total Metal Cans |
43,290 |
44,373 |
45,903 |
54,436 |
62,210 |
69,300 |
78,270 |
3.7 |
for 1966 and projected for 1976 is given in Figure 7.19. These relatively flat curves represent an annual growth of about 1.6% for total can production.
Materials availability and costs for the industry present some uncertainties for the future. For steel, although there are large quantities of iron ore in the U.S., the tonnage of imported ore is high and increasing because of lower costs for imported ores. The majority of the tin for the making of tin-plate must be imported since there are no large deposits of tin ore in the U.S. Similarly, large quantities of aluminum and aluminum ores are imported for aluminum cans. For details, see appropriate portions of the section on the Metals Industry.
Recycling of containers has substantial potential, but of the 6.8 million tons of steel which appear in containers every year, only a small portion is recovered. The overwhelming bulk of salvaged materials comes not from post-consumer wastes, but from detinneries who rely on clean clippings from can-production plants for their materials. As with other materials, the economics of collection, sorting, and handling are currently unfavorable for widespread recycling of steel cans. In the case of aluminum salvage, technologies for complete recycle of canning alloy from post-consumer waste have been developed. Although some such recovery is undertaken, the economics are still uncertain.
Paperboard Containers: Paperboard can be divided into five major grades, three of which (containerboard, folding boxboard, and foodboard) represent the bulk of paperboard containers. Table 7.18 shows U.S. production of paperboard (by total and major grade) for 1960, 1966–70, and Figure 7.20 illustrates the flow of materials in the industry.
Containerboard is the largest grade of paperboard produced, currently accounting for about 60% of total board production. Its primary use is in the manufacture of corrugated and solid fiber boxes, more than 51% of the total output going to three consuming industries: food and beverage, 29%; paper and paper products, 13%; and stone, clay, and glass, 10%. Folding boxboard is employed almost exclusively in the manufacture of folding cartons, which are printed, cut, creased, glued, and then shipped flat to the packager who sets up, fills, and seals the carton. Folding cartons are relatively inexpensive, can be manufactured at high speeds, and are economical relative to transportation and storage costs. The final major grade, foodboard, is used exclusively to manufacture such sanitary paperboard containers as milk cartons, frozen food containers, meat trays, and ice cream cartons. About 85% of the pulp used in its manufacture is bleached or semibleached kraft. The boards are sized for water resistance and are frequently coated, particularly for applications that require high quality printing. Since 1960, the production of foodboard has been growing at an average rate of around 5% per year.
As more of the primary producers integrate forward into finished products, paperboard and its converted products are increasingly becoming one single industry. In 1967, integrated firms (those with converting plants taking 50% or more of a company’s paperboard output) produced 89% of all containerboard and 61% of all folding boxboard. The industry is also becoming highly concentrated. In 1967, of 135 companies reporting to the Paperboard Group of the American Paper Institute, the top ten accounted for 44% of sales; the second ten, 20%; and the third ten, 12%.
Materials needs for the industry are met from wood and waste paper. In
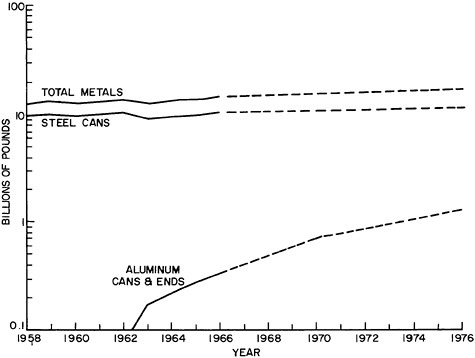
TABLE 7.18 U.S. Production of Paperboard by Grade (Million Tons) 1960, 1966–1970
|
|
Containerboard |
Folding Boxboard |
Special Foodboard |
All Other* |
Total |
|
1960 |
8637 |
2923 |
1447 |
2920 |
15927 |
|
1966 |
13661 |
3614 |
1902 |
4002 |
23179 |
|
1967 |
13428 |
3575 |
1902 |
3914 |
22819 |
|
1968 |
14846 |
3739 |
2076 |
4243 |
24904 |
|
1969 |
16131 |
3779 |
2147 |
4319 |
26376 |
|
1970 |
15805 |
3559 |
2211 |
3919 |
25494 |
|
* All other includes exports of folding boxboard and foodboard. |
|||||
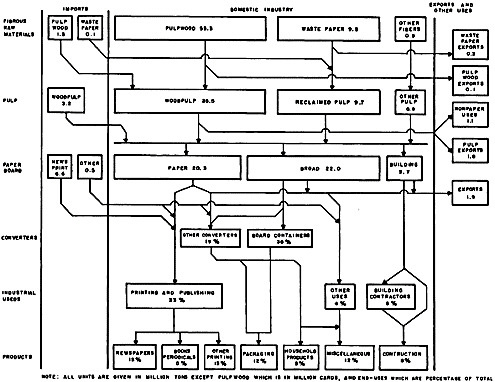
1967, wood accounted for 78% of the total and waste paper 20%. Minor amounts of cotton linters, straw, and bagasse are also used. Pulpwood of suitable species and in the form of logs (round-wood) or chips is the raw material for woodpulp in paper manufacture. In 1967, 55.3 million cords, on a rough-wood basis, were consumed by the industry. Waste materials in the form of chips or residues, the by-products of sawmills, plywood plants, and other wood-using facilities, provide a substantial amount of the paper industry’s pulpwood; in 1964, 11.2 million cords, or 23% of the 48.5 million cords of pulpwood produced, came from such residues. This is up from 8.6% in 1955, with 1970 estimated at 25%.
Waste paper in a salable condition for pulping is the second major raw-material source. The amount of waste paper used varies substantially by grade of product. In the paperboard segment of the industry, the range generally falls between a low of zero (foodboard grades) and a high of 70–80% (boxboard).
Materials availability is illustrated by the data in Table 7.19, which represents the total commercial forest land area in the U.S., 509 million acres. The major portion of the commercial forest area (59%) is owned by farmers and individuals, while governmental agencies control the next largest amount, 28%. The forest industry controls the balance, amounting to 13% of the total, or 67 million acres. The southern states have the greatest concentration of commercial forest area and also the largest volume of timber harvested annually.
Recycling is significant in the paper industry, but three-fourths of the waste paper recycled is derived from waste sources other than packaging wastes. However, paperboard mills consume about 75% of the waste paper recycled. The only paperboard-packaging material which plays a significant role in paper salvage is corrugated containers. An estimated 2.5 million tons of these containers were recycled in 1966 and amounted to 20% of the 12.5 million tons of containerboard produced that year. The other paper-packaging materials are usually ignored by salvage operators because corrugated paperboard is more readily available in significant quantities, easily separated, and not as likely to be contaminated as other paper wastes usually are. Recent governmental decisions to encourage recycling by purchasing only paper products that have a specified percentage of recycled paper could induce industry to increase use of waste paper in order to capture this portion of the total market. However, this shift may increase costs until such time as systems and processes are developed which will increase availability and allow waste fiber to compete with virgin fiber.
Automobile Industry
The activities of the automobile industry have broad influence on the nation’s economy. Table 7.20 illustrates this point with respect to the extent to which other industries contribute to automotive production. In 1967, these other industries employed nearly 500,000 workers to produce over $13 billion worth of automotive parts. In 1970, with automotive sales at $18 billion, employment by the automakers themselves was 364,000. The gross auto product of about $31 billion in 1970 accounted for 3% of our Gross
TABLE 7.19 Commercial Forests of the United States—509 Million Acres. Historical and Projected Timber Harvest, Growth, and Inventory
|
|
Growing Stock in Billion Cubic Feet |
||
|
Year |
Harvest |
Growth |
Inventory |
|
1952 |
10.8 |
14.3 |
595.8 |
|
1962 |
10.1 |
16.3 |
627.9 |
|
1970 |
11.5 |
17.4 |
671.9 |
|
1980 |
13.7 |
18.2 |
727.7 |
|
1990 |
16.9 |
17.2 |
757.9 |
|
2000 |
21.6 |
17.2 |
738.3 |
TABLE 7.20 $13 Billion Automotive Parts Produced in Other Industries*
|
Industry Producing |
Automotive Shipment (Millions) |
Estimated Automotive Employment |
|
Narrow Fabrics |
$ 19.3 |
1127 |
|
Tufted Carpets and Rugs |
84.9 |
1876 |
|
Padding and Upholstery Filling |
60.1 |
2327 |
|
Tire Cord and Fabric, Total |
404.6 |
9201 |
|
Apparel Findings and Related Products |
513.0 |
20196 |
|
Fabricated Textile Products, n.e.c. |
98.0 |
4904 |
|
Public Building and Related Furniture |
61.4 |
3300 |
|
Die-cut Paper and Board |
41.9 |
1451 |
|
Paints and Allied Products |
218.0 |
4959 |
|
Tires and Inner Tubes, Total |
2793.8 |
69430 |
|
Fabricated Rubber Products, n.e.c., Total |
320.2 |
14443 |
|
Plastic Products, n.e.c. |
58.4 |
2768 |
|
Flat Glass, Total |
342.0 |
12900 |
|
Pressed and Blown Glass, n.e.c. |
17.1 |
808 |
|
Glass Products made of Purchased Glass except Laminated |
100.8 |
3708 |
|
Asbestos Products, Total |
142.4 |
5282 |
|
Hardware, n.e.c. |
807.7 |
34303 |
|
Fabricated Plate Work, Boiler Shops Products |
27.1 |
964 |
|
Screw Machine Products |
233.2 |
11172 |
|
Bolts, Nuts, Rivets, and Washers |
91.2 |
3696 |
|
Metal Stampings, Total |
3178.2 |
121760 |
|
Miscellaneous Fabricated Wire Products |
153.0 |
7525 |
|
Steel Springs, Total |
164.2 |
6568 |
|
Internal Combustion Engines |
233.2 |
7071 |
|
Refrigeration Machinery |
531.3 |
16211 |
|
Machine Shop Products, Total |
347.7 |
20453 |
|
Electrical Measuring Instrument |
2.7 |
123 |
|
Motors and Generators, Total |
145.6 |
6881 |
|
Carbon and Graphite Products |
12.2 |
488 |
|
Electric Lamps (Bulbs) |
88.2 |
3334 |
|
Lighting Fixtures |
186.1 |
7555 |
|
Radio and TV Receiving Sets |
211.1 |
6418 |
National Product, and automotive employees accounted for 5% of all manufacturing employees.
Materials usage in the industry represents a significant fraction of annual U.S. consumption of a variety of basic materials because of the large number of vehicles involved and their large individual mass. A typical 1970 four-door sedan contains over a ton and a half of metals, 150 pounds of plastics, 200 pounds of other polymers, and 100 pounds of glass (see Table 7.21). The total consumption of selected metals by the automotive industry in 1969 is shown in Table 7.22 compared to their U.S. consumption. In addition to these and other metals, the automotive industry accounted in 1969 for 65% of the national consumption of rubber, and over 2% of the national cotton production.
The economic significance of materials processing technology in this industry is indicated by the fact that roughly $500 worth of raw materials is transformed into a car worth at least $3,500 in functional value, and that materials-related costs are a significant portion of this chain of value-added manufacturing steps. Since less than 30% of the automobile units manufactured in the world are made in the U.S., competition for the necessary materials is world-wide.
Materials availability is an important question for this materials-intensive industry. Table 7.23 shows that a large fraction of the principal metals in an American automobile now comes from foreign sources, a situation that contributes negatively to the U.S. trade balance and hence must be viewed cautiously—politically as well as economically. The large scale of materials consumption in the automotive industry is a key factor to be taken into account in every product improvement decision. Adding just one pound per vehicle adds some 5,000 tons to the total materials requirement for the U.S. industry. Thus, new materials must have an assured availability in addition to offering cost, performance, and other advantages.
Materials conservation, scrap utilization, and recycling in the automotive industry are making substantial progress in their degree of application. Currently, more than 90% of the output of the automotive cast iron foundries is made up of recycled iron. Approximately 88% of all cars junked each year (6 to 7 million) are recycled into the scrap and iron industries. In automobile manufacture, the bulk of the scrap produced is metal and, because there is strong economic incentive to do so, almost 100% of this metal scrap is reused or reclaimed. The flow of materials with respect to recycling in the industry is described in Figure 7.21 which shows that of the total ferrous metals entering the automotive manufacturing cycle, 65% comes from steel mills; 20% comes in the form of castings from automaker foundries; and 15% from inhouse scrap. In processing these ferrous materials, approximately 70% appear as part of the finished products and some 30% are scrap materials. The latter come in many grades and classifications, numbering as many as 20 or 25. Examples include: No. 1 bundles, flash turnings, borings, bushelings, clips, and such alloyed materials as stainless, galvanized and lead-coated sheet steel.
Solid wastes also arise in the industry from nonproduction materials, i.e. materials not incorporated in the final vehicle, but necessary for the manufacturing processes. Increased efforts are underway in the automotive industry to handle the millions of tons of solid waste involved. For the most part,
TABLE 7.21 Materials in Typical 1971 Four-Door Sedan
|
Materials |
Net Weight (Lbs.) |
|
|
Metals |
|
3400 |
|
Steel |
2500 |
|
|
Iron |
750 |
|
|
Aluminum & aluminum alloys |
50 |
|
|
Copper & copper alloys |
40 |
|
|
Zinc & zinc alloys |
30 |
|
|
Lead & lead alloys |
30 |
|
|
Plastics |
|
150 |
|
Styrene plastic |
10 |
|
|
Olefin plastic |
20 |
|
|
Vinyl plastic |
30 |
|
|
Thermoset molding |
15 |
|
|
Other thermoset plastic |
15 |
|
|
Plastic foam materials |
35 |
|
|
Nylon |
25 |
|
|
Other Polymers |
|
200 |
|
Paper |
20 |
|
|
Paints & coatings |
10 |
|
|
Rubber compounds (including tires) |
170 |
|
|
Glass |
|
100 |
TABLE 7.22 Selected Automotive Metals Consumption, 1969
|
|
U.S. Total Consumption (tons) |
Automotive Consumption (tons) |
Automotive Percentage |
|
Steel |
93,876,871 |
18,276,409 |
20 |
|
Iron |
17,081,299 |
3,199,456 |
19 |
|
Aluminum |
5,383,500 |
534,000 |
10 |
|
Copper |
2,454,500 |
287,500 |
8 |
|
Zinc |
1,588,000 |
517,746 |
33 |
|
Nickel |
210,000 |
23,500 |
11 |
|
Source: 1971 Automobile Facts and Figures, p. 25 |
|||
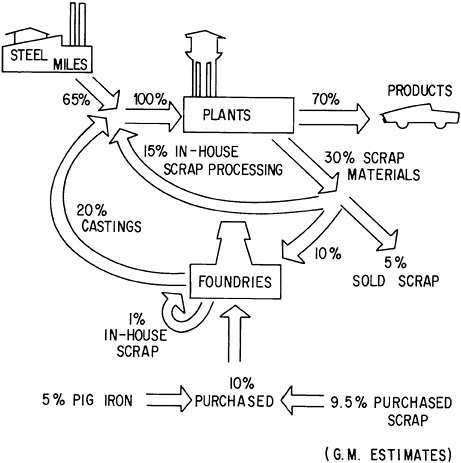
inert solids are deposited in sanitary landfills because reclamation or recycling is either impractical, or uneconomical, or both. Fly ash, for instance, can be used as an aggregate in cinder blocks or as a secondary road-surfacing material. However, the supply far exceeds the current demand. Core sand from foundries can be reclaimed, but costs substantially more than new sand. Likewise, construction debris—mostly broken concrete, brick, and dirt—has little value worth reclaiming at present. All of these materials are inert and, consequently, can be utilized in sanitary landfills without harmful effects.
Some of the solid wastes are byproducts of air- or water-pollution abatement. For example, phosphating materials, used as a rust inhibitor prior to painting steel surfaces, are distributed in sanitary landfills where they actually can improve the soil through the minerals they provide. Much of the remaining types of solid wastes are being reclaimed. The automobile industry estimates that at least 50% of the paper, cardboard, and wood wastes are being reconstituted. In addition, there are vigorous programs underway to reduce the volume of these disposable materials in interplant shipments through greater use of returnable containers and more skillful packaging of production parts.
Reclamation of the automobile after-use is an extensive industry. Of the 20 million junk cars in the U.S. today, nearly 16 million are in the inventories of auto wreckers and scrap processors. Most of the 6.5 million cars that are taken off registration lists each year find their way into auto-wrecker yards and scrap-processing firms where they are eventually recycled into usable scrap for steel mills and foundries.
Competition among materials is especially strong in the automotive industry. Where once only one material could do the job, there are now many materials offering similar performance at competitive prices. As a case in point, the application of plastics in automobiles has grown considerably because they now offer both unique and improved engineering properties at lower costs; for certain parts, a pound of typical automotive plastic goes about seven times as far as a pound of metal. Table 7.24 shows the relative costs of three metals and three plastics by weight and volume. In general, it is more economical to use engineering plastics than metal where the required volume of material is roughly equal. The resulting weight reduction is becoming of increased importance as safety and emissions-control features add to the weight of cars.
The substitution of plastics for steel, aluminum, and zinc has been a trend for years in the automobile industry. Automotive consumption of plastics and other polymers grew from 300 million pounds in 1965 to about 1 billion pounds in 1971. Today the list of commercially available polymers includes some 50 different plastics. Low tooling costs and design flexibility are major reasons for the use of plastics. Complex shapes may be fabricated in single operations. While cost is an important factor in materials selection, it turns out that better performance, durability, and safety are frequently the reasons for choosing plastics. Many parts found on current model cars involve materials with a cost penalty to solve other problems; included are certain applications of plastics as well as electroplates, paint, and galvanized steel. For injection-molded plastics alone, automotive consumption has risen from 64 million pounds in 1963 to 364 million pounds in 1970; by
TABLE 7.24 Comparison of Material Cost*
1975 this figure is expected to double. A tally of injection-molded plastics replacing metal would include such things as grilles, instrument panels, front-ends, fender extensions, fender liners, lamp housings, bezels, and valence panels.
Besides plastics, other polymers are of major importance to the automotive industry, such as elastomers, paints, fabrics, adhesives, and sealers. Whereas a 1950 car used about 10 pounds of adhesives and sealants, today’s car carries about 70 pounds. In a typical full-size car of 1971, there were as many as 750 rubber parts in addition to the tires; these were made from 30 different rubber compounds. Since 1970 several significant milestones in nontire applications of rubber compounds have been achieved by the automobile industry. Some examples are elastomer tapes for bond-welding of large structural components, spray-on polyurethane bumper coatings, and the all-foam seats of polyurethane. Urethane coatings are being employed in production to coat elastomeric bumpers, instrument panels, and polycarbonate headlight bezels. Such coatings are ready for use on integral skin-foamed parts such as steering wheels, arm and head rests, visors, air scoops, and strip moldings. Urethane coatings also show promise for hoods, air foils, bumper guards, and fender extensions. The use of polyurethane foam is expanding faster than that of any other material in the automotive industry. More than 60% of all 1972 model cars had adopted the all-foam seat in favor of the once-dominant springs and padding.
Penetration of plastics into the markets for steel, aluminum, and zinc is underscored by the differences in the growth-of-the-demand for these materials during the 1960’s. While plastics production increased over 150%, from 3 to 8 million tons, the 10-year increase in steel production was 33%, aluminum 60%, and zinc 25%. Some of the automotive products where this competition is important are listed in Table 7.25.
Certain trends for plastics versus metals in the 1970’s are already evident. The average car in 1969 had approximately 100 pounds of zinc and 100 pounds of plastics. However, the use of zinc is expected to decline. Auto parts for which zinc and plastics compete include grilles, instrument panel assemblies, headlight and taillight housings, air-intake cowls, door glass channels, radio speakers, glove-box doors, bezels, trim components, etc. Usually the choice between plastics and zinc is settled by some secondary consideration such as appearance or style. The difficulty of plating plastics has favored zinc in some applications. In 1970, some automakers returned from plastics to zinc for rear-fender extensions, taillight assemblies, and headlight assemblies. Zinc is finding new automotive uses which cannot be challenged by plastics. In recent years, zinc has doubled the life of automobile leaf springs by acting as a sacrificial metal for corrosion.
The continued development of plastic composite materials, especially those reinforced with glass fibers, hold even more promise for increasing the automotive uses of plastics. These materials form a unique bridge between the limitations of metals on the one hand and of unreinforced plastics on the other. Their favorable economics, rapidly advancing processing technology, and good mechanical performance assure their successful application in many areas which previously relied upon fabricated steel, die-cast metals, and expensive engineering thermoplastics. There have been more developments in glass-reinforced plastics in the five years of 1965–70 than in all the previous
TABLE 7.25 Automotive Products That Can Be Made of Either Plastic or Metal
|
Automotive Body Components |
Radiator Grilles |
|
Fuel Tanks |
Instrument Cluster Panels |
|
Front Seat-Back Trim Panel |
Wheelcovers |
|
Radiator Fan Shrouds |
Cowl Kick Panels |
|
Front Fender Skirts and Liners |
Seat Grid Liners |
|
Truck Trailer Liners |
Ductwork for Heating, Airconditioning |
|
Door Inner Panels and Locks |
Plated Trim, Decorative Medallions |
|
Control Handles and Knobs |
Bezels, Shelves, Mirror Supports |
|
Glove Compartment |
Arm Rests, Sun Visors |
years since their introduction in the 1940’s. With new matched die-molding processes, for example, these materials may now compete with steel in large production runs of up to 70,000 units per year. Previously, even half that number could not be run. Current reinforced-plastics production of about one billion pounds per year seems small beside steel’s 250 billion pounds, plastic resin’s 19 billion, and aluminum’s 9 billion. However, a fourth of this business is already in ground-transportation markets, a sector where the high-strength, light-weight and good chemical resistance of reinforced plastics will make them increasingly attractive.
Auto equipment is now the number two consumer of glass-reinforced plastics, after marine equipment, but will probably take over as the top user in the near future. Auto and truck applications alone were up 36% in 1971. In 1972 at least 250 different applications of glass reinforced plastics were used, compared to 200 different applications in 1971 and 110 in 1970. Car models in 1971 employed glass-reinforced plastics in 13 instrument panel assemblies compared to 8 in 1970. In 1972 model cars, there were 150 different applications of injection-molded glass-reinforced thermoplastics alone, compared to 92 in 1971 and 60 in 1970. In almost all cases, injection-molded reinforced thermoplastics now have strength and modulus values higher than die-cast zinc. A complex composite which can be injection molded for large automotive components, such as consoles, bucket-seat backs, and instrument panels, combined reinforced polystyrenes with fiberglass-reinforced styrene-acrylonitrile copolymer. Recently, a new glass-fiber-reinforced foamed plastic has become available; it is as strong as conventional reinforced plastic but weighs only 66% as much. Also, this fiber-reinforced foam can be injection molded. In addition, new processing techniques for reinforced thermoset plastics are improving these materials as candidates for automotive parts.
Sheet-molding compounds were first introduced in 1969 in Chrysler station-wagon air deflectors. Usage has already spread, growing from 0.4 million pounds in 1969 to 10 million pounds in 1971, including front exterior panels, hoods, valence panels, window insert frames, and fender skirts. Large and complex pieces, having molded-in ribs, inserts, bosses, threads, and wide variations in thickness across the section, can be molded in one operation. If many of the one-piece sheet-molded front panels had been made of metal, they would have required six or seven pieces with as many as 20 forming and assembly operations.
There has also been substantial growth in aluminum usage in the automotive industry. A versatile engineering material, aluminum alloys have seen increasing applications that take advantage of their high strength-to-weight ratio, impact resistance, corrosion resistance, and heat conductivity, competing with iron and steel. The lighter weight of aluminum in comparison to cast iron has led to its wider adoption in engines. One materials breakthrough is the production-die casting of hypereutectic aluminum-silicon alloy in engine blocks; this eliminates the use of ferrous cylinder-wall liners. Other structural applications of aluminum include wheels, brake drums, optional aluminum cabs on heavy trucks, and the use of high impact-strength aluminum alloys in experimental bumpers and safety vehicles built for the government. The corrosion resistance of aluminum has been used to advantage in chemically brightened or anodized alloys for such production items as
grilles, head-lamp bezels, and hubcaps. Its thermal conductivity puts aluminum in competition with copper and brass for automobile air-conditioning and radiator applications, and with iron as well for disk and drum brakes. One British-made aluminum radiator, for instance, is put together with adhesives and uses no fluxes. While aluminum is replacing cast iron, steel, and copper for some parts, lighter magnesium may also replace aluminum. One German-made car, for example uses die-cast magnesium in gearbox casings and engine crank-cases.
All-in-all, 1970 automobiles had a record average of 78 pounds of aluminum, about a 6% gain over 1969 models. This was the fifth straight year of growing use of aluminum in U.S. cars, and a 50% gain over a decade ago.
Developments in other materials than plastics and the light metals continue to be important in the automobile industry. Steels of recent vintage which have had large influence in the field include galvanized steels, whose automotive uses quintupled in the last decade; steels with other improved coatings and finishes, and higher-strength steels. HSLA steels (meaning “high-strength, low-alloy”) used in 1972 bumpers, for example, have yield strengths of about 45,000 psi, compared to about 30,000 psi for carbon steel bumpers. HSLA steels for side-impact beams are said to have a yield strength of 75,000 psi. Pre-painted and pre-primed steels also are becoming more readily available, and for some hard-to-form parts, pre-painted steels may be a better choice than even galvanized steel.
Ceramic ferrites, usually pressed and sintered metal-oxide powders, are often improved substitutes for more expensive magnets in radios, small motors, and other electronic devices. Ferrites are now finding application in the small motors which raise and lower car windows, lock doors, and operate windshield washers. They are also used extensively in radios, a product for which automobile sets comprised 49% of the 1969 U.S. production.
The competition among materials has also resulted in new composite materials which use, sometimes synergistically, the best qualities of each material. Thus, the first production bumper to withstand 4-mph barrier impacts without damage (1972 Saab 99-E model) took advantage of the properties of three materials—rubber, steel, and plastics. Under a thick rubber exterior coating, a U-shaped steel compartment holds energy-absorbing cellular plastic blocks.
The role of processing technology has proved critical to production efficiency in the automobile industry. Metal casting, cold forming, and powder metallurgy are of growing significance in the industry and illustrate the impact, real and potential, of advancing metal-processing technology. For example, a new die-casting process along with a new aluminum alloy have been combined to produce the first all-aluminum engine. Also, a more ductile form of cast iron—nodular iron—has spurred ferrous-casting technology; lower-cost castings with at least equivalent performance are now supplanting parts that were previously forged. Similarly, greater uses of cold-forming processes and powdered-metal parts are resulting from interest in more efficient utilization of materials and reducing scrap. A cold-extrusion application has resulted in an 84% savings in materials over the previous machining process. One automaker has begun production of pole shoes for cranking motors in 1972, employing a new process that converts recycled metal scrap into fine powder.
Powder-metal compacting operations lend themselves naturally to process automation; now automatic presses achieve production rates of 500 to 1500 parts per hour or more. Few processes offer such precise control over materials and properties as does powder metallurgy. Frequently, no secondary-finishing operations are needed and powder-metal parts may be shipped directly following sintering.
In the case of thermoplastics a relatively new development is injection molding using a reciprocating screw. Comparing two machines of similar size, a particular ram-injection unit processes some 80 lbs. of polystyrene per hour, whereas the screw unit processes 200 lbs. per hour. Moreover, materials which are otherwise very difficult to process can now be formed into intricate shapes and heavier moldings. Extrusion is used for forming rods, tubes, films, and shapes in a wide variety of profiles. An example of the extrusion process is in the fabrication of vinyl insulation on automotive electrical cable. Vacuum forming is widely used to shape the thermoplastic skin of dash pads before they are filled with polyurethane foam.
Building Industry
The building and construction industry is among the largest in the nation in terms of contribution to the Gross National Product, amounting to about $109 billion in 1971. As shown in Table 7.26, the total industry has doubled in scale over the past decade. Among the various sectors, buildings, in contrast with heavy construction such as dams and highways, account for the largest share (about 85%) of this total.
The building industry has characteristics which make it quite unique, and therefore difficult to examine for a specific concern, such as innovation in materials technology, without some understanding of its complexities. In particular, markets are too small and heterogeneous for any standardized construction approach even in large production facilities, institutional structures, commercial buildings, and any special class of dwelling. Further, the different types of buildings are variously financed, built, marketed, and used. The industry has been described as composed of more than 90,000 contractors and 1,500,000 subcontractors employing 3,500,000 people. They are supplied by a myriad of other industries employing large numbers, such as the 240,000 employees of sawmills and planing mills, the 160,000 in millwork and related products, and the 260,000 who manufacture equipment. To handle financial, insurance, and real-estate dealings requires another 1,100,000 persons of whom more than 600,000 are in real estate alone. The building-design professions include 30,000 registered architects, and 75,000 engineers plus a number of specialists. The character of this industrial structure and distribution process exercises major influence on technology decisions.
Materials constitute a relatively small part of the total costs of building development; land development, labor, and long-term financing costs are as, or more, important. However, in many instances, the intimate relationship of materials with people and function in buildings has psychological significance as well as physical, economic, and social requirements. Thus, there is real concern for improving materials durability, maintainability, utility, and their aesthetic effects. This concern increases the
TABLE 7.26 New Construction ($ Billions)
|
|
Total |
Residential |
Utilities Etc. |
Commercial |
Highways |
Educational |
Industrial |
Hospital |
|
1960 |
53.9 |
22.7 |
5.4 |
4.2 |
5.4 |
3.4 |
2.9 |
1.0 |
|
1961 |
55.4 |
22.7 |
5.1 |
4.7 |
5.9 |
3.7 |
2.8 |
1.1 |
|
1962 |
60.0 |
25.2 |
5.1 |
5.1 |
6.4 |
3.6 |
2.8 |
1.3 |
|
1963 |
64.6 |
27.9 |
5.4 |
5.0 |
7.1 |
4.2 |
2.9 |
1.5 |
|
1964 |
67.4 |
28.0 |
5.7 |
5.4 |
7.1 |
4.5 |
3.6 |
1.8 |
|
1965 |
73.4 |
27.9 |
6.5 |
6.7 |
7.6 |
5.0 |
5.1 |
1.9 |
|
1966 |
76.0 |
25.7 |
7.5 |
6.9 |
8.4 |
6.3 |
6.7 |
2.0 |
|
1967 |
77.5 |
25.6 |
8.4 |
7.0 |
8.6 |
7.0 |
6.1 |
2.0 |
|
1968 |
86.6 |
30.6 |
9.7 |
7.8 |
9.3 |
7.0 |
6.0 |
2.3 |
|
1969 |
93.3 |
33.2 |
10.2 |
9.4 |
9.3 |
6.9 |
6.8 |
3.0 |
|
1970 |
94.3 |
31.7 |
12.1 |
9.8 |
10.0 |
6.5 |
6.5 |
3.4 |
|
1971 |
109.0 |
42.4 |
13.5 |
11.6 |
10.8 |
6.5 |
5.4 |
3.8 |
|
1972E |
122.5 |
49.5 |
15.3 |
14.0 |
12.0 |
6.6 |
5.3 |
4.5 |
|
1976E |
155.0 |
56.0 |
22.5 |
18.0 |
15.0 |
8.0 |
7.5 |
7.0 |
importance of materials to the marketability of the building, which offsets to a degree the relative insensitivity of materials technology in influencing the total cost.
There are a few materials that are produced exclusively for building purposes, and many of the materials industries already discussed are the producers of either raw or processed materials for use in buildings. In addition, buildings contain subsystems—electrical, mechanical, and structural— whose basic material and components may have numerous nonbuilding uses as well. Consequently, the products and problems of other industries are inextricably intertwined with those in the construction industry. Further, the buildings embrace furniture, tools, machines, and other goods, and require an array of community services from waste handling to streets, earth-moving equipment, and soil stabilizers. In a larger sense, all of these involve materials and products which are part of the industrial system.
Due to the highly competitive nature of the building market, walls, floors, partitions, mechanical and electrical subsystems, appliances, stairs, and other elements in buildings have been constructed of a wide variety of materials and combinations thereof, depending upon local building-code requirements, marketability, availability, and the impact of the selected materials on the total cost of the building. As new or improved appliances, fixtures, elevators, air-conditioning systems, structural and nonstructural systems are introduced for the first time, materials usage is directly affected. With almost every type of change—design, functional, technological, economic, ecological, social, legal, or political—materials usage is again influenced.
Factors Affecting Materials Science and Technology: One of the most significant factors in the building industry has been the relatively rapid increase in the ratio between the cost of job-site labor and material cost. The percentage of material in the total “brick and mortar” cost has been decreasing: in multifamily-housing construction, for example, it is now less than 50%—reversing the previous historical relationship. It is believed that this reversal is also the case in many types of nonresidential construction, although detailed studies to establish historical trends are lacking. For some years, labor for all categories of construction have been rising at a rate about twice that of materials prices. While material price increases were reduced during the recent period of price controls, wage rates continued to climb.
It is difficult to determine what portion of increased onsite-labor costs is due to higher “wages” and what portion is assignable to observed lower productivity. The issue of productivity in the industry has been recognized nationally as a major problem; it has been argued that low productivity, even more than high wages, may be pushing the cost of construction beyond the reach of many potential markets.
This trend of increasing onsite labor cost has been largely responsible for the growing emphasis on the production of more and more building components and subsystems in the factory, with its present and traditional lower wage rate and more efficient production processes. For example, several companies produce modules for single-family homes and town houses, and also some of the major subsystems for multifamily housing. Factory-fabricated
subsystems and precast-concrete structural subsystems have been adopted for many years in nonresidential construction. However, the full potential of materials is not yet being realized in that for most factory-produced house modules, prefabricated structural components, or factory-built major subsystems, the basic materials of construction are not significantly different from those employed onsite to produce the same basic end facilities. Likewise, since materials may also lower onsite-labor costs, the potential of materials technology for achieving onsite productivity gains must be as much as in-factory gains.
The relationship between labor and material prices is especially relevant in the context of total construction and development costs. For instance, approximately one-third of the total development costs for typical multifamily housing is accounted for in the aggregate cost of land, construction financing interest, cost of selling or renting the created units, legal fees, and other nonbrick-and-mortar items. In this case, it turns out that the price of materials is only one-third the total development cost. However, the choice and use of materials may also affect the speed of construction or the appeal to consumers, and this in turn affects the total price. For example, a 25% saving in overall construction time (a not-uncommon occurrence with the advent of new building technology) could save $170,000 in construction interest at 9% on a 10 million dollar project with a conventional 1.5-year cycle time.
When a purchaser buys a house, apartment, or pays rent, the price of occupancy becomes an additional factor. Each year, there are the maintenance and operating costs and the cost of interest for permanent financing, with the exact amount depending upon interest rates, type of construction, fiscal needs of a community, and management practices. While materials per se are a small component of the total occupancy cost, the effect of materials technology can be quite significant. Thus, a relatively small outlay for a better appliance or material can lower maintenance and operating costs appreciably and increase value. As long as this added outlay does not substantially restrict the market—i.e., price a significant number of families out of housing—the value-added may be marketable. As a corollary, modernization of buildings is also a substantial activity affecting personal, business, and national economies.
Materials Research and Development Emphasis: Information from building-product manufacturers reveals that the majority of their research and development effort is directed, not towards developing or exploiting new materials, but toward adapting the materials in which they have an established interest (i.e., a mining and/or manufacturing position) in order to lower installed costs, to reduce operating and maintenance costs, to combine function, to find new applications, or to provide comfort and safety. To reduce installed costs, such development programs seek to produce simplified methods of fastening, decrease product complexity, increase compatibility with interdependent subsystems, reduce number of parts needed for field assembly, and decrease material-handling and transportation costs. In these developments, individual materials, regardless of the principal reason for their selection in a given instance, tend to be viewed in the context of total system performance. In the area of operating and maintenance costs, long-term owners are recognizing
that costs over the term of proprietorship can decrease significantly if initial design-and-build decisions take into account time-dependent costs. Technology is increasingly expected to help reduce operating, replacement, and maintenance costs as well as first costs—a concept that is coming to be known as “life cycle costing.”
Energy shortages are a factor increasingly affecting materials selection. Opportunities for conserving energy exist by controlling a host of variables, including window size, lighting levels, amount of outside air recirculated, design and operational characteristics of electrical equipment, utilization of insulation, and building orientation and geometry. Definitive quantitative analyses of the significance of all of these variables under a variety of conditions are still at an early stage of applicability.
Fire safety and resistance to natural hazards and noise are being recognized as important areas for materials development. Fire-safety design is predicted in large measure upon contents of buildings, more popularly referred to as building “fire load.” Until recently, fire load data (as reported by the National Bureau of Standards) were based upon studies during the 1920’s and 1930’s; updating of such data merits high priority. Fire-safety practices include compartmentation; providing places of refuge; smoke-removal devices; smoke and heat detectors; communication systems; sprinklers, safety-exit planning; and elevator-emergency service. The development of needed criteria for fire-resistant construction materials requires acceleration to complement these practices.
The foregoing discussion of cost factors in housing suggests that materials R&D will have little influence on the construction industry from the standpoint of materials costs. Thus, in the case of private homes, it is estimated that, on an average, the cost of the building is 33% of the purchase cost; land, 25%; and financing, 42%. Less than 50% of the cost of the building goes into the cost of materials; as a result, a 10% savings in materials amounts to less than 2% of the total cost of a home. Even industrialized housing, if it were technically practicable, is likely to do no more than keep building costs steady with present practices. Nevertheless, despite the small impact of direct materials costs, significant cost reductions could arise from increased efficiency in the processes by which materials are incorporated in the buildings, e.g., savings in the 42% labor costs associated with this step.
Another important factor that will influence materials R&D for the industry in the future is the performance approach, as developed in particular by the Building Research Advisory Board of the National Research Council. The performance concept—involving criteria and specifications to meet them— has spawned a growing use of value engineering or consideration of alternatives during the design and procurement stages. This development increases the effectiveness of the competitive process over the traditional bidding among contractors against a fixed design material, or product specification. Most critically for materials, the role of the building-product producer is increased significantly in optimizing the structure through flexibility in materials performance and adaption to desirable processing modes.
Finally, the issue of constraints peculiar to the building industry has significance for the role to be played by materials. The Committee on Urban Technology of the National Research Council, in its report on “Long Range
Planning for Urban Research and Development,” has pointed out that “a rewarding field in which to seek cost reduction lies in the identification and reduction of constraints imposed by tradition and present practice.”
A detailed analysis of such problems by the Building Research Advisory Board identified the availability of materials as one of the constraints needing attention. While, the present study has reached a different conclusion regarding availability per se, it is clear that major constraints do exist due to high materials cost, performance limitations, and the ways in which materials are processed into construction products, components, subsystems and total systems. A key factor affecting materials in this respect is the currently limited viewpoint and policies of building-product manufacturers, particularly those with already established commitments to specific materials. Likewise constraining is the time required to develop an innovation to practice—on the order of five years. Hence, the cyclical character of the building industry and its sensitivity to many external influences tends to retard the exploitation of innovations. In another area, the movement toward doing more assembly work in the factory rather than onsite has introduced new factors, namely those associated with fixed costs of manufacturing. Consequently, increased automation and factory fabrication seem to have been occurring only in cases of intensive repetitive building where there is confidence in a continuing market large enough to permit amortizing the plant investment involved. It is clear that the fragmented character of the building industry is a severe obstacle in the extent to which major advances from materials performance and processing efficiency can be expected to be utilized.
Materials and Standards
Before a new material can be efficiently used in manufacturing and commerce, the properties and performance of the material must be described and specified. Both the functional value and the characteristics must be standardized if the new material is to be obtained competitively, and priced appropriately. The description of the desired characteristics of the material takes the form of a “standard specification,” which expresses the material characteristics in terms of quality, uniformity, and performance, in order to measure its ability to fulfill specific application requirements. For example, when a ton of structural steel is purchased for a specific price, the latter is related directly to a particular specification which stipulates the chemical composition (allowable limits on the amount of carbon, manganese, phosphorus, sulfur, silicon, and copper), the minimum allowable strength and ductility, etc. Thus, this standard specification defines the quality and therefore the value of the steel. In turn, to measure whether the steel meets these stipulations requires standard methods of test.
Standards defined in this way are useful in every step of the manufacturing cycle—design, materials, processes, and product. Accordingly:
-
Standards define the performance properties required by the user.


