
2
Military Manpower Requirements
This chapter outlines the “demand” for military manpower and the processes that are used to determine force size and structure, recruiting challenges, and retention needs. The two central questions are: (1) Will the United States need a larger force in the future? (2) Will a different level of personnel aptitude or skill mix be required? Answers to these questions depend on the missions to be performed. As missions and priorities change, so do the recruiting requirements. Thus, future recruiting need is a function of any mission changes that would dictate a change in force size as well as any changes in retention that would dictate a change in the number of positions to be filled by new recruits.
Our review of these factors is divided into three major sections. The first section discusses future defense strategies and force structure policy decisions presented by the President of the United States, the National Security Council, and the Department of Defense (DoD). The second section provides a discussion of force size and level of recruit qualifications from an historical perspective. The third section examines the implications of past and present trends in attrition and retention for recruiting. Each offers guidance concerning both current and future military recruitment needs. Figure 2-1 provides an overview of the major factors involved in the process of establishing recruiting requirements.
The size and shape of the military services are determined by the National Security Strategy (NSS) and the National Military Strategy (NMS). The NSS is developed by the National Command Authority (the President and the National Security Council) and is usually prepared by each new administration every four years. Although national security is
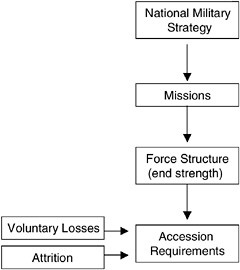
FIGURE 2-1 Manpower planning.
certainly a responsibility of the military, it also has diplomatic, economic, and informational dimensions as well. The NSS provides the overall guidance to all agencies of the federal government with roles in national security. Its function is to:
-
ensure U.S. security and freedom of action,
-
honor international commitments, and
-
contribute to economic well-being.
The NMS is derived from the NSS by the secretary of defense and the chairman of the Joint Chiefs of Staff. The NMS describes the use of military power in peace and war to help meet national security objectives. The commanders in chief of the regional combatant commands develop their theater strategies from the NMS. The actual military force structure (size— i.e., end strength) and shape (skills, organizational structure, etc.) are based on the specified and implied missions in the NMS. For example, if the U.S. Navy is required to maintain a continuous forward presence in the Atlantic, the Pacific, the Mediterranean, and the Persian Gulf, then a minimum number of ships is required, which in turn requires a certain number and skill mix of people to man those ships.
The Services, through the DoD budget process, request authorization for their required personnel end strength (size) and for the necessary appropriations (funds to pay for that end strength) each year. The approved DoD budget is authorized and appropriated by Congress and
signed by the President. In some cases, the funds appropriated do not match the numbers authorized—in these cases each Service has the option, up to a point, of taking some funds appropriated for other programs to pay for the additional personnel authorized.
Recruiting requirements are determined by anticipated shortfalls in authorized end strength.1 This involves comparing the current number on active duty and the end strength authorized for the coming fiscal year and projecting personnel losses for that year. Personnel losses are calculated by adding estimates of voluntary losses and estimated losses based on those who do not reenlist when their terms of service expire and to estimated losses from attrition prior to the end of an enlistment term (for medical, disciplinary, or other reasons). End strength requirements, that is the raw numbers needed, are necessary but not sufficient to the process. Recruiting goals also take into account specific skills required, some of which involve higher initial qualifications than others. Qualified recruits are channeled into schools to train them for specific jobs.
The Services can reduce the number required to recruit by reducing the number of voluntary losses and attrition, or increasing retention, or both. However, there is a limit to this strategy. The military requires a constant influx of new young people, and therefore it is as important to bring in new young men and women as it is to keep an optimal number of trained and experienced military members. The desired retention rate differs for each Service on the basis of its mission (i.e., the Army and the Marine Corps require more young people to perform very physically demanding duties; Air Force and Navy jobs are generally more technically oriented, require more experienced individuals, and thus have higher targets for first-term retention rates).
SHAPING THE FORCE
Since the end of the Cold War, the U.S. military force has become significantly smaller and has been asked to respond to numerous diverse situations around the world. Some of these situations have required war fighting, others have involved peacekeeping, and still others have focused on humanitarian aid. In many situations, there has been uncertainty concerning whether, how, or at what level U.S. troops should be engaged.
The terrorist attacks of September 11, 2001, on the World Trade Cen-
ter and the Pentagon have put into motion a series of political, economic, and military actions to secure the homeland and to combat terrorism around the world. In response to the terrorist attacks, President Bush and his administration have established a new Office of Homeland Security, obtained international agreements to freeze the assets of terrorist organizations, obtained support from U.S. allies to grant access to airfields and seaports, deployed troops, and ousted the Taliban regime from Afghanistan. In June 2002, the President asked that the Congress join him in creating a single, permanent department (the Department of Homeland Security) with an overriding and urgent mission: securing the homeland of America and protecting the American people. Indications are that this new department will have little impact on the size or shape of the DoD or the military. The war against terrorism continues on many fronts and will be a long one, requiring all national security tools, including the military.
It is difficult to predict what the demands for military forces will be at any given time. The discussion below illustrates current thinking regarding strategies and personnel deployment and the kinds of decisions that must be made. We are aware that the details presented will change as a function of world events.
The most reliable and complete source for current military thinking is the Quadrennial Defense Review or QDR (U.S. Department of Defense, 2001), which addresses certain elements of the NSS and covers virtually all elements of a NMS; we draw primarily on the QDR in this discussion. Much has been said about potentially major changes for the military that could have an impact on the numbers and types of young men and women needed in the “transformed” military. Secretary of Defense Donald Rumsfeld states specifically that a central objective is to shift the basis of defense planning from a “threat-based” model, which has dominated military thinking in the past, to a “capabilities-based” model for the future.
The events of September 11 signaled that the security of the homeland must be the first priority. Government officials now realize that they cannot predict where or when or how America, Americans, or American interests will be attacked. They can no longer focus on the Cold War notion of two nearly simultaneous major theater wars as the sole model for building, equiping, and training U.S. military forces. New strategic planning principles include emphasis on homeland defense, on surprise, on preparing for asymmetric threats, on the need to develop new concepts of deterrence, on the need for a capabilities-based strategy, and on the need to balance deliberately the different dimensions of risk.
The strategy for America’s defense seeks to assure allies and friends that the United States can fulfill its security commitments, to dissuade
adversaries from undertaking operations that could threaten U.S. interests, to deter aggression by swiftly defeating attacks and imposing severe penalties for aggression, and to decisively defeat any adversary if deterrence fails.
DoD has also announced the establishment of a new unified combatant commander for homeland security to help coordinate military efforts. The intent is to accomplish this with the current end strength. However, “Preparing forces for homeland security may require changes in force structure and organization.... U.S. forces...require more effective means, methods, and organizations to perform these missions” (U.S. Department of Defense, 2001:19).
DoD is now specifically required to plan for a larger base of forces from which to provide forward-deployed forces, in order to support long-standing contingency commitments in the critical areas of interest. DoD must ensure that it has sufficient numbers of specialized forces and capabilities so that it does not overstress elements of the force when it is involved in smaller-scale contingency operations (U.S. Department of Defense, 2001:21).
This larger base of forces is to be provided on a rotational basis. As mentioned earlier, the Services calculate deployment numbers in multiples of three: for every soldier on a mission, a second must be in training for that role, and a third will have just returned from the mission assignment and is scheduled for retraining. A recent newspaper article claimed that for every deployed soldier, there are seven in support, which presumably include trainers and base support personnel, in addition to those in the rotation described above.
DoD is developing more effective ways to compute the required rotational base across various types of forces to support forward posture. Changes potentially affecting force structure include: (1) a more streamlined organizational structure with a reduction in headquarters staffs, a consolidation of overlapping functions of Office of the Secretary of Defense, the Services, and the Joint Chiefs of Staff, and changes in military departments; (2) the possibility of a joint Services training capability, the establishment of a Joint Opposing Force, and the creation of a Standing Joint Task Force; and (3) Service-specific decisions to increase presence in various parts of the world.
The current focus on combating terrorism does not change the need to respond to other events around the world as they call for attention. Many of the planning documents in place prior to September 11 still apply. For example, Joint Vision 2020 (Joint Chiefs of Staff, 2000) suggests that U.S. international interests in security, politics, and economics will further expand as a result of the wide availability of new information,
communication, and transportation technologies. Many countries will have access to the same technology, so it will not be possible for the United States and its allies to maintain a total technological advantage over their adversaries. This document also anticipated the increasing use of asymmetric methods, such as the terrorist attacks on September 11.
As plans for force structure are being formulated, advances in technology are making it possible to automate many functions currently performed by personnel. Among these are smart ships, such as the DDX class warships, and remotely piloted, armed aircraft—under development for both the Air Force and the Navy (Hey, 2001). It is anticipated that remotely piloted aircraft being built by Boeing as a Defense Advanced Research Projects Agency effort will cost less to operate and support than manned vehicles; the goal is to have 30 aircraft in operation by 2010 (Hebert, 2001). However, according to Blake Crane, a Heritage Foundation defense analyst, remotely piloted planes are seen as a supplement to manned military craft, not as a replacement (Hey, 2001).
Another initiative is the establishment of two new Air Force squadrons devoted to preparing U.S. defenses against attacks in space on commercial satellites and other spacecraft. One squadron will explore future space technologies, and the other will play the enemy role in war game exercises. Although planning documents discuss many initiatives that could require more people, they also suggest reallocating personnel resources rather than increasing overall end strength.
FORCE CHARACTERISTICS
Force Size
As described above, the size of the U.S. military force is driven by many factors. In response to those factors, the Services are now dramatically smaller than they were a few years ago. After a period of relative stability in force size during the 1970s and early 1980s, the Services have seen a consistent drop since 1987. Between 1987 and 2000, the active component of the enlisted force decreased in size by 38 percent, from 1.85 to 1.15 million enlisted members. During those same years, the reserve component of enlisted strength decreased 26 percent, from 989,000 to 733,000 (U.S. Department of Defense, 2002). (The role of the National Guard has taken on increased importance with the new emphasis on homeland security; however, in this study we did not review data on the National Guard.) The reductions in force size observed during the 1990s appear at this point to have leveled off; in fact, the chiefs of staff of each of the Services suggested in testimony before the Senate Armed Services Committee (March 7, 2002) that force size needs to grow somewhat over the
next few years. Table 2-1 displays the active component of enlisted strength by Service from 1980 through 2000. Table 2-2 displays the reserve component of enlisted strength by Service for the same time period.
Given recent terrorist threats to the United States, it seems unlikely that force sizes will be significantly reduced in the near term from their current levels. In fact, during the development of the QDR, DoD specifically “assessed the current force structure across several combinations of scenarios on the basis of the new defense strategy and force sizing construct.” Some scenarios resulted in moderate operational risk in mission accomplishment; some resulted in “high risk” (U.S. Department of Defense, 2001:22). One could argue that this makes the case for increased force structure—certainly to maintain the current force structure as a minimum. In fact, Congress authorized, in the fiscal year 2002 (FY 2002) budget, each of the Services to have on hand personnel up to 2 percent above their authorized strength. But the money to pay for those additional people was not appropriated; the Services had to take money from other
TABLE 2-1 Active Component Enlisted Strength (in thousands)
|
Fiscal Year |
Army |
Navy |
Marine Corps |
Air Force |
Total DoD |
|
1964 |
860.5 |
585.4 |
172.9 |
720.6 |
2329.4 |
|
1980 |
673.9 |
459.6 |
170.3 |
455.9 |
1759.7 |
|
1981 |
675.1 |
470.2 |
172.3 |
466.5 |
1784.0 |
|
1982 |
672.7 |
481.2 |
173.4 |
476.5 |
1803.8 |
|
1983 |
669.4 |
484.6 |
174.1 |
483.0 |
1811.1 |
|
1984 |
667.7 |
491.3 |
175.9 |
486.4 |
1821.3 |
|
1985 |
666.6 |
495.4 |
177.9 |
488.6 |
1828.5 |
|
1986 |
666.7 |
504.4 |
178.6 |
494.7 |
1844.3 |
|
1987 |
668.4 |
510.2 |
177.0 |
495.2 |
1853.3 |
|
1988 |
660.4 |
515.6 |
177.3 |
466.9 |
1820.1 |
|
1989 |
658.3 |
515.9 |
176.9 |
462.8 |
1813.9 |
|
1990 |
623.5 |
501.5 |
176.5 |
430.8 |
1732.4 |
|
1991 |
602.6 |
494.5 |
174.1 |
409.4 |
1680.5 |
|
1992 |
511.3 |
467.5 |
165.2 |
375.7 |
1519.8 |
|
1993 |
480.3 |
438.9 |
160.1 |
356.1 |
1435.4 |
|
1994 |
451.4 |
401.7 |
156.3 |
341.3 |
1350.7 |
|
1995 |
421.5 |
370.9 |
156.8 |
317.9 |
1267.2 |
|
1996 |
405.1 |
354.1 |
157.0 |
308.6 |
1224.9 |
|
1997 |
408.1 |
334.2 |
156.2 |
299.4 |
1197.9 |
|
1998 |
402.0 |
322.1 |
155.3 |
291.6 |
1170.9 |
|
1999 |
396.2 |
314.3 |
154.8 |
286.2 |
1151.4 |
|
2000 |
402.2 |
314.1 |
155.0 |
282.3 |
1153.6 |
|
SOURCE: Office of the Assistant Secretary of Defense (Force Management Policy) (2000). |
|||||
TABLE 2-2 Reserve Component Enlisted Strength
|
Fiscal Year |
Army National Guard |
U.S. Army Reserve |
U.S. Navy Reserve |
U.S. Marine Corps Reserve |
Air National Guard |
U.S. Air Force Reserve |
Total DoD |
|
1980 |
329,298 |
169,165 |
70,010 |
33,002 |
84,382 |
45,954 |
731,811 |
|
1981 |
350,645 |
188,103 |
72,608 |
34,559 |
85,915 |
52,686 |
784,516 |
|
1982 |
367,214 |
208,617 |
75,674 |
37,104 |
88,140 |
50,553 |
827,302 |
|
1983 |
375,500 |
216,218 |
88,474 |
39,005 |
89,500 |
52,810 |
861,507 |
|
1984 |
392,412 |
222,188 |
98,187 |
37,444 |
92,178 |
55,340 |
897,749 |
|
1985 |
397,612 |
238,220 |
106,529 |
38,204 |
96,361 |
59,599 |
936,525 |
|
1986 |
402,628 |
253,070 |
116,640 |
38,123 |
99,231 |
62,505 |
972,197 |
|
1987 |
406,487 |
255,291 |
121,938 |
38,721 |
100,827 |
63,855 |
987,119 |
|
1988 |
406,966 |
253,467 |
121,653 |
39,930 |
101,261 |
65,567 |
988,844 |
|
1989 |
406,848 |
256,872 |
122,537 |
39,948 |
101,980 |
66,126 |
994,311 |
|
1990 |
394,060 |
248,326 |
123,117 |
40,903 |
103,637 |
66,566 |
976,609 |
|
1991 |
395,988 |
249,626 |
123,727 |
41,472 |
103,670 |
67,603 |
982,086 |
|
1992 |
378,904 |
245,135 |
115,341 |
38,748 |
104,758 |
65,806 |
948,692 |
|
1993 |
363,263 |
219,610 |
105,254 |
38,092 |
102,920 |
64,720 |
893,859 |
|
1994 |
351,390 |
206,849 |
86,300 |
36,860 |
99,711 |
63,411 |
844,521 |
|
1995 |
331,559 |
191,558 |
79,827 |
36,292 |
96,305 |
62,144 |
797,685 |
|
1996 |
328,141 |
179,967 |
77,376 |
37,256 |
97,153 |
57,615 |
777,508 |
|
1997 |
329,288 |
168,596 |
75,373 |
37,254 |
96,713 |
56,068 |
763,295 |
|
1998 |
323,150 |
161,286 |
73,490 |
36,620 |
94,861 |
56,032 |
745,439 |
|
1999 |
319,161 |
161,930 |
69,999 |
35,947 |
92,424 |
55,557 |
735,018 |
|
2000 |
315,645 |
165,053 |
67,999 |
35,699 |
93,019 |
55,676 |
733,091 |
|
SOURCE: Office of the Assistant Secretary of Defense (Force Management Policy) (2000). |
|||||||
portions of their budget if they wished to increase their end strength. In addition, the extra authorization was not included for FY 2003—adding people in one year and having to go back to original end strength the next year is not easily done, even for a few thousand people.
After six months of the war on terrorism, along with all the other military commitments, the Washington Times on April 10, 2002, reported the Services as needing as many as 51,400 more troops (an increase of about 5 percent to current end strength). But the cost of personnel is very high and already a significant proportion of the DoD budget. The article states, “it would cost $40,000 [per year] to add each enlisted person, in addition to the $10,000 to recruit that person.”
Note that the QDR looks for ways other than just increased force structure to mitigate the operational risk, to include possible “changes in capabilities, concepts of operations, and organizational designs” (p. 61). Secretary Rumsfeld is on record as saying that he is not yet ready to
increase end strength—he wants to look for other ways to address these issues. One way is through reductions in current commitments; another is to reduce the numbers of personnel required to accomplish certain functions. A good example is the Navy’s DD-X warship, being built from the ground up to require a crew of only 95, compared with the 300 needed today.
At the same time that force levels were dropping, the average age of Service members was increasing. For example, between 1980 and 1997, the average age of members of the enlisted force rose from 25 to 27 (U.S. Department of Defense, 2002). The overall DoD force profile reveals that about half the enlisted force has less than 6 years of service, 45 percent has between 6 and 19 years of service, and the remaining 4 percent has 20 or more years of service. According to the Office of the Assistant Secretary of Defense (2001), in 2000, the force was 18 percent female as contrasted with 51 percent female in the general civilian population ages 18–24. The ethnic distribution of the force was 62 percent white, 20 percent black, and 11 percent Hispanic as contrasted with 65 percent, 14 percent, and 15 percent, respectively, in the general civilian population ages 18–24.
Even given the uncertainty of future demand and concerns about the adequacy of current end strength numbers, there is no compelling evidence that the requirement for end strength will change radically in the future.
Recruiting Results
The Services have generally responded to decreasing force sizes by lowering the number of new recruits that they acquired in any given year. Some discharge policies were also liberalized during times of downsizing. While the Services required over 388,000 non-prior-service and prior-service recruits in 1980, that number had dropped to 175,000 recruits in 1995—a 55 percent reduction. As a result of these lower numbers of new recruits needed, Service-recruiting commands were generally very successful in meeting their goals during the late 1980s and early 1990s. As Table 2-3 shows, however, some of the Services failed to meet their goals once force sizes leveled off and the numbers of new recruits needed to meet end strength started increasing.
What the table does not show, however, is the relative difficulty of achieving these goals. For example, even if recruiting is very easy in any given year, the Services would not substantially exceed their goals because of congressional limits on their end strength. Thus, one cannot tell from the table alone whether any Service struggled to meet its goal on the last day of the year or was certain it would meet its goal early in the year.
TABLE 2-3 Active Enlisted Recruiting Goals and Success by Service
|
|
Army |
Navy |
Marine Corps |
Air Force |
Total DoD |
|
|||||
|
Fiscal Year |
Goal |
Actual |
Goal |
Actual |
Goal |
Actual |
Goal |
Actual |
Goal |
Actual |
% |
|
1980 |
172,800 |
173,228 |
97,627 |
97,678 |
43,684 |
44,281 |
74,674 |
74,674 |
388,785 |
389,861 |
100 |
|
1981 |
136,800 |
137,916 |
101,904 |
104,312 |
42,584 |
43,010 |
81,044 |
81,044 |
362,332 |
366,282 |
101 |
|
1982 |
125,100 |
130,198 |
81,922 |
92,784 |
40,558 |
40,141 |
73,620 |
73,620 |
321,200 |
336,743 |
105 |
|
1983 |
144,500 |
145,287 |
82,790 |
82,790 |
37,690 |
39,057 |
63,591 |
63,591 |
328,571 |
330,725 |
101 |
|
1984 |
141,757 |
142,266 |
82,907 |
82,907 |
38,665 |
42,205 |
61,079 |
61,079 |
324,408 |
328,457 |
101 |
|
1985 |
125,300 |
125,443 |
87,592 |
87,592 |
36,536 |
36,620 |
67,021 |
67,021 |
316,449 |
316,676 |
100 |
|
1986 |
135,250 |
135,530 |
94,878 |
94,878 |
36,682 |
36,763 |
64,400 |
66,379 |
331,210 |
333,550 |
101 |
|
1987 |
132,000 |
133,016 |
92,909 |
92,909 |
34,713 |
34,872 |
55,000 |
56,029 |
314,622 |
316,826 |
101 |
|
1988 |
115,000 |
115,386 |
93,939 |
93,939 |
35,911 |
35,965 |
41,200 |
41,500 |
286,050 |
286,790 |
100 |
|
1989 |
119,875 |
120,535 |
94,286 |
95,186 |
34,130 |
34,424 |
43,730 |
43,751 |
292,021 |
293,896 |
101 |
|
1990 |
87,000 |
89,620 |
72,402 |
72,846 |
33,521 |
33,600 |
36,249 |
36,249 |
229,172 |
232,315 |
101 |
|
1991 |
78,241 |
78,241 |
68,311 |
68,311 |
30,015 |
30,059 |
30,006 |
30,006 |
206,573 |
206,617 |
100 |
|
1992 |
75,000 |
77,583 |
58,208 |
58,208 |
31,851 |
31,852 |
35,109 |
35,109 |
200,168 |
202,752 |
101 |
|
1993 |
76,900 |
77,563 |
63,073 |
63,073 |
34,802 |
34,776 |
31,515 |
31,515 |
206,290 |
206,927 |
100 |
|
1994 |
68,000 |
68,039 |
53,964 |
53,982 |
32,056 |
32,056 |
30,000 |
30,019 |
184,020 |
184,096 |
100 |
|
1995 |
62,929 |
62,929 |
48,637 |
48,637 |
32,346 |
33,217 |
30,894 |
31,000 |
174,806 |
175,783 |
101 |
|
1996 |
73,400 |
73,418 |
48,206 |
48,206 |
33,173 |
33,496 |
30,867 |
30,867 |
185,646 |
185,987 |
100 |
|
1997 |
82,000 |
82,088 |
50,135 |
50,135 |
34,512 |
34,548 |
30,310 |
30,310 |
196,957 |
197,081 |
100 |
|
1998 |
72,550 |
71,733 |
55,321 |
48,429 |
34,244 |
34,285 |
30,194 |
31,685 |
192,309 |
186,132 |
97 |
|
1999 |
74,500 |
68,209 |
52,524 |
52,595 |
33,668 |
33,703 |
34,400 |
32,673 |
195,092 |
187,180 |
96 |
|
2000 |
80,000 |
80,113 |
55,000 |
55,147 |
32,417 |
32,440 |
34,600 |
35,217 |
202,017 |
202,917 |
100 |
|
2001 |
75,800 |
75,855 |
53,520 |
53,690 |
31,404 |
31,429 |
34,600 |
35,381 |
195,324 |
196,355 |
101 |
|
SOURCE: Office of the Assistant Secretary of Defense (Force Management Policy) (2001). |
|||||||||||
What is shown by the data, however, is that fiscal years 1998 and 1999 were very difficult for many Services since they did not meet their goals.
Force Quality
The size of the force (end strength) is specified by Congress, in response to many factors, as described earlier. Service effectiveness, however, depends on more than just end strength; the education and aptitude of Service personnel has a direct relationship to mission performance (Armor and Roll, 1994). As noted in the QDR (U.S. Department of Defense, 2001:9):
The Department of Defense must recruit, train, and retain people with the broad skills and good judgment needed to address the dynamic challenges of the 21st century. Having the right kinds of imaginative, highly motivated military and civilian personnel, at all levels, is the essential prerequisite for achieving success. Advanced technology and new operational concepts cannot be fully exploited unless the Department has highly qualified and motivated enlisted personnel and officers who not only can operate these highly technical systems, but also can lead effectively in the highly complex military environment of the future.2
Typically, two measures are used to assess the overall education and aptitude of the enlisted force: cognitive ability (as measured by scores on the Armed Forces Qualification Test [AFQT]) and educational attainment. DoD sets minimum levels required in both areas for new recruits; the Services can—and often do—set their own enlistment standards that can exceed the minimums established by DoD (See Chapter 4, this volume).
As measured by either AFQT or educational attainment levels, the Services today have a highly qualified enlisted force. Of the 1.15 million active component enlisted members in the Services at the end of FY 2000, 96 percent held at least a high school diploma, while an additional 3.3 percent held an alternative high school credential (e.g., a GED certificate). The combined 99.3 percent of enlisted members holding some type of high school credential compares very favorably with the civilian population rate (ages 18–44) of 88.6 percent (Office of the Assistant Secretary of Defense, 1999:Table 3-7).
Because the AFQT is used primarily as a qualifying standard for enlistment, DoD does not routinely report the AFQT levels of the entire enlisted force. DoD does report, however, the AFQT levels for each acces-
sion cohort. Although a more complete discussion of military service enlistment standards—including AFQT—is presented in Chapter 4, Table 2-4 clearly shows that qualification levels for entering cohorts generally increased until 1992 then began a slight decline. Even considering the more recent decline, however, current education achievement and aptitude levels compare very favorably with those of the civilian population ages 18–23. This is by design, since the military requirement is to recruit 60 percent from the population scoring in the top 50 percent of the AFQT.
Although the force is highly qualified today, as noted above, there has been speculation that future military service roles and missions may require even higher qualifications. The heavy emphasis on technical skills in the military of the future adds to this speculation. Alternatively, recent RAND research concluded that future military jobs would require no significant changes in abilities from those observed in today’s military;
TABLE 2-4 Active Enlisted Accessions by AFQT Category (percentage)
|
Year |
I-IIIA |
IIIB |
IV |
Unknown |
|
1980 |
48.7 |
42.2 |
8.7 |
0.4 |
|
1981 |
47.3 |
31.1 |
21.3 |
0.3 |
|
1982 |
52.0 |
32.4 |
15.2 |
0.4 |
|
1983 |
57.5 |
31.4 |
10.7 |
0.4 |
|
1984 |
58.2 |
32.0 |
9.5 |
0.4 |
|
1985 |
60.2 |
31.9 |
7.5 |
0.3 |
|
1986 |
62.4 |
32.5 |
4.9 |
0.2 |
|
1987 |
67.0 |
28.2 |
4.7 |
0.2 |
|
1988 |
66.5 |
28.1 |
4.9 |
0.5 |
|
1989 |
64.4 |
28.4 |
6.4 |
0.8 |
|
1990 |
68.0 |
28.3 |
3.1 |
0.7 |
|
1991 |
72.1 |
26.5 |
0.5 |
0.9 |
|
1992 |
74.9 |
24.5 |
0.2 |
0.4 |
|
1993 |
71.1 |
27.7 |
0.8 |
0.4 |
|
1994 |
70.6 |
28.3 |
0.7 |
0.4 |
|
1995 |
70.1 |
28.8 |
0.7 |
0.5 |
|
1996 |
68.5 |
30.0 |
0.7 |
0.7 |
|
1997 |
68.3 |
30.3 |
1.0 |
0.5 |
|
1998 |
67.5 |
31.1 |
1.0 |
0.4 |
|
1999 |
65.1 |
33.0 |
1.4 |
0.6 |
|
2000 |
65.8 |
33.1 |
0.7 |
0.4 |
|
Civilian Population Ages 18–23 |
||||
|
Year |
I-IIIA |
IIIB |
IV |
Other |
|
1980 |
51.4 |
18.28 |
21.03 |
9.28 |
|
SOURCE: Office of the Assistant Secretary of Defense (Force Management Policy) (2000). |
||||
however, in a few specific military occupations, the abilities of the current workforce might not be sufficient for future jobs in those occupations (Levy et al., 2001). The answer may be in evolving changes to military training for basically qualified recruits.
Skills
One question that arises when attempting to determine the abilities required by future military jobs is whether (and how) the distribution of jobs has changed in the past. Gribben (2001) directly addressed this question with regard to military occupational categories. Table 2-5 displays the results of her analysis. Even given the dramatic drop in numbers of Service personnel over the last 25 years, there has been relatively little change in the distribution of military personnel in these occupational areas. Gribben notes that the “dramatic increases in technology-oriented positions in the civilian workplace during the last 25 years are not very closely tied to occupational area trends in the military during the same time period.”
Interviews with senior personnel managers in DoD and the Services confirm that no special skills are anticipated to be a prerequisite for military service—given young men and women who meet the minimum qualifications, they can and will be trained to meet changing military requirements. This emphasizes the importance of the skills training mission by the Services and requires periodic evaluation to ensure that training fills the gaps between the abilities that recruits bring to the Services
TABLE 2-5 Enlisted Member Occupational Distribution by Year (percentage)
|
Code |
Title |
1976 |
1980 |
1985 |
1990 |
1995 |
2000 |
|
0 |
Infantry specialists |
12.9 |
13.9 |
14.5 |
17.1 |
17.1 |
16.9 |
|
1 |
Electronic equipment repairers |
9.2 |
8.8 |
9.5 |
9.9 |
9.8 |
9.7 |
|
2 |
Communications and intelligence specialists |
8.2 |
8.3 |
9.5 |
9.8 |
8.7 |
8.8 |
|
3 |
Health care specialists |
4.4 |
4.4 |
4.8 |
5.6 |
6.7 |
6.7 |
|
4 |
Other technicians |
2.2 |
2.1 |
2.4 |
2.3 |
2.5 |
3.0 |
|
5 |
Support and administration |
15.5 |
15.3 |
15.8 |
15.5 |
16.1 |
16.1 |
|
6 |
Electical/mechanical equipment repairers |
19.0 |
19.8 |
20.1 |
20.1 |
19.5 |
19.7 |
|
7 |
Craftsworkers |
4.2 |
4.0 |
4.2 |
4.0 |
4.0 |
3.5 |
|
8 |
Service and supply handlers |
10.3 |
8.9 |
9.4 |
8.9 |
8.9 |
8.4 |
|
9 |
Nonoccupational |
14.1 |
14.4 |
9.8 |
6.9 |
6.6 |
7.2 |
|
SOURCE: Gribben (2001). |
|||||||
and what is required. The military has no control over the subject matter taught in the high schools and thus there are no guarantees that high school graduates will have the necessary skills and motivation to perform military jobs.
At the Army 2010 Conference: Future Soldiers and the Quality Imperative, (May–June 1995), discussions included the projection that future soldiers “will require better problem solving and decision making skills that will enable them to go beyond the application of rote procedures to ‘think outside the box’” (paper presented by Donald Smith, HumRRO). At the same conference, Michael G. Rumsey of the U.S. Army Research Institute reported on a project conducted in 1994. Rumsey and five other behavioral scientists prioritized 15 attributes based on the Army’s Project A job analyses. They overwhelmingly viewed cognitive ability to be the most important attribute for future success (Rumsey, 1995).
A more recent and more detailed study on the characteristics of 21st century Army soldiers followed up Rumsey’s work and confirmed the finding that cognitive aptitude is of the highest priority for the enlisted soldier of the future (Ford et al., 1999). Other high-priority knowledge, skill, and ability areas identified by Ford and her colleagues include conscientiousness/dependability, selfless service orientation, and a good working memory capacity. These represent a slight departure from skill, knowledge, and ability ratings for the force in the 1990s, for which conscientiousness/dependability was ranked first, followed by general cognitive aptitude and the need to achieve. The methodology for this study included evaluation and ranking of job characteristics and job skill, knowledge, and aptitude requirements for the next 10 and 25 years, respectively, by three panels—one composed of subject matter experts (active Army senior noncommissioned officers representing 21 military occupational specialties), one composed of psychologists who worked from the lists prepared by the subject matter experts, and one composed of project staff who worked from the outputs of the previous two panels. The baseline lists were drawn from earlier Army projects and visits of Army facilities.
The Navy Personnel Research and Development Center published Sailor 21: A Research Vision to Attract, Retain, and Utilize the 21st Century Sailor on December 14, 1998. A key framing concept for this study is that these new technologies may require fewer people, but they must be more capable, faster, and able to perform a much broader range of tasks (Navy Personnel Research and Development Center, 1998).
Regarding the Marine Corps, then Commandant General Charles C. Krulak wrote in the January 1999 edition of the Marine Corps Gazette, “In many cases, the individual Marine will be the most conspicuous symbol of American foreign policy and will potentially influence not only the
immediate tactical situation, but the operational and strategic level as well.” Hence the term, “the strategic corporal.” In order to meet these needs, timely and responsive changes to training are necessary. New systems are especially problematic as schedules slip and funding is used for other priorities. To the extent possible, training changes should be anticipatory, especially for new systems.
Operations in Afghanistan in 2001–2002 have highlighted the challenges awaiting military men and women of the future. The environment was much different from what they had trained for. Soldiers adapted, adopted, and prevailed. For example, they traveled on horseback while using 21st century technology to designate targets.
There are two reasons why the emerging technology-oriented military is unlikely to require higher-level technical skills in the aggregate from its recruits at the point of entry into military service. The first is the observation that with increased technologies, the general level of computer and other forms of technical literacy in the general population has been rising concurrently. We live in a computer ambience that readily takes care of most basic skill requirements. This is particularly true of the nation’s youth. Rather than a need, for example, for massive new school programs to teach computing to young people, youth have typically taught their elders, including parents and teachers. A second reason the military is unlikely to need to ratchet up its average level of technical skills requirements follows from what has been learned about civilian jobs that underwent technological change and what changes in the labor force were likely to be due to technology. Although there have been substantial changes in the education and skill requirements for particular occupations, industries, and sectors of the economy, skills upgrading in some areas has been accompanied by downgrading in others, leaving only a slow, upward drift in skill requirements in the aggregate economy over time (Cyert and Mowery, 1987; Handel, 2000). Overall, there was not much net change. The notion that high-tech jobs require new batteries of sophisticated skills is not supported by the evidence.
In sum, observational and research studies of civilian jobs and workplaces that have gone through technological evolutions suggest that skill levels increase in some jobs but decrease in others. On balance, the civilian labor force hasn’t been affected very much by technological change, and it is unlikely that the military experience will be any different.
RETENTION AND RECRUITING
As mentioned earlier in this chapter, fully staffed military services anticipate personnel turnover, and unit readiness is predicated, in part, on maintaining acceptable rates of retention. Retention is negatively af-
fected operationally by attrition. Attrition rates that exceed expectations translate into heightened recruitment needs and goals.
Retention relates to recruitment in five ways. First, retained personnel are the largest numerical component of a fully manned service. As attrition rates increase, the need for replacements increases, which puts pressure on recruitment capabilities. Second, to the extent that attrition rates are differentiated across occupational specialties within a Service, unplanned attrition further compromises mission readiness. Retention is more than maintaining total head counts within a Service. The mix of personnel is also critical to readiness and mission accomplishment. Retaining an appropriate force mix has become increasingly challenging.
Third, skill levels must be maintained at appropriate levels. The Services “grow their own,” and newly minted recruits cannot immediately replace seasoned veterans. For example, press reports indicated that in the late stages of the most recent Bosnian conflict, advanced military helicopters were on site and combat ready, but the equipment remained grounded for lack of combat-experienced pilots. Recruitment is not a quick fix for retention shortfalls.
Fourth, the problems associated with within-Service supply-demand imbalances may be generalized across the Services. Each Service is part of a team with the other Services, and differential rates of attrition among the Services may also compromise readiness. Differential rates of attrition by military occupational specialties coupled with supply-demand imbalances across the Services dictate the qualifications that must be sought in recruits in a given period.
A similar problem exists in the relationship between the active-duty forces and the Reserves. The increasing operational tempo in recent years has necessitated the increased participation of the Reserves. From November 1994 through December 2000, the use of Reserve forces increased from 8 to 12 million man-days per year (U.S. Department of Defense, 2001:58). With the Reserves primarily responsible for a key component of the highest defense priority, homeland defense, increased attention must be paid to Reserve recruiting.
Fifth, the expressed quality of military experience contributes to the attractiveness of military service for potential recruits. Recruitment goals are affected by policy changes, such as the planned 1991–1997 downsizing of the military, and the mix of occupational specialties changes in response to, for example, technological innovations and applications. However, assuming reasonably stable personnel demands over time, the extent to which the Services can maintain acceptable retention rates by enhancing the perceived quality of the military experience may effectively lower numerical recruitment requirements and build recruitment capabilities.
There’s an old saying that when you recruit the military member, you
retain the family. The QDR specifically focuses on quality of life issues as “critical to retaining a Service member and his or her family. Recent surveys conducted by the Department indicate that the two primary reasons that Service members leave or consider leaving are basic pay and family separation” (U.S. Department of Defense, 2001:9). Also, when the U.S. economy is strong, military members (and potential military members) have more alternatives. When jobs in the economy are hard to find, more young men and women view the military as a viable alternative for employment (Warner et al., 2001).
In sum, recruitment needs are in part a function of service retention capabilities: each Service’s ability to retain personnel within acceptable rates of attrition and voluntary losses at the level required in each military occupational specialty (MOS). Attrition rates that exceed expectations translate into additional, unexpected recruitment needs.
First-Term Attrition
Table 2-6 presents aggregate rates of attrition for the military at 6, 12, 24, and 36 months over the 15-year period, 1985–1999. The size of the entry cohorts ranged from a high of 315,000 in 1986 to about half that many, 168,000, in 1995. The size of the most recent cohorts was about 10 percent higher than the smallest cohorts since 1985, averaging about 185,000—well below the size of the entry cohorts at the beginning of the period. Following the 1991–1997 drawdown, recruitment goals have remained modest, which suggests that recruitment difficulties cannot be attributed to increasing recruitment goals.
From 1985 to 1999, aggregate attrition in the military rose systematically over each period for which losses were calculated—6, 12, 24, and 36 months. Attrition at 6 months rose from about 11 percent to about 15 percent; at 12 months from about 14 to about 19 percent; at 24 months from about 22 to about 26 percent; and at 36 months from about 28 to about 31 percent. Taking both cohort size and attrition rates into account indicates an inverse relationship between the two.
The incremental increases in the cumulative attrition percentages remained relatively constant over the 15-year period. Attrition at the end of 6 months ranged from 11 to 16 percent. Losses over the period 6 to 12 months contributed about another 4 percent. Losses over 12 to 24 months contributed about 8 percent more, and losses over 24 to 36 months contributed about another 6 percent. In sum, the largest aggregate military attrition occurred within the first 6 months. About half of the cumulative attrition occurred by 12 months and, beginning about 1990, the period of
TABLE 2-6 Aggregate Military Attrition at 6, 12, 24, and 36 Months, 1985–1999
|
Enlisted during FY |
1985 |
1986 |
1987 |
1988 |
1989 |
1990 |
1991 |
1992 |
1993 |
1994 |
1995 |
1996 |
1997 |
1998 |
1999 |
||
|
Percentage lost at 6 mos. |
11 |
12 |
11 |
12 |
11 |
11 |
12 |
12 |
15 |
15 |
15 |
14 |
14 |
16 |
15 |
||
|
Percentage lost at 12 mos. |
14 |
15 |
15 |
15 |
16 |
15 |
16 |
16 |
18 |
19 |
19 |
19 |
18 |
20 |
19 |
||
|
Percentage lost at 24 mos. |
22 |
23 |
22 |
22 |
23 |
23 |
24 |
23 |
26 |
26 |
27 |
25 |
26 |
26 |
— |
||
|
Percentage lost at 36 mos. |
28 |
29 |
28 |
28 |
30 |
29 |
30 |
29 |
32 |
33 |
33 |
31 |
31 |
— |
— |
||
|
Size of entry cohort |
301K |
315K |
297K |
273K |
278K |
224K |
201K |
201K |
200K |
176K |
168K |
180K |
189K |
180K |
184K |
||
|
SOURCE: Correspondence from Vice Admiral P.A. Tracey, U.S. Department of Defense, Washington, DC (2001). |
|||||||||||||||||
the drawdown, the proportion of cumulative attrition occurring by 12 months edged even higher.
There is preliminary indication that a turnaround in attrition rates may be taking place. All Services met their fiscal year 2001 recruiting goals. Furthermore, all Service branches were meeting their cumulative goals for retaining first-term enlisted personnel. However, while the Marine Corps and the Army were exceeding goals for second-term and career enlisted personnel, the Navy and the Air Force fell short.
Attrition rates for the separate Services over the 15-year period follow the general pattern of the aggregate rates, as expected, although there are exceptions and countertrends (Table 2-7).
Thus, attrition rises over the measurement period for each Service. The incremental increases in cumulative attrition at 6, 12, 24, and 36 months for each Service remained relatively constant. The largest attrition rates for the Services occurred within the first 6 months. As noted below, there are some differences by Service in the proportion of total attrition that occurred by 12 months. Finally, beginning about 1990, the proportion of cumulative attrition occurring by 12 months increased across the Services except for the Marine Corps. (This could be partially explained by differing Service policies during the drawdown, some having very liberal discharge policies in order to reduce their numbers.) It can further be seen from Table 2-7 that there are some differences in attrition patterns among the Services.
The Services met their aggregate and separate service recruitment goals for the year 2001. Nonetheless, the DoD’s April Readiness Report (Grossman, 2001:S1) indicated that the Navy and the Air Force experienced some difficulty in meeting recruitment targets for specific military occupation specialties. Thus, the immediate recruitment and retention challenge for the Services may no longer be meeting end strength goals but manning selected career areas to ensure that shortfalls in critical areas do not compromise unit readiness. The Readiness Report (Grossman, 2001:S1) noted several enlisted retention challenges by Service. For example, the Army needed soldiers with skills in specialized languages, signal communications, information technology, and weapon systems maintenance. The Navy needed some enlisted personnel with high-tech ratings. The Marines needed technical specialists, such as intelligence, data communications experts, and air command and control technicians. The Air Force needed air traffic controllers and communications/computer system controllers with 8 to 10 years of military service.
As the military’s warrior mission evolves into an efficient, effective, technologically sophisticated, fast-strike force, its susceptibility to paralysis for lack of capacity to man critical occupational specialties becomes increasingly apparent. Power outages for human resource reasons are no
TABLE 2-7 Service Attrition at 6, 12, 24, and 36 Months, 1985–1999
|
Enlisted during FY |
1985 |
1986 |
1987 |
1988 |
1989 |
1990 |
1991 |
1992 |
1993 |
1994 |
1995 |
1996 |
1997 |
1998 |
1999 |
|
Army |
|||||||||||||||
|
Percentage lost at 6 months |
10 |
10 |
9 |
10 |
10 |
11 |
13 |
13 |
15 |
16 |
15 |
15 |
12 |
18 |
16 |
|
Percentage lost at 12 months |
14 |
14 |
13 |
14 |
14 |
14 |
17 |
17 |
19 |
20 |
19 |
20 |
16 |
22 |
20 |
|
Percentage lost at 24 months |
23 |
23 |
22 |
22 |
23 |
24 |
26 |
25 |
28 |
28 |
28 |
26 |
25 |
30 |
— |
|
Percentage lost at 36 months |
29 |
29 |
29 |
29 |
31 |
32 |
33 |
32 |
35 |
36 |
33 |
33 |
32 |
— |
— |
|
Navy |
|||||||||||||||
|
Percentage lost at 6 months |
11 |
13 |
13 |
14 |
13 |
10 |
10 |
13 |
16 |
16 |
16 |
14 |
16 |
15 |
17 |
|
Percentage lost at 12 months |
15 |
18 |
17 |
19 |
18 |
15 |
14 |
17 |
20 |
21 |
21 |
21 |
22 |
20 |
22 |
|
Percentage lost at 24 months |
23 |
26 |
25 |
26 |
25 |
23 |
23 |
25 |
28 |
29 |
30 |
29 |
29 |
28 |
— |
|
Percentage lost at 36 months |
29 |
32 |
30 |
30 |
31 |
30 |
28 |
30 |
33 |
35 |
36 |
34 |
34 |
— |
— |
|
Air Force |
|||||||||||||||
|
Percentage lost at 6 months |
9 |
11 |
10 |
9 |
9 |
10 |
11 |
9 |
12 |
12 |
13 |
12 |
13 |
12 |
12 |
|
Percentage lost at 12 months |
12 |
13 |
12 |
11 |
12 |
12 |
13 |
12 |
14 |
14 |
16 |
15 |
15 |
14 |
15 |
|
Percentage lost at 24 months |
17 |
18 |
17 |
16 |
17 |
19 |
20 |
18 |
20 |
20 |
22 |
21 |
21 |
20 |
— |
|
Percentage lost at 36 months |
22 |
22 |
22 |
20 |
22 |
25 |
25 |
23 |
26 |
26 |
27 |
26 |
25 |
— |
— |
|
Marine Corps |
|||||||||||||||
|
Percentage lost at 6 months |
14 |
16 |
13 |
13 |
14 |
16 |
14 |
13 |
14 |
13 |
15 |
13 |
15 |
16 |
13 |
|
Percentage lost at 12 months |
18 |
20 |
17 |
16 |
18 |
20 |
19 |
17 |
18 |
18 |
19 |
17 |
19 |
19 |
17 |
|
Percentage lost at 24 months |
25 |
26 |
24 |
22 |
23 |
26 |
25 |
23 |
24 |
24 |
25 |
23 |
25 |
24 |
— |
|
Percentage lost at 36 months |
32 |
34 |
31 |
28 |
29 |
33 |
31 |
29 |
29 |
30 |
31 |
28 |
29 |
— |
— |
|
SOURCE: Correspondence from Vice Admiral P.A. Tracey, U.S. Department of Defense, Washington, DC (2001). |
|||||||||||||||
less crippling than those caused by defects in material and machines. Lest the lesson be lost: the Apache helicopters grounded in Bosnia for lack of experienced pilots portend an increasingly critical dimension to the military recruitment/retention challenge.
Why Members of the Enlisted Force Leave the Service
Although there are indications that the Services may currently be experiencing a welcomed resurgence in retention and recruitment rates, in recent years the military has had difficulty meeting its retention goals. This section examines the reasons for attrition and voluntary losses—why military members leave the Services—from several perspectives. With strong caveats about the quality of the available data, we examine the Service reports on the reasons personnel leave the military as indicated by broad separation codes. We also peruse Service career intention surveys, which monitor the attitudes and plans of troops under contract, and we review exit interviews with personnel separating from service for the years 1999, 2000, and 2001.
First-Term
The Services employ eight broad separation codes as reasons personnel leave the military:
|
Behavior |
Failure to meet performance standards, misconduct, in lieu of trial by courts martial, drug/alcohol rehabilitation failure, etc. |
|
Medical |
Disability/injury, failed medical physical procurement standards, etc. |
|
Hardship |
Hardship, parenthood, custody |
|
Other |
Personality disorder, conscientious objector, fraudulent enlistment, defective enlistment agreement, insufficient retainability, military security program, etc. |
|
Homosexual |
As stated |
|
Weight |
Weight control failure |
|
Unknown |
As stated |
|
Pregnancy |
As stated |
Note that each Service can interpret these codes somewhat differently, which may contribute to some of the differences.
Table 2-8 reports percentages of first-term attrition for men and women by service over the years 1993–1995. Overwhelmingly, men tend to leave the Services for behavior reasons defined as “failure to meet
TABLE 2-8 Reasons for First Term Attritions, Men and Women by Service, 1993–1995 (percentage)
|
|
Army |
Navy |
Marine |
Air Force |
||||
|
|
Men |
Women |
Men |
Women |
Men |
Women |
Men |
Women |
|
Behavior |
82 |
48 |
42 |
11 |
60 |
34 |
47 |
21 |
|
Medical |
12 |
17 |
10 |
16 |
15 |
18 |
15 |
22 |
|
Hardship |
0 |
7 |
0 |
4 |
0 |
8 |
3 |
3 |
|
Other |
2 |
2 |
48 |
44 |
21 |
6 |
23 |
24 |
|
Homosexual |
0 |
0 |
0 |
0 |
0 |
0 |
2 |
2 |
|
Weight |
2 |
1 |
0 |
0 |
5 |
4 |
1 |
1 |
|
Unknown |
2 |
0 |
0 |
0 |
0 |
0 |
10 |
10 |
|
Pregnancy |
0 |
25 |
0 |
24 |
0 |
31 |
0 |
17 |
|
SOURCE: Correspondence from Vice Admiral P.A. Tracey, U. S. Department of Defense, Washington, DC (2000). |
||||||||
performance standards, misconduct, in lieu of trial by courts martial, drugs/alcohol rehab failure, etc.” Attrition for behavior reasons is highest in the Army, 82 percent. The rate for the Marines is 60 percent, followed by the Air Force at 47 percent. The reason for most separations in the Navy is “other,” defined as “personality disorder, conscientious objector, fraudulent enlistment, defective enlistment agreement, insufficient retainability, military security program, etc.” “Other” is the second-highest percentage reason that men separate from the Marines and the Air Force, which report rates of 21 and 23 percent, respectively. The second-highest rate for separation from the Navy is behavior, 42 percent. Medical reasons are the third-highest percentage reason. Percentages for other reasons for separation vary from 10 to 15 percent across the Services. Except for “unknown” reasons reported in the Air Force (10 percent), no other reason accounts for more than 5 percent of men’s separations.
Attrition rates for women are more varied. Most women who leave the Army do so for behavior reasons, as do their male colleagues, although the percentage is sharply lower for women, 48 compared with 82 percent. The same pattern holds for women who leave the Marines. Most separate for behavior reasons, although the percentage is sharply lower than it is for men, 34 compared with 60 percent. Women who leave the Navy do so primarily for “other” reasons. Women who separate from the Air Force do so for the most varied reasons. One of four women who leave the Army and the Navy leave for pregnancy, as do nearly one of
three who leave the Marines. In summary, men tend to leave the military for behavior reasons, followed by “other” and medical reasons. Women also leave for behavior reasons, but the pattern of separations for women is more varied, less concentrated on behavior, and includes pregnancy.
Separation After the First Term
Each of the Services conducts career intention or exit surveys, which they use to monitor the career intent of troops under contract. These include
-
Army: Sample Survey of Military Personnel (SSMP);
-
Navy: Quality of Life Domain Survey (NQLDS);
-
Air Force: Air Force New Directions Survey;
-
Marine Corps: Marine Corps Retention Survey and Marine Corps Exit Survey.
Data on intentions and attitudes toward the Service can be extremely useful in identifying broad domains of factors that enlistees report as influencing either their career intentions or their decision to leave. Classes of variables examined in one or another survey include the attitudes of spouses and families toward staying in the Service, satisfaction with job characteristics, compensation, the availability of civilian jobs, promotion opportunities, pride in the Service, time away from home, and other quality-of-life issues. However, the data currently collected from these surveys cannot support any strong general conclusions regarding which factors have the largest effect on intentions or on decisions, due to the low response rates and differing data-gathering strategies across the Services.
Our review of the survey documentation led the committee to a number of observations: Better data are needed to understand why some individuals choose to separate from the Services, while others reenlist; the quality of the Service retention and exit surveys is suspect; and technical characteristics of the data are often not reported. Furthermore, the surveys tend to focus on interviewing large numbers of respondents rather than selecting smaller representative samples. Due to low response rates, the data that are collected may not adequately represent the attitudes of those reaching the end of a particular enlistment term, and inappropriate conclusions may be drawn. In addition, tests for bias, reliability, and validity are not used, and analyses are typically limited to reporting simple percentages. While in our view a systematic approach to investigating retention would be very valuable to the Services, a detailed consideration of this topic is beyond the scope of this study.
Hidden Costs of Attrition
In addition to the immediate pressures that unacceptable attrition contributes to recruitment goals, there are hidden costs. Four are particularly noteworthy. The first is that attrition in labor-intensive industries including the military is expensive. High attrition costs the taxpayer and requires reallocation of scarce resources within the Services. Two studies provide rough estimates of the costs per attrition. Bowman (2001) reports that for each soldier who leaves, the Army has to spend $31,000 to train a new one. In addition, in 1996 the General Accounting Office reported that the investment in each enlistee separating in the first 6 months was $23,000 per enlistee (U.S. General Accounting Office, 1997).
A second hidden cost issues from the need to build unit cohesion within the military, to ensure such intangibles as collective memory and a shared culture that enhances unit performance. The carriers and articulators of unit cultures are those retained in active service and, for that reason, too, maintaining a critical mass of active-duty troops is a necessity.
Another impact is closely related. Attrition rates may be interpreted as an unobtrusive measure of quality of life in the military, which is affected by long-standing personnel policies. The litany of service personnel grievances includes low pay; decaying infrastructure, including poor housing and dated base facilities; outdated pension and retirement policies; family-unfriendly relocation policies and inadequate health care services; and such unglamorous workplace deficits as deficient spare parts inventories (Dao, 2001). To the extent that these affect morale and esprit de corps, personnel efficiencies and effectiveness suffer.
Unacceptable attrition rates also affect the care and nurturance of the national recruitment environment. Recruits on delayed entry status, trainees, and soldiers return to civilian life with stories to tell, be they positive or negative. Experiences related by active personnel and personnel separating from service define the viability of military service for the nation’s youth. The expressed quality of the military experience articulated by those who have “been there, done that” frames the attractiveness and colors the perceptions of the military career option.
The costs of attrition are broader and deeper than merely adding pressure to the military recruitment apparatus—the most significant being in the area of operational readiness. Because of the interrelated aspects of recruiting and retention, all efforts to more fully integrate them into complementary efforts through the planning and budgeting process could hold significant benefits.
SUMMARY
We support the DoD efforts defined by the QDR to “institute programs to...encourage talent to enter and stay in the military and civilian service....The Department must forge a new compact with its warfighters and those who support them—one that honors their service, understands their needs, and encourages them to make national defense a lifelong career” (U.S. Department of Defense, 2001:50).
In spite of changing missions and requirements for the military, indications are that the size of the military will not increase significantly over the next 20 years. Although as priorities change, the force mix among military occupational specialties and among the active-duty, Reserve and National Guard structures will also change with increasing emphasis on the Reserves and the National Guard because of the newly emphasized responsibilities associated with homeland defense. The recruitment and retention of both the Reserve force and the National Guard must receive appropriate attention.
Given current trends, it seems extremely doubtful that the force size will decrease, easing pressures on recruiting. In addition, physical and moral requirements for military service are unlikely to change over the next 20 years. The Services are currently accessing recruits who have sufficient aptitude and can be trained to perform military tasks adequately. Recruits satisfying current quality levels can be trained to meet future demands.
There have been few major changes in the occupational distribution of first-term personnel in the past 10 years, but future military missions coupled with advances in technology are expected to require military personnel to make greater use of technology. Technological changes will make some jobs in the future easier and others more difficult, but overall minimum aptitude requirements are unlikely to change much over the next 20 years.
Changes in national security strategy and national military strategy have the potential to influence the size and shape of the Services. The current administration’s emphasis on transformation, as well as recent new emphasis on homeland security, could also argue for changes in force size and shape, to include balancing the forces between active-duty, reserve, and National Guard forces. The QDR Report provides some of these decisions and also requires studies to provide the rationale for future decisions that could affect military force structure. In addition, changing technology can affect the numbers and types of people needed in the military of the future.
It is the required military force structure and the difference between that and the current population less anticipated annual losses that deter-
mine the numbers required to be recruited. Controlling losses can mitigate recruiting requirements to some extent.
Assuming the validity and the urgency of attrition rates and retention expectations, the task at hand is to bring knowledge and information to bear that informs policies and practices designed to enhance retention and to expand the recruitment pool. In fact, the QDR specifically states, “DoD can no longer solely rely on such ‘lagging’ indicators as retention and recruiting rates to detect personnel problems; by the time those indicators highlight a problem, it is too late” (U.S. Department of Defense, 2001:59).


