
3
Water Use Data and Their Application
At its heart, a water use program is only as good as the quality of its data. This chapter is concerned with these data—the need for high-quality data, categories of data, and metadata and their value at various scales of space and time. Later in the chapter is a series of case studies based on a fairly comprehensive, site-specific set of data from Arkansas. These studies demonstrate how high-quality water use data can be used to show spatial and temporal patterns in groundwater and surface water use, water use intensity, and water stress. Finally, we end with a summary of some of the relevant federal databases that may be used to assist in making water use estimates, especially in states that have limited datasets of their own.
THE NEED FOR WATER USE DATA
Water use is part and parcel of the water budget. In much of the eastern half of the nation and in parts of the Northwest, where precipitation is greater than potential evapotranspiration, most water is used in the same basin from which it is withdrawn (with important exceptions such as New York City and Boston). In arid parts of the nation, precipitation is considerably less than potential evapotranspiration, and surface water and groundwater resources are often scarce. This has led to extensive mining of nonrenewable water in groundwater storage and to the importing of water from outside basin boundaries to meet water supply needs. Many regions rely heavily on water provided to reservoirs from melting winter mountain snow packs. These regional limitations on water availability have led to complex water rights laws and intrastate and interstate water rights legal battles. See, for example, Marc Reisner’s book Cadillac Desert: The American West and
Its Disappearing Water (Reisner, 1986). Examples of western water problems are described in Boxes 3.1 and 3.2.
Much as debits, credits, and savings in a financial budget need to be quantified to maintain fiscal responsibility, the nation’s water use needs to be comprehensively quantified within the water-budget context to ensure adequate availability of water as future water demands regionally fluctuate because of changes in climate, urban growth patterns, agricultural practices, and energy needs.
Many of the other components of the water budget are well studied. The National Oceanic and Atmospheric Administration (NOAA) monitors nationwide precipitation input—e.g., through the NEXRAD program (http://www.roc.noaa.gov/) and individual precipitation stations (http://www.websites.noaa.gov/guide/sciences/atmo/precip.html). Much of the nation’s surface water flow is similarly monitored by the U.S. Geological Survey (USGS) at high temporal and significant spatial resolutions to allow projections to be made on flood frequency, discharge, river stage, and reservoir and lake storage. The USGS has also developed and continues to develop extensive regional datasets on changes in groundwater levels and the status of the nation’s major aquifer systems (http://water.usgs.gov/cgi/rasabiblio; http://water.usgs.gov/nwis). Comprehensive soils maps are available from the Natural Resources Conservation Service (NRCS), providing spatial data on important engineering properties such as infiltration rate and soil moisture storage.
The collection of water use data, however, has been given short shrift nationally with respect to funding and infrastructure support. Without consistent, comprehensive, and reliable water use data, appropriate decisions on water use management cannot be made. Well-structured water use data must be a part of the national water spatial data infrastructure if we hope to make sound future decisions regarding regional water allocation. (Further discussion of sources for such data is found in the section of this chapter titled “National Water Use Data: Federal Site-Specific Databases,” and in Chapter 7.) The products of a national water use program will ultimately be multifaceted, helping to address how to maintain sustainable water in aquifers, sustainable water for industrial, agricultural and urban development, and sustainable baseflow in streams.
CATEGORIES OF WATER USE AND WITHDRAWALS
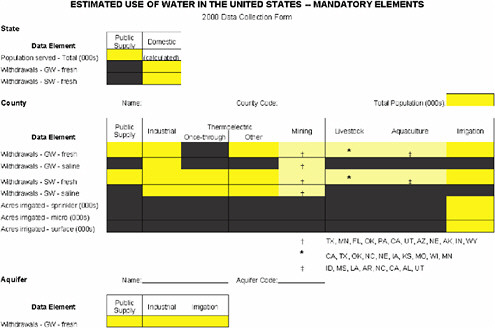
For its 2000 water use summary, the USGS has lumped water withdrawals into broad categories (Figure 3.2): public supply, domestic, industrial, thermoelectric, and irrigation. There is no longer an effort to track consumptive use, as was done for the 1995 water use summary. Also, there are no detailed breakdowns within specific categories, and return flows and instream water will not be documented as mandatory elements.
The rationale behind the lumping is based on the recognition that water use data effectively are collected by the USGS district program in an “ad hoc” man-
|
BOX 3.1 Combining low annual precipitation with extremely high evapotranspiration, the deserts of central and southern Arizona have always inspired a human concern for water. Although originally founded on the Santa Cruz River, the southern Arizona city of Tucson reduced that stream to ephemeral flood runoff because of groundwater pumpage in the 1940s. The solution to such overdraft had, since Arizona statehood, been envisioned as the long-distance transfer of Colorado River water. However, it was California that first achieved that dream, following dam construction in the 1930s. Arizona so resented California’s access to the Colorado that it refused to join the six other Colorado Basin states in dividing up the river water through the 1922 Colorado River Compact. After a futile attempt by its National Guard to prevent California’s extraction of Colorado River water, Arizona eventually joined the compact in 1944 and initiated a unified political effort to achieve its own engineered water-transfer system. The U.S. Congress approved the Central Arizona Project in 1968, and in 1973, construction began on the 336-mile-long series of aqueducts, canals, pumping stations, and siphons. When federal funding to the project was threatened by the Carter Administration’s criticism of the state’s water conservation practices, the Arizona Legislature reluctantly passed the then innovative Groundwater Management Act of 1980. A state agency, the Arizona Department of Water Resources, was thereby created to manage and allocate both surface water and groundwater. Although the need for Colorado River water had been originally justified to supply agriculture and mines, the economy of the state changed radically over the decades. By the early 1990s, the project was ready to deliver surface water to Tucson, one of the largest U.S. cities solely dependent upon groundwater for its supply, but few farms or mines signed contracts for access. Central Arizona Project water arrived in Tucson just in time to resolve a problem not envisioned at the time of project justification. Since World War II, the urban population had grown from less than 100,000 to over 800,000. The groundwater withdrawals were threatening future development by violating the conservation provisions enacted in 1980. By replacing groundwater with Colorado River water for municipal use, continued growth would be assured. Delivery of surface water began in November 1992. It was later recognized that a combination of old galvanized steel or iron water mains plus a different water chemistry from the original groundwater resulted in numerous cases of damage to water-using home appliances and also resulted in stained water and skin rashes. Public complaints about the water were poorly handled by the water delivery agency, and a political initiative eventually resulted in a November 1995 act that outlawed direct delivery of Central Arizona Project water to Tucson unless the water was treated to the quality of the original groundwater. The irony of Arizona’s long political struggle to bring Colorado River water to the desert, only to have it rejected by democratic vote, raises interesting questions about long-term planning, public understanding, and social factors in water supply. After a lengthy campaign of education, political advertising, and public relations, provisions of the 1995 act were revised in 1999 to allow the progressive municipal use by Tucson of water delivered by the Central Arizona Project. However, few expect this to be the final chapter in the continuing story of bringing water to the Arizona desert. |
|
BOX 3.2 Kansas and Colorado have fought over water for more than 100 years. In 1985, Kansas again sued Colorado, alleging that Colorado and its water users had depleted the usable and available flows of the Arkansas River (Figure 3.1) as measured at the Colorado-Kansas state line, in violation of the 1948 Arkansas River Compact. Among other claims, Kansas argued that flows had been depleted by about 1,500 post-Compact large-capacity wells drilled in Colorado, which pump groundwater in hydraulic connection with the Arkansas River. Consideration of this case by the “Special Master,” including consideration of the remedy and damage issues, involved the determination of Colorado’s depletion to usable stateline flow for various time periods. Data for the Hydrologic Institutional Model used to simulate river flow included inputs to the Arkansas River from the western slope and all subsequent withdrawals and returns along the river to the state line. As part of the model, data were amassed on precipitation, on withdrawals for irrigation and other uses, on phreatophytic water use, on streamflows, and on return flows. Streamflow information was obtained at USGS stream gaging stations, and information on metered surface water withdrawals for irrigation was available from irrigation ditch companies. However, irrigation well pumpage was more difficult to determine because few Colorado wells are metered. Information on crop acreage, crop water needs, and climatic factors was used to estimate irrigation groundwater use in Colorado. Electric power utility records were used to identify wells in use  FIGURE 3.1 The lower Arkansas River in Colorado. Source: Dash et al. (1999). |
|
and duration of their use, and coefficients were developed relating power consumption to amount of water pumped at metered wells. In the end, the Special Master and, later, the U.S. Supreme Court concluded that post-Compact well pumping in Colorado had violated the Compact. Kansas will receive monetary damages for four costs: (1) additional pumping costs to replace water Colorado did not deliver, (2) additional regional pumping costs associated with groundwater declines caused by this shortfall, (3) crop losses, and (4) secondary economic effects. Data on water use and water levels in Kansas have been used in conjunction with determinations of increased pumping costs to Kansas farmers. In summary, water use data, along with hydrologic, hydrogeologic, meteorological, economic, and power utility data, helped form the basis for a comprehensive picture of the basin’s water budget and for the resolution of a major interstate civil lawsuit. SOURCE: Joan Kenny, USGS, and Leland Rolff, Kansas Department of Agriculture. |
ner and also on the recognition that the USGS necessarily has to rely largely on water use data provided to it by state agencies and other parties. There is only a limited national-level quality assurance/quality control program for most of the received data. This makes it difficult to ascribe confidence intervals to the data, although regional water-quality specialists in their reports have made some independent estimates of error in the various categories used in the past (Snavely, 1986). Fundamentally, water use must be treated with the same scientific rigor used to quantify other aspects of the water budget, even if water use data inherently have much greater uncertainty. Because there now is large uncertainty in many estimates of water use, it becomes even more important to develop the scientific tools to address and minimize the uncertainty as much as possible.
As now designated, public water is water withdrawn by public water suppliers and delivered to users (USGS, 2000). These water suppliers (e.g., city well fields) provide water mostly to domestic and commercial clients but also can provide water to irrigation and to some industrial uses, including mining and thermoelectric power generators. Public water supply data are commonly obtained from providers. Domestic water is water used for drinking and household purposes. Usually, domestic water refers to water obtained from individual home wells or surface water supply. However, because domestic water can also be provided by public water supplies, it is distinguished from public sources in the statewide tabulation. Domestic water supply is usually determined by applying
estimation methods, such as coefficients for individual water use, rather than by tabulating measured values (USGS, 2000).
Industrial water is water used to manufacture products such as steel, chemicals, and paper and water used in petroleum and metals refining. Industrial water use often is locally dominated by only a few large industries. Data on industrial water use often are gathered from permitting information and customer records (USGS, 2000). Thermoelectric water is water used in the generation of electric power in fossil, nuclear, biomass, solid waste, and geothermal plants. The major sources of water use data for power plants are the plants themselves and allocation data from regulatory agencies. Irrigation water is water used to cultivate crop plants; it is by far the largest water use in the western United States. Data on irrigation water use come from many sources, including direct measurement and regulatory allocated amounts. Aquacultural water is water used to commercially farm fish and shellfish; the major sources of data are the same as those for irrigation. Mining water is water used during the extraction and processing of minerals and hydrocarbons. Water use data for mining often are obtained from agencies that regulate the mining industry. Finally, livestock water is water used for farm animals. Water use in this category often is determined by census and empirical coefficients for per capita animal use per unit time (USGS, 2000).
METADATA AND UNCERTAINTY
In an ideal world, all water use data would be obtained by direct measurements. Irrigation water and industrial water could be monitored by gages and other instruments, much as many public water supplies measure the volumes of water they extract from streams and wells. This kind of monitoring, even if legally mandated by local and state governments, would be very costly. In arid regions of the nation, water is a critical material commodity, and ignorance of real water use sometimes becomes politically expedient with respect to permitted or negotiated water allocations. In contrast, there can be little political incentive to monitor and regulate water use in water “rich” states such as those of the Northeast, given the perception of an almost unlimited supply in such states.
There has been little scientific evaluation of the quality of tabulated water use data provided to the USGS by state and other agencies for the national water use report that have been published every five years by the USGS. Qualitatively, water use data for public water supply and in-stream water (thermoelectric) use are probably fairly accurate where water withdrawals are directly measured at the pump or are estimated by power usage. Domestic and agricultural water use data, in comparison, are generally poorer in quality because they are often estimated by coefficients or maximum permitted amounts of water, rather than by direct measurement. (An exception is some major western irrigation projects, where diversions, surface water deliveries, and/or groundwater pumped may be measured or closely estimated to satisfy legal requirements.) Industrial water use is probably
least certain because of the large variability of water use in industrial applications, even with a single industrial class. That water use data throughout the country are substantially different regionally and locally adds to the general uncertainty, compounded by nonreporting of metadata (i.e., data and information about data quality) on the reliability of methods used to estimate water use. An introduction to metadata is given in Box 3.3.
Water use data, in contrast to many other kinds of data, are usually presented in tabular or statistical form, sometimes aggregated by watersheds or politically defined units such as county, state, and nation. Although it is understood that many water use data are obtained by extrapolation or inference (e.g., using various water use coefficients), there have been few studies that directly determine how much error is embedded in published water use maps and aggregated estimates. Without such error analysis, valid interpretation of the water use data can be seriously compromised. For example, has the amount of water used annually
|
BOX 3.3 Simply defined, “metadata” means “data about data.” Metadata document how data are obtained and their accuracy. Metadata enhance the usefulness of data by assigning statistical or qualitative accuracy and precision to data. Geographic information system approaches have formalized how metadata are prepared for many geographic datasets. Some metadata standards (e.g., the Federal Geographic Data Committee (FGDC) standard) have hundreds of different elements describing data. Metadata are the background information that describes the content, quality, condition, and other appropriate characteristics of geospatial data. Metadata have been used for many years when special information is presented. For example, the legends of paper maps contain metadata. As legends, metadata are clear and easily understood by map users. When map data are digital, metadata are equally important, but developing, using, and maintaining such metadata require more attention by data producers and map users who may need to modify data to suit their particular needs. Metadata are explicitly used in extensive geographic information systems. Metadata also are used, but less formally, in all scientific studies. For example, the “methods” sections in scientific papers on water resources almost always contain estimates or calculations of errors in sampling, chemical, hydrologic, and other basic data. Confidence intervals reflecting uncertainty (such as the standard deviation about a statistical mean) are sometimes shown on graphs with the data points. Sometimes, ranges of values instead of discrete contour lines are used to indicate data uncertainty in two-dimensional representations of continuous data distributions, such as chemical concentrations. Describing the uncertainty of scientific measurements or estimates is an explicit part of the scientific method, regardless of whether such description is formally called “metadata” or not. |
in the United States really remained about the same during the past decade, despite increasing population? Could this widely reported conclusion actually be caused by errors in regional water use estimates that, when combined with shifting regional populations, result in an apparent national stagnation in water use rather than in increasing use?
Water use experts have had to resort to estimation methods for many of the water withdrawal classes because of the legal, financial, and political constraints that limit getting hard data. For example, domestic water withdrawals and livestock water use are commonly estimated by multiplying population figures by coefficients. Irrigation water withdrawal is often estimated by multiplying acreage by assumed water needs of the crop rather than by measuring actual water pumped and applied. One of the best descriptions of how such estimates are made is found in Snavely (1986), which details the water use data collection programs and regional database of the Great Lakes-St. Lawrence River basin states. This report is enlightening because it shows how broad the range of estimation coefficients for water use can be within a geographic area with similar water availability. Often, the coefficients used for agricultural and domestic use vary by a factor of 10. Different states in the basin use very different protocols to determine how and when to tabulate water use. The result is a patchwork of disparate databases that the USGS must attempt to synthesize into a meaningful whole. Compiling such a patchwork into a meaningful and scientifically defendable whole is probably not possible, given the apparent large variability in both estimation and tabulation methods even within a similar climatic region.
The USGS needs to evaluate the scientific merits behind the coefficients and the estimation methods used to aggregate water use in the nation from first principles and primary literature and tie variations of the coefficients to climatic or other factors that can be deterministically related to water use intensity. Where coefficient data are not scientifically robust, the USGS should invest in studies that statistically sample and determine how water is used in order to develop its own coefficients that can be used to determine water use at the national scale, leaving local water use determinations to local governmental units. This does not mean that the committee does not support the collection of high-quality water use data. Rather, it acknowledges the reality that the states place varying degrees of emphasis on water use data collection and that the USGS has limited influence on state law and policy.
Thus, the USGS should not view water use compilation as a “census” of additive parts as it has done in the past, but rather, it should look at water use as a science and investigate it using appropriate scientific approaches. The USGS in its National Water Quality Assessment Program selected a set of discrete sampling regions in representative river systems to derive the status of the nation’s surface and groundwater quality. It did not try to sample all rivers and waters in the nation. Rather, it is developing scientific methods to apply what is learned from well-studied regions to areas with less available data. Likewise, the stream
gaging program researches methods to estimate flows in ungaged streams. The USGS should in similar fashion find ways to use information gained from the excellent water use datasets that exist, or can be easily created, to make estimates in data-poor areas.
VALUE OF DATA AT VARIOUS SCALES OF SPACE AND TIME
The USGS aggregates water use data into a smaller number of categories from state and smaller political units (e.g., county) to produce statewide and national-level compilations. As appropriate to such a compilation, these data are most useful for characterizing regional water use trends and national changes in water use. However, without systematic scientific studies testing the reliability of the compiled data, the usefulness of the compilations is questionable.
The data richness at more detailed scales not reported in the national synthesis, however, should not be underestimated. For example, data on the increase in agricultural acreage from 1992 to 1997 (Figure 3.3) provide a national snapshot of potential changing water use that is not—but arguably should be—captured in the USGS water use reports.
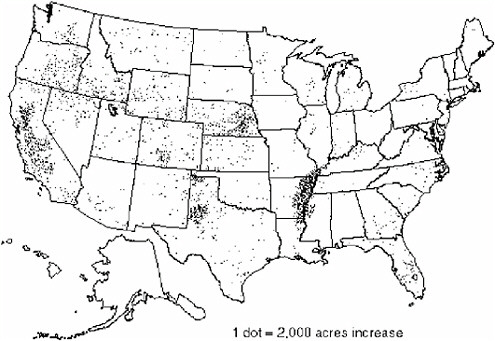
FIGURE 3.3 Areas of increase in irrigated acreage in the United States, 1992-1997.
SOURCE: Modified from USDA (1999a).
Water use trends and use patterns can be evaluated when excellent site-specific water use data are available—particularly physical measurements of water use at major point sources. The cast study in the next section shows how excellent water use data in Arkansas enabled the committee to explore major water use issues. It demonstrates that meaningful and accurate water use databases have the same intrinsic value as spatial datasets commonly collected as part of national resource evaluation and initiatives (e.g., streamflow, meteorological data, soils characterization, etc.).
STATE-LEVEL WATER USE DATA: THE ARKANSAS CASE STUDY
One of the most impressive state water use programs reviewed by the committee is that carried out in Arkansas by the USGS in collaboration with the Arkansas Soil and Water Conservation Commission. Initiated some 20 years ago, the program today has matured into a comprehensive inventory of monthly data from more than 40,000 surface and groundwater withdrawal points. The program also plays a vital role in the state’s effort to manage water resources in heavily pumped regions, especially the Mississippi Alluvium aquifer in eastern Arkansas. The summary of water use in Arkansas presented here is developed from data provided courtesy of the USGS Arkansas District Office.
Water Use Data in Arkansas
Water use data for both surface and groundwater are collected to meet the requirements of state law in Arkansas (Act 81 of 1957 as amended and Act 1051 of 1985). Users who withdraw at least 50,000 gallons per day (groundwater) or 1 acre-foot per year (surface water) must report their monthly withdrawals each year to the Arkansas Soil and Water Conservation Commission (ASWCC). They are not required to report their consumptive use. During the early 1980s, the ASWCC received approximately 10,000 water use registrations annually and stored the data on the ASWCC computer. In 1983, the USGS entered into a cooperative agreement with the ASWCC to support this data collection program by providing a Site-Specific Water Use Data System (SWUDS) and by providing support and training to ASWCC personnel. In 1985, USGS personnel began entering water use data and providing quality assurance. The USGS also printed water use registration forms, reminder cards, and certificates for ASWCC.
During the 1990s, the program evolved with the development of customized reporting and software specifically configured for Arkansas. In 1993, the USGS produced 29 county and area reports of site-specific water use in Arkansas. In 1994, the USGS began installing custom water use software (WUDBS) in 30 County Conservation District offices in Arkansas (on NRCS computers) for remote entry of water use data. Since 1994, the USGS has trained and provided computer software support to Conservation District personnel in 30 of the 75
counties in Arkansas. The USGS currently enters water use data and prints forms, reminder cards, and certificates for all nonagricultural water use categories, and it conducts the water use survey for the other 45 counties in the state (approximately 10,000 measurement points).
In 2001, the USGS began the process of migrating the water use software and database to the Internet, enabling remote entry of data using a web browser (Figure 3.4). When complete, the web database and software will enable the USGS to maintain one centralized database rather than 31 separate databases. Also, the web interface provides the USGS and ASWCC with a quick, secure means of accessing the most current water use data in Arkansas.
Overview of Water Use in Arkansas
Arkansas, with a population of 2.6 million in 1999, uses water at a mean annual rate of 7,000 million gallons per day (MGD) (7.8 million acre-feet per
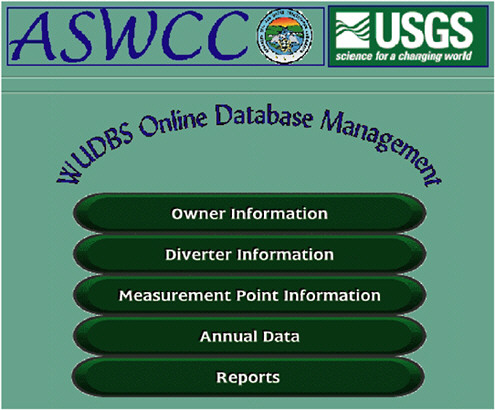
FIGURE 3.4 Web interface to Arkansas water use database system (secured site; login and password required). SOURCE: USGS Arkansas District Office.
year). The largest public water supply systems are associated with the principal cities: Little Rock, Jonesboro, Fayetteville, Fort Smith, and Pine Bluff (Figure 3.5). In most of the more rural counties, public water supply averages less than 5 MGD. However, total water use is dominated by withdrawals for irrigation, focused in the eastern counties of the state adjacent to the Mississippi River, where water use in some counties exceeds 500 MGD. Water use in Pope County is very high arising from the Arkansas Nuclear One power plant, located on the Arkansas River.
The trends in water use, shown in Figure 3.6, show the dominance of irrigation over public supply and also demonstrate that irrigation water withdrawals grew by approximately 50 percent from 1980 to 1995.
Water use in White County is about average for Arkansas counties, totaling approximately 114 MGD. As shown in Figure 3.7, this figure is dominated by irrigation, with much smaller amounts for public supply and other agricultural water use. Detailed information about crop and aquaculture water use for White County is shown in Table 3.1. The first two columns of the table show the number of reported applications of water and the number of acres to which the water was applied. The remaining columns show statistics of the water use per acre based on the data reported to the ASWCC. For example, for berries, 50 acres are irrigated with an average of 4 acre-feet per acre of water, so the total water use is 200 acre-feet.
The Arkansas water use database contains data for approximately 44,700 groundwater and surface water pumping withdrawal points. Of these, approximately 5,600 points are from surface water and 39,100 are from groundwater. Thus, one-eighth of the water withdrawal points are from surface water and seven-eighths from groundwater. As shown in Figure 3.8, both surface and groundwater withdrawals are concentrated in eastern Arkansas.
Spatial Patterns in Surface Water Use
When viewed at a distance, there is no particular spatial pattern in the surface water use points, but a closer view in Figure 3.9 reveals that the surface water use points are clustered along the principal river systems in eastern Arkansas. Indeed, a more detailed view would find that most of these points are located right on these river systems, and they can be locationally referenced with river addresses, as shown later in this chapter.
Spatial Patterns in Groundwater Use
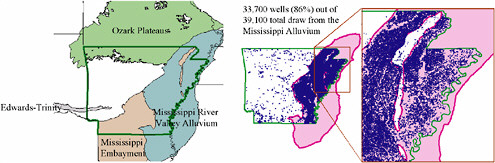
The principal aquifers underlying Arkansas are the Ozark Plateau in the north, the Mississippi River alluvium underlain by the Mississippi Embayment in the east, and a small portion of the Edwards-Trinity aquifer in the west. Of these,
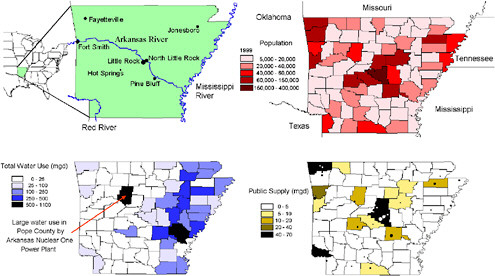
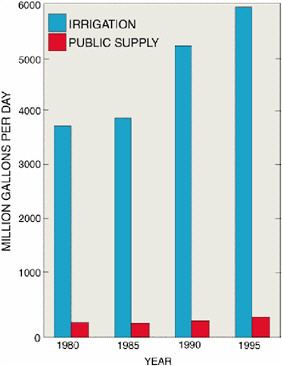
FIGURE 3.6 Trends in irrigation and public water supply for Arkansas from 1980 to 1995. Data source: USGS Arkansas District Office.
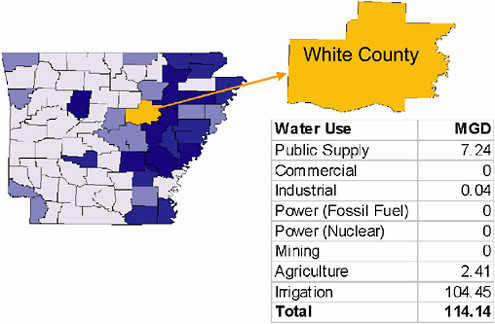
FIGURE 3.7 Water use in White County, Arkansas in 1997, expressed as million gallons per day. See Figure 3.5 for map legend. Data source: USGS Arkansas District Office.
TABLE 3.1 Agricultural Water Use in White County, Arkansas, 1995
|
Crop |
Number of reported applications |
Sum of acres |
Average |
Minimum |
25th percentile |
50th percentile |
75th percentile |
Maximum |
Variance |
Standard deviation |
Total applied (Acre-feet) |
|
IDLE |
406 |
0.00 |
0.00 |
0.00 |
0.00 |
0.00 |
0.00 |
0.00 |
0.00 |
0.00 |
0.00 |
|
RICE |
684 |
29827.81 |
2.99 |
2.50 |
3.00 |
3.00 |
3.00 |
5.00 |
0.02 |
0.13 |
89404.23 |
|
CORN |
4 |
399.00 |
0.62 |
0.50 |
0.50 |
0.50 |
0.75 |
1.00 |
0.06 |
0.25 |
231.50 |
|
SOYBEANS |
487 |
28350.30 |
0.52 |
0.32 |
0.50 |
0.50 |
0.50 |
1.00 |
0.01 |
0.10 |
14739.80 |
|
MILO |
24 |
2506.00 |
0.52 |
0.50 |
0.50 |
0.50 |
0.50 |
1.00 |
0.01 |
0.10 |
1301.00 |
|
HAY |
4 |
195.00 |
1.06 |
0.50 |
0.75 |
1.00 |
1.38 |
1.75 |
0.27 |
0.52 |
222.50 |
|
VEGETABLES |
2 |
35.00 |
0.43 |
0.43 |
*** |
0.43 |
*** |
0.43 |
0.00 |
0.00 |
15.00 |
|
BERRIES |
1 |
50.00 |
4.00 |
4.00 |
*** |
*** |
*** |
4.00 |
*** |
*** |
200.00 |
|
GRAPES |
1 |
30.00 |
0.50 |
0.50 |
*** |
*** |
*** |
0.50 |
*** |
*** |
15.00 |
|
FRUIT TREES |
4 |
155.00 |
1.84 |
0.36 |
0.43 |
0.50 |
3.25 |
6.00 |
7.70 |
2.77 |
621.90 |
|
SOD |
11 |
1002.00 |
6.55 |
1.00 |
1.00 |
7.00 |
12.00 |
12.00 |
30.27 |
5.50 |
10854.00 |
|
BEEF CATTLE |
1 |
100.00 |
0.28 |
0.28 |
*** |
*** |
*** |
0.28 |
*** |
*** |
27.60 |
|
ANIMAL AQUACULTURE |
38 |
721.00 |
3.46 |
0.80 |
2.00 |
3.00 |
4.00 |
7.00 |
3.97 |
1.99 |
2679.50 |
|
MINNOWS |
1 |
7.00 |
1.25 |
1.25 |
*** |
*** |
*** |
1.25 |
*** |
*** |
8.75 |
|
DUCKS |
2 |
300.00 |
1.00 |
1.00 |
*** |
1.00 |
*** |
1.00 |
0.00 |
0.00 |
300.00 |
|
Sports & recreation cl |
2 |
96.00 |
1.00 |
1.00 |
*** |
1.00 |
*** |
1.00 |
0.00 |
0.00 |
300.00 |
|
Amusement & Recreation |
1 |
210.00 |
0.50 |
0.50 |
*** |
*** |
*** |
0.50 |
*** |
*** |
105.00 |
|
Totals |
0 |
0.00 |
*** |
*** |
*** |
*** |
*** |
*** |
*** |
*** |
0.00 |
|
SOURCE: USGS Arkansas District Office. 1,120 acre-feet/year = 1 MGD |
|||||||||||
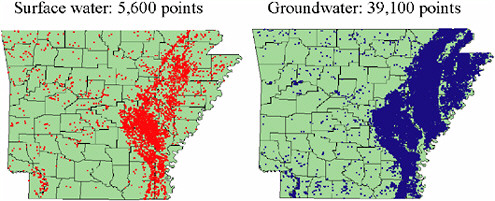
FIGURE 3.8 Surface and groundwater withdrawal points in Arkansas (1997). Data
source: USGS Arkansas District Office.

FIGURE 3.9 Spatial patterns of surface water use along rivers in Arkansas. Data source: USGS Arkansas District Office.
by far the most important water supply is provided by the Mississippi Alluvium, which supports 33,700 groundwater wells or 86 percent of all the wells in the state. The spatial patterns of groundwater withdrawal points evident in Figure 3.8 are shown in Figure 3.10 to be closely associated with the boundaries of the Mississippi Alluvium.
Temporal Patterns of Water Use
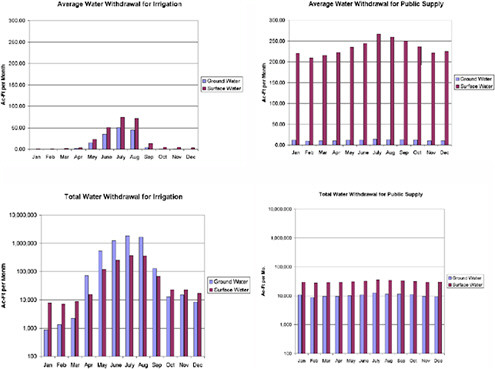
As part of the USGS Cooperative Water (Coop) Program, each year, personnel in the county offices of the Arkansas Soil and Water Conservation Commission collect monthly water use estimates for each water withdrawal point. The USGS archives and organizes this information into a statewide database. Table 3.2 summarizes statistics of irrigation and public supply water use, while Figure 3.11 illustrates the time patterns of these uses.
As shown in Table 3.2, there are about seven times as many water withdrawal points from groundwater as compared to surface water, for both irrigation and public supply. The average amount of water withdrawn from an individual groundwater well is about 12 ac-ft/mo. for both irrigation and public supply, while for surface water, the average amount withdrawn at a single withdrawal point is larger, about 21 ac-ft/mo. for irrigation and 234 ac-ft/mo. for public supply. The net result is that irrigation supply is principally drawn from groundwater and public supply from surface water, with the irrigation supply being spatially dispersed over tens of thousands of wells, while the public supply is more concentrated at hundreds of withdrawal points.
As shown in Figure 3.11, there is a seasonal pattern to both irrigation and public supply. Rates of withdrawal for the irrigation and public supply are highest in the summer months and lower in the winter, a tendency that is much more pronounced in the case of irrigation. These data demonstrate that the practice used by the USGS of sampling and tabulating groundwater and surface water use separately for each usage category is justified. If the source of water supply is not considered, important information is lost even though the total water use in any category lumps together the use from surface and groundwater sources.
Water Use Intensity
A general indicator of the stress that water use is placing on the existing natural water systems is the water use intensity, expressed here as the amount of water use per unit area for a county, an aquifer, or a watershed. Because water
TABLE 3.2 Numbers of Users and Average Withdrawals Per User for Irrigation and Public Supply, Arkansas
|
|
Irrigation |
Public Supply |
||
|
Water Source |
No. of Users |
Avg. Withdrawal Per User (ac-ft/mo.) |
No. of Users |
Avg. Withdrawal Per User (ac-ft/mo.) |
|
Groundwater |
36,053 |
12.7 |
894 |
11.6 |
|
Surface Water |
5,049 |
21.1 |
132 |
234 |
use is expressed in dimensional units of [L3/T] (where L is length and T is time) and area in units of [L2], it follows that the water use intensity is expressed in units of [L3/T] / [L2] = [L/T]. It can thus be calculated in inches per month or inches per year and compared to precipitation or runoff expressed in comparable units.
Figure 3.12 shows the resulting spatial patterns of water use intensity for surface water, groundwater, and total water use in Arkansas. In the calculation of the surface water use intensity, water use for power production was excluded because it occurs in only a relatively few locations and because it is of such a large magnitude at those locations that it dominates by far all other categories of water use. Total water use intensity averages 2.9 inches per year over all counties and has a maximum value of 17.3 inches per year in Arkansas County. Surface water use intensity averages 0.8 inches per year over all counties and has a maximum value of 8.2 inches per year in Arkansas County. Groundwater use intensity averages 2.1 inches per year over all counties and has a maximum value
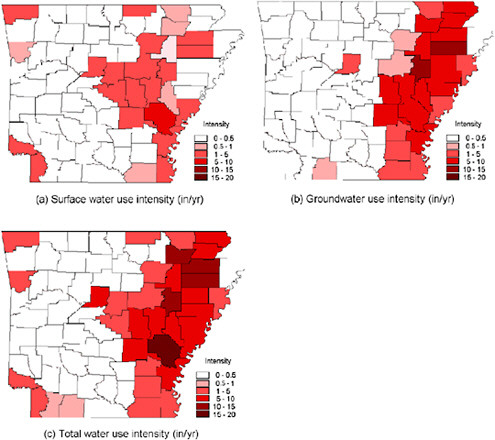
FIGURE 3.12 Water use intensity in inches per year for (a) surface water, (b) groundwater, and (c) total water use (surface plus groundwater). Data source: USGS Arkansas District Office.
of 12.3 inches per year in Woodruff County. Thus, excluding water use for power production, about 70 percent of the total water use per unit of land area in Arkansas is supported by groundwater and about 30 percent by surface water.
Water Stress
The magnitude of the water use intensity in inches per year can be compared with the water fluxes through the components of the hydrologic cycle, also measured in inches per year. A convenient benchmark for this comparison is the spatial distribution of annual precipitation. A water stress index can be defined as the ratio of the water use intensity to the precipitation rate. As shown in Figure 3.13, the precipitation in Arkansas ranges between 44 and 56 inches per year,
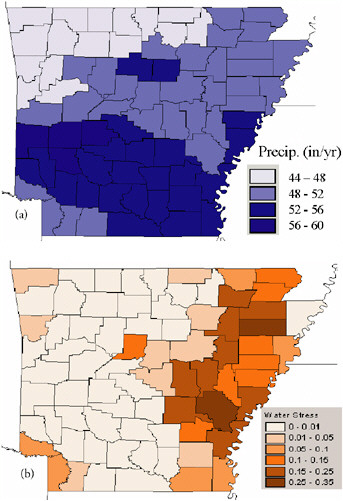
FIGURE 3.13 (a) Average annual precipitation, 1961-1990 and (b) water stress index (ratio of total water use intensity to annual precipitation). Precipitation data source: USDA Climate Maps and Digital Data (http://www.ftw.nrcs.usda.gov/prism/prism.html). Water use data source: USGS Arkansas District Office.
with less precipitation in the north than the south and with the highest precipitation in the hills of southwestern Arkansas. The water stress index map, shown in Figure 3.13, has an average value of 0.06 over the state and a maximum value of 0.32 in Arkansas County. Thus, approximately 6 percent of annual precipitation is withdrawn from surface and groundwater resources on average over Arkansas, and 32 percent or nearly a third of the annual precipitation is pumped out in Arkansas County. As before, these figures do not include water use for power production. Although these kinds of calculations may be misleading at a local level because of additional sources of water (e.g., Mississippi River via recharge through the alluvium), they are likely to have considerable application at a regional or national scale.
If only consumptive water use rather than total water use were used, these water use intensities and stresses would be somewhat lower. Consumptive use for irrigation (the most important water use category) in Arkansas in 1995 was estimated by Holland (1995) to be 4,393 MGD of the 5,936 MGD withdrawn, or 74 percent. The remainder, approximately 26 percent, of the water withdrawn was returned to either groundwater or surface water and was available for reuse if it was of acceptable quality.
Linear Referencing of Water Use Points to River Locations
The USGS has been a leader in displaying water data on the Internet for map information on both water features and water measurements. The main surface water features useful for map description are watersheds and river reaches. If desired, water use points can be located on river reaches within watersheds using a river addressing system.
Hydrologic Cataloging Units
The surface drainage system of the United States has been divided into a hierarchical system of hydrologic cataloging units. At the top of the hierarchy are two-digit water resource regions, of which there are 18 covering the continental United States. Region 11 describes the Arkansas and Red River basins, and Region 8 the Lower Mississippi basin. The regions are further subdivided into four-, six- and eight-digit cataloging units as shown in Figure 3.14 for Regions 8 and 11.
The eight-digit cataloging units are the most widely used drainage areas for cataloging hydrologic data in the United States. There are 2,156 such units in the continental United States, of a size roughly equivalent to counties. Each eight-digit unit has a hydrologic unit code. For example, cataloging unit 08020402 is the Bayou Meto unit in northeastern Arkansas. It is subbasin 2 of Basin 4 within Subregion into 2 of Region 8 in the cataloging unit hierarchy.
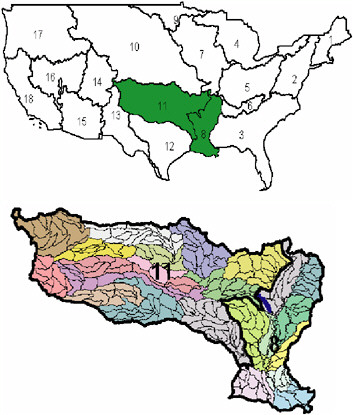
FIGURE 3.14 Hydrologic cataloging units of the United States. The smallest units shown in the figure are eight-digit cataloging units. SOURCE: USGS (http://water.usgs.gov/GIS/huc.html for description of HUCs and http://water.usgs.gov/GIS/huc.html for data retrieval).
RIVER REACHES
The USGS and the U.S. Environmental Protection Agency (EPA) have together developed the National Hydrography Dataset (http://nhd.usgs.gov), a digital description of the rivers, streams, and waterbodies of the United States (see Figure 3.15). Developed nationally at a scale of 1:100,000, the National Hydrography Dataset is progressively being improved by adding high-resolution 1:24,000-scale hydrography data in some states. The river and stream network of this dataset has been separated into reaches and labeled using a Reach Code, which is a 14-digit identifier, unique throughout the United States. For example, Reach 08020402000077 is river segment 77 within cataloging unit 08020402.
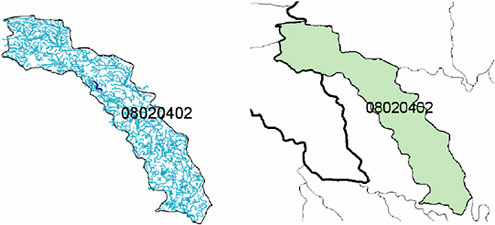
FIGURE 3.15 The National Hydrography Dataset river and stream network for eight-digit hydrologic cataloging unit 08020402, named Bayou Meto. SOURCE: USGS National Hydrography Dataset (http://nhd.usgs.gov).
River Addressing
Because each river reach is a uniquely labeled line, an “address” location can be defined at any point on that line as the measure, or percent distance from the downstream end of the line. For example, location A, in Figure 3.16 can be specified as having an address of 0.38 (i.e., 38%) on river segment 77 in cataloging unit 08020402. This river addressing system is similar to that normally used for street addressing. For example, 384 Vine Street, Austin, Texas 78712, indicates a unique address number (384) on a line (Vine Street), within an area (zip code 78712). Similarly, point A is at number 0.38 on a river reach line within a cataloging unit drainage area. The use of percent distance in the National Hydrography Dataset as the measure location is replaced in other river addressing systems by linear measures such as river miles or kilometers from the river mouth.
Linear Referencing of Water Use Points
Linear referencing is a process of locating information by addresses on lines. This concept, most commonly used for mail addressing, is being used to take point data whose latitude and longitude are known and locate those points on river systems. Figure 3.17 shows four surface water use points on the Bayou Meto. Each water use point has an identifying number, a use type (IR is for irrigation, AG is for general agriculture), a source (SW = surface water), an
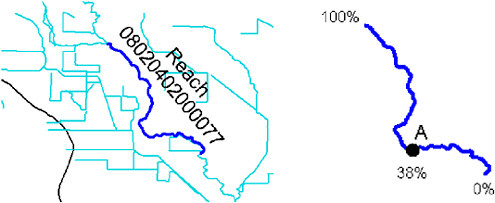
FIGURE 3.16 Location on a river reach, given by percent distance from the downstream end of the line.
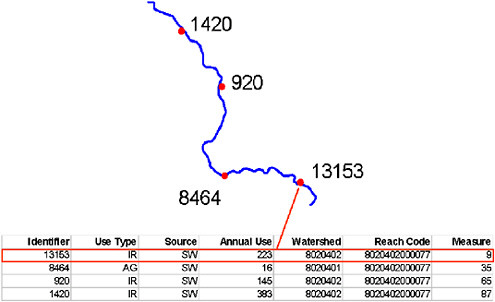
FIGURE 3.17 Example of linear referencing of surface water use points using an event table. Note the one-to-one correlation of lines in the table and water use points on the map.
annual water use, a watershed number, a reach code, and a measure value. Each row in the table shown is a linear point event, which means that its location is known not by its latitude and longitude but rather by its location on the river reach line.
Once all of the surface water use points are similarly located, questions such as the following can be asked: What is the water use upstream or downstream of this location? How does this compare with existing flows in this river? If wastewater discharge points are similarly located, other questions can be asked: What is the flow distance between this water use point and the nearest upstream wastewater discharge? If a spill occurs upstream, which downstream water users will be affected?
The association of water use sites and the National Hydrography Dataset creates a powerful combination of information capable of answering water management questions that cannot otherwise be posed. And the key question in this association is not so much how much water is used, but where it is withdrawn from surface water sources. This location information is something that can be accurately measured and the quality controlled using global positioning systems. Indeed, the USGS in Arkansas has undertaken an extensive survey to perform quality control on the location data for the water use data points in its database.
When all of the surface water use points in the Arkansas database are displayed over the National Hydrography Dataset river reaches, as shown conceptually in Figure 3.18, most of the points fall on the mapped reaches, but there are some points that do not. These are points where water is being diverted from smaller rivers and streams than are depicted on 1:100,000-scale maps. If these 1:100,000-scale data were replaced by more detailed 1:24,000-scale data, most of the remaining points would be located on a mapped river reach.
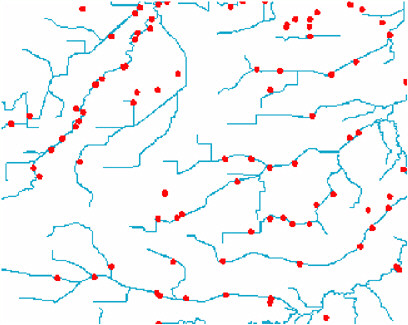
FIGURE 3.18 Water use points and National Hydrography Dataset river reaches in a hypothetical Arkansas basin.
NATIONAL WATER USE DATA: FEDERAL SITE-SPECIFIC DATABASES
The Arkansas case study illustrates the richness of the information contained in a comprehensive, statewide, site-specific database and some of the many ways in which this information can be applied. However, the survey of state water use data collection programs presented in Chapter 2 and Appendix A shows that such databases exist in only about 20 states. Fortunately, many classes of water use facilities are federally regulated, so information bases exist at the national level as well. Although these datasets are not all equal in quality, they share the critical element of providing consistent baseline information from state to state. The potential importance of these databases becomes especially clear in Chapter 7, where we discuss the development of a national dataset of water use information.
In the following sections, four federal datasets are profiled, three of which are site-specific. These datasets are relevant to the estimation of water use in the areas of public water supply, power plants, wastewater, and agriculture.
Public Water Supply Database: Safe Drinking Water Information System (SDWIS)
The EPA has compiled a Safe Drinking Water Information System (SDWIS) (HtmlResAnchor http://www.epa.gov/safewater/sdwisfed/sdwis.htm) to support the Safe Drinking Water Act. This database covers all public water supply systems in the United States serving at least 25 people or 15 connections on a year-round basis. The USGS supports the EPA by providing quality control information on the latitude-longitude coordinates of the approximately 6,600 surface water intake locations and 104,000 groundwater withdrawal locations documented in the SDWIS database.
Energy Generation Facilities Databases: Energy Information Administration
The Energy Information Administration (EIA) (http://www.eia.doe.gov/) has extensive databases on locations and characteristics of energy generation facilities in the United States. This information includes monthly time series on electricity production at power plants. These consistent national data enhance and complement the information currently used to estimate water use for power generation by nuclear and fossil fuel thermoelectric power plants.
Wastewater Discharge Database: EPA Permit Compliance System
The EPA maintains a Permit Compliance System to document information on facilities that have permits to discharge wastewater into rivers. This system
contains information on the life of the permit, the permitted discharge, and discharge monitoring data (http://www.epa.gov/enviro/). Figure 3.19 shows the locations of wastewater-discharge site locations stored in the Permit Compliance System. Wastewater discharge data may also be useful in estimating water use when they are combined with an understanding of the active industrial processes. One source of such information is a series of so-called Industry Sector Notebooks, published by the EPA Office of Compliance. The sector notebooks, published for over 30 major industrial sectors, offer a holistic “whole-facility” approach to industry-specific manufacturing processes and to pollution issues for specific industrial sectors. The Permit Compliance System together with the sector notebooks can be used to estimate industrial water use may be estimated from the national database of permitted wastewater dischargers.
This methodology would have limitations. These sector notebooks are incomplete, fail to account for recycled water, and do not account for water embodied in different types of processes. Further, the databases themselves are incomplete for industries located where permits are not granted.
Agricultural Databases: Census of Agriculture and National Resource Inventory
The only large category of water withdrawal that is not federally regulated at each individual water use site is irrigated agriculture. Several large national databases help to partially address this issue. Every five years, the U.S. Department of Agriculture (USDA) compiles a comprehensive survey of national agricultural activities called the Census of Agriculture (http://www.nass.usda.gov/census/). As part of the Census, irrigated acreage is estimated for every county in the United States, as suggested in Figure 3.20. The Farm and Ranch Irrigation Survey (FRIS) (http://www.nass.usda.gov/census/census97/fris/fris.htm), conducted the year following the Census of Agriculture, provides supplemental data on irrigation water use by source (groundwater, on-farm surface water, and off-farm), farm water applications (not withdrawals or consumptive use), and irrigation practices. The stratified random sample design of the FRIS provides rigorous confidence limits on all estimated quantities. Another USDA survey is the National Resource Inventory, which is a statistically based sample of land use and natural resource conditions and trends on U.S. nonfederal lands (http://www.nhq.nrcs.usda.gov/NRI/1997/). A major limitation is that neither of these programs reports site-specific data because of confidentiality requirements. Despite this, agricultural water use represents a natural area for increased cooperation between the USGS and USDA. Even aggregated data may serve as a check for a site-specific survey, which the USGS may choose to carry out. Fertile areas for this interagency collaboration include estimating agricultural water use and determining the effect of this use on the quantity, quality, and ecology of the nation’s water resources. The Survey’s expertise and interest in linking water use
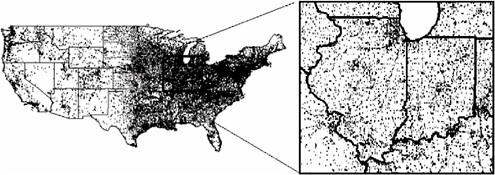
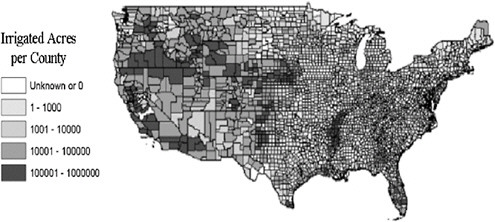
FIGURE 3.20 Acres of irrigated land in the United States by county in 1997.
SOURCE: 1997 Census of Agriculture, as reported in National Atlas of the United States (http://www.nationalatlas.gov/agcensusm.html).
to the source stream or aquifer complements the USDA emphasis on economic inputs and characteristics of the nation’s agricultural production.
In chapters 4–6 the report moves beyond water use data to water use estimation. Chapter 4 begins with a summary of the many different estimation techniques that may be used in the field of water use. Two techniques are then investigated in greater detail: direct estimation through stratified (and unstratified) random sampling (Chapter 5) and indirect estimation using linear regression models that explain water use based on corresponding demographic, economic, and climatic data (Chapter 6).
CONCLUSIONS AND RECOMMENDATIONS
Good-quality water use data are critical for many purposes, including (1) ensuring adequate availability of water as future water demands fluctuate due to changes in climate, urban growth patterns, agricultural practices, and energy needs and (2) settling interstate and intrastate conflicts over water resources. Given the widespread economic and political implications of water use compilations, it is very important that water use data be compiled with metadata defining the uncertainty in the numbers. Metadata document how data are obtained and enhance the usefulness of data by assigning statistical or qualitative accuracy and precision to data. The USGS aggregates water use data to produce statewide and national-level compilations. Without systematic scientific studies testing the reliability of the compiled data, the usefulness of the compilations is questionable.
At present, because there is only a limited national-level quality assurance/ quality control program for most of the received data, it is difficult to ascribe confidence intervals to the data. Fundamentally, water use needs to be treated with the same scientific rigor used to quantify other aspects of the water budget, even if water use data inherently have much greater uncertainty.
Because there now is great uncertainty in many estimates of water use, it is important to develop the scientific tools to address and minimize the uncertainty to the extent possible.
Finally, high-quality, site-specific datasets open up many ways of visualizing water use. The Arkansas case study developed in this chapter demonstrates how these data can be used to show spatial and temporal patterns in groundwater and surface water use, water use intensity, and water stress. The USGS should encourage the development of site-specific databases where none exist and should work with cooperators to fully exploit the power of these databases.


