
4
Exposure and Response
This chapter discusses three key components of benefits analyses: exposure assessment, health outcomes, and concentration-response functions. The exposure assessment section begins with an overview of exposure assessment considerations, including issues related to exposure assessments in the epidemiological studies that are frequently used to estimate health benefits of air pollution reductions. A general overview of air-quality modeling and its role in benefits analysis follows. The selection and interpretation of health outcomes are then discussed. Finally, the concentration-response section explores the sources and selection of these functions and issues associated with the existence of thresholds, analysis of population subgroups, and assumptions regarding effects lags (the temporal relationship between changes in exposure and resulting changes in health outcomes).
EXPOSURE ASSESSMENT
Estimating changes in population exposures to air pollutants is an essential component of EPA’s benefits analyses, providing the link between anticipated emissions changes and resulting changes in health outcomes. Because it is not possible to observe population exposures to air pollution under different regulatory options, exposure assessment in benefits analysis uses models to simulate air pollution exposures that might occur as a result of
those options. Exposure modeling is a complex process that depends on many assumptions about the future, including pollution emissions reductions resulting from the proposed regulation; changes in emissions due to factors other than the proposed regulation; meteorological conditions; the physical and chemical processes in the atmosphere affecting pollution dispersion, transformations, and deposition; and the nature and degree of pollutant contact with future human populations. As in all other stages of the benefits analysis, the assumptions and methods used in the exposure assessment should be well-justified and clearly described, with careful attention paid to assessing and communicating key sources of uncertainty.
EPA’s exposure assessment methods have evolved considerably over time, as is evident in the health benefits analyses reviewed by the committee. This evolution is due to continued improvements in modeling capabilities and to a marked increase in available air-monitoring data for many pollutants. Because the most recent EPA analysis reviewed by the committee (the benefits analysis for the heavy-duty (HD) engine and diesel-fuel rule) uses current data and exposure assessment methods, it serves as an illustrative example throughout this exposure assessment discussion.
The committee considers that the exposure assessment methods used in the analysis for the HD engine and diesel-fuel rule represent an appropriate and reasonably thorough application of available data and models. Although limitations, as noted in following sections, exist, they are primarily due to limitations of available scientific knowledge and, ultimately, the limited time and staff resources available for analysis rather than flawed analytical methods.
Exposure to air pollution has been defined as the intersection in time and space of a concentration of pollution in the air and the presence of a human being (NRC 1991; Ott 1995). For benefits analyses, exposure is typically assessed at the population level by geographically linking estimates of outdoor pollution concentrations with projected population numbers; these together represent the necessary input to population concentration-response functions for calculating health impacts. The use of ambient air concentrations to represent population exposures is justifiable when the health findings underlying the benefits analysis are similarly based on ambient concentration data and when the outdoor concentrations are correlated with personal exposures, as is the case for particulate matter (PM).
Exposure Assessment in Epidemiological Studies
The health benefits analyses reviewed by the committee have depended heavily on the estimated mortality impacts of PM. To better understand the role of and uncertainties in exposure assessment for such benefits analyses, it is important to examine characteristics of the exposure assessments used in the epidemiological studies on which the PM mortality effects were based.
Two classes of study designs have been used to assess mortality effects: time-series and prospective cohort studies (Kinney 1999). The time-series studies examine day-to-day associations between citywide mean daily outdoor PM concentrations and citywide daily death counts. This approach addresses the relationship between acute exposure and health. For example, deaths on a given day are related to PM concentrations on the same day or on a few previous days. In contrast, the prospective cohort studies examine differences between cities in mortality among individuals followed over an extended period and the variations in annual (or longer) mean outdoor PM concentrations. These studies are believed to address the relationship between chronic exposure and mortality. (See the Concentration-Response Function section for a further discussion of time-series and cohort studies.)
Population exposures are assessed in both designs using outdoor citywide average PM concentrations derived from regulatory air-quality monitoring data collected from a small number of sites in each city. Uncertainties may arise in using a citywide average to represent exposures of persons at risk because of spatial variations in ambient concentrations across a city, differences in penetration of ambient air pollution indoors, and the wide range in activity patterns of persons at risk. However, in the single-city time-series studies, central-site fine-particle measurements have been shown to correlate well over time with average population personal exposures (Rojas-Bracho et al. 2000; Sarnat et al. 2000). These findings support the validity of daily ambient PM measurements in capturing variations over time in population exposures to fine particles and strengthen the reliability of benefits estimates of acute health effects that depend on ambient PM concentrations.
Less is known about the reliability of central-site, long-term average, ambient PM concentrations in characterizing variations between cities in
average population exposures. The relationship between population exposures to pollutants of outdoor origin and ambient concentrations measured at central sites may differ across cities because of differences in local sources, indoor penetration efficiency, activity patterns, housing characteristics, and other geographic factors. For example, recent exposure studies highlighted variations across cities in the penetration of ambient PM to indoor environments as a result of weather-related factors, such as the prevalence of air-conditioner use (Rojas-Bracho et al. 2000; Sarnat et al. 2000; Janssen et al. 2002). This result implies geographic differences in the ability of ambient air-monitoring data to characterize population exposures accurately. This uncertainty will affect analyses that estimate benefits in diverse locations and in future years when housing characteristics that affect air-exchange rates may change. As more data become available, EPA should examine how this uncertainty affects benefits estimates and attempt to incorporate this source of uncertainty in an overall uncertainty analysis.
Another important characteristic of the exposure assessments in the epidemiological studies that evaluate PM mortality is their dependence on relatively simple measures of airborne PM, notably PM10 (most time-series studies) or PM2.5 (most cohort studies). These size classifications incorporate a heterogeneous mixture of particles varying in size, composition, and source of origin. Furthermore, particle characteristics vary to some extent across locations and time. Because of this heterogeneity, the toxicity of different mixtures may vary.
Potential differential toxicity is especially important in a benefits analysis in which PM exposures and resulting health impacts are modeled in diverse locations and at future times, which may result in evaluating particle compositions that differ from those observed in the epidemiological studies used as a basis for analysis. The issue of differential toxicity is an area of active research. Although information is currently inadequate for determining the relative toxicity of different particle types, recent efforts to apportion the relative impacts of different source categories to observed health effects in the epidemiological setting show promise (Laden et al. 2000; Janssen et al. 2002). Lacking information on the relative potencies of different particle types, EPA has made the assumption of constant potency across particle types in its benefits analyses. As data become available, EPA should consider a range of alternative assumptions regarding relative toxicity and incorporate these assumptions in sensitivity or uncertainty analyses.
Regarding the collection of data, most epidemiological studies of air pollution health effects use routinely collected compliance monitoring data on a limited set of criteria pollutants for which toxicity is already well-established. To resolve issues of differential toxicity, EPA will need to expand its air-monitoring network to collect data for species other than the criteria pollutants. An improvement in the air-monitoring network should facilitate generation of more specific effect coefficients, and therefore the estimation of more reliable benefits estimates. Determining the responsible toxic components in the particle mix would also result in more effective regulations, because regulations could be better designed to control the sources responsible for generation of these components.
One exposure-related issue not typically considered explicitly in benefits analyses is that different categories of emissions sources may vary dramatically in their particle intake fractions, which are the fractions of material emitted that are actually inhaled by the population (Smith 1993; Bennett et al. 2002). Differences in intake fractions between sources may be much larger than the relative impacts of the source categories on ambient PM concentrations. For example, a kilogram of primary particle emissions from diesel vehicles may have an order of magnitude or greater impact on actual population exposure than a kilogram from stationary sources, even though they have similar impacts on ambient PM concentrations, because diesel exhaust is typically emitted closer to people (Marshal et al. 2001). EPA should develop standard methods and validation procedures for evaluating intake fractions for major source categories in different locations and conditions for use in benefits estimation. Over time, such information would also help to make effect coefficients derived from epidemiological studies more specific to actual exposures.
When effect coefficients from epidemiological studies are used to derive benefits estimates, they should be applied at the same spatial scales used in the original studies to avoid biased benefits estimates. EPA followed this approach in the benefits analysis for the HD engine and diesel-fuel rule, matching pollution concentrations with population estimates within grid areas similar in scale to metropolitan areas. However, the accuracy and reliability of a central-site monitor in representing human exposures may vary among population subgroups, resulting in differences in exposure misclassification across groups. Furthermore, exposure misclassification is likely to differ by pollutant, because a central-site monitor better represents citywide concentrations for pollutants that exhibit greater spatial homogene-
ity, such as PM2.5 and sulfate, than for pollutants that exhibit small-scale spatial variations, such as coarse and ultrafine PM.
In summary, several important uncertainties in the use of exposure assessment in benefits analysis arise from the characteristics and interpretations of exposure assessment in the epidemiological studies. These uncertainties include the assumption that ambient concentrations consistently represent population exposures across locations and at future times, the assumption that sources affect population exposures in the same way that they affect modeled ambient concentrations, and the availability of health information only for aggregate PM measures, such as PM10. Other important uncertainties in exposure assessment for benefits analysis result from methods used to model air quality under alternative regulatory scenarios. Air quality models are discussed in the following section.
Air-Quality Modeling
A critical link in determining the benefits of air pollution controls is to determine how emissions changes impact air quality. This determination is traditionally done using air-quality models of varying complexity. Models can be as simple as ones that assume a direct relationship between emissions and pollutant concentrations such that a 50% reduction in emissions results in a 50% reduction in ambient concentrations. These models are called linear rollback models. Air-quality models can also be considerably more complex, attempting to represent all the processes that have an important influence on ambient pollutant concentrations, including meteorology, emissions, chemistry, and physics across a broad three-dimensional region as a function of time. These models are generally called airshed models and have a wide range of capabilities and complexity. For pollutants that undergo complex nonlinear transformation, such as ozone and many components of PM, airshed models are often used, and EPA used these models in its more recent benefits analyses.
Airshed models solve the mathematical equations governing the physics and chemistry of pollutants in the atmosphere, such as the conservation of chemical species, that characterize the chemical production, chemical destruction, and transport by wind and diffusion. Hundreds of compounds are in the atmosphere; thus, the system of equations to solve could be very large and also nonlinear. Airshed models generally use a subset of all the species
and chemical reactions because not all the compounds are well-characterized.
A difference in models is the complexity of the chemistry reflected in the model. For example, typically 20 to 80 species are used when modeling ozone. The number of species used has grown as computer capabilities have expanded. The actual representation of the chemistry used by a model is called a chemical mechanism. For most regulatory modeling, the mechanism used is carbon bond IV mechanism (CB-IV), which is a relatively more streamlined approach than other modeling mechanisms available (Gery et al. 1989).
Another aspect of models is the spatial resolution or grid size. Most recent models allow the modeler to define the resolution. For example, a model might have a horizontal grid size of 80 kilometer (km) in one application and 36 km in another application. Newer models can also vary resolution in a single application, such as by using nested grids, and some can use grid scales as fine as 1 or 2 km. Finer resolution should improve model results and allow more accurate determination of exposure changes, especially for sources, such as mobile sources, that exhibit strong spatial gradients over fine spatial scales. However, the degree of improvement that can be achieved is limited by the resolution of the input data, such as the emissions inventory data.
EPA has recently used two air-quality models for ozone analyses: the regional oxidant model (ROM) and the urban airshed model variable (UAM-V). The latter model was used in the benefits analysis for the HD engine and diesel-fuel rule. ROM is an older model that uses a nonvariable grid resolution and has relatively little vertical resolution. In addition, ROM uses an early version of CB-IV, which does not have some of the most recent updates. UAM-V has a variable grid that uses nesting and a more recent version of CB-IV and allows for a more comprehensive treatment of meteorology. However, neither ROM nor UAM-V develops the meteorological fields internally; instead, they are provided by an external meteorological model.
To model PM, EPA has recently relied on the Lagrangian particle model (LPM), the climatological regional dispersion model (CRDM), the regional particulate model (RPM), and the regulatory modeling system for aerosols and deposition (REMSAD), which was used in the benefits analysis for the HD engine and diesel-fuel rule. The LPM and CRDM are relatively simple, describing the dispersion of pollutants without chemistry,
whereas the RPM and REMSAD are built on ozone models and include chemistry and some aerosol processes.
Currently, EPA is assessing the use of the community multiscale air-quality model (CMAQ). This model can be considered a state-of-the-science, “one-atmosphere” air-quality model and is to be used in regulatory and research applications. One atmosphere refers to inclusion of all relevant processes that determine the evolution of pollutants and their interactions. The one-atmosphere approach is particularly useful because it allows integrated study of all pollutants that are important to a specific region. One problem with CMAQ is that it requires extensive resources, staff, and computer time.
How well a model works in a specific application is determined by two factors: the fidelity of the model itself and the quality of the model application. The latter is currently the more dominant factor. Thus, the credibility of the model results is determined by the modeling process. A good model application will use and evaluate the most appropriate model inputs, including emissions, meteorology, and topography. EPA relied on the best model inputs that were available at the time in the benefits analysis for the HD engine and diesel-fuel rule.
Emissions are believed to have the greatest role in air-quality model uncertainty, followed by meteorology. Significant strides have been made to improve our understanding of emissions, and many of the biases in older inventories are believed to have been remedied. At this time, the ammonia emissions inventory is believed to be the most uncertain. Ammonia is important in PM and ozone modeling because it limits the production of secondary ammonium sulfate and ammonium nitrate. Considerable research is being dedicated to this issue and is viewed as an important step in reducing uncertainties associated with these secondary products.
It is difficult to make broad generalizations regarding the accuracy of model predictions. The accuracy will depend on the model used, the pollutant modeled, the quality of the application, the available data, the spatial and temporal resolution used, the averaging times, and the areas of interest. Model accuracy should be determined empirically by comparing model estimates to actual observations in a recent period. For the HD engine and diesel-fuel rule, EPA presented fairly extensive and appropriate data on the agreement between modeled and monitored concentrations of ozone. For example, EPA reported mean normalized biases (the average difference between model predictions and observations normalized by the observa-
tions) for ozone in the eastern United States ranging from -20% to +12%, depending on the region (northeast or southeast) and specific month (June, July, or August 1995) being modeled (EPA 2000, see Table 2A-1). Poor model performance (consistent negative biases of 30-50%) in the western United States led EPA to eliminate the western United States from the benefits analysis (EPA 2000, see p. 7-12). Although extensive evaluation of PM2.5 estimates has not been possible to date due to the lack of monitoring data, this limitation may be readily addressed in future analyses with the recent establishment of a nationwide PM2.5 monitoring program.
To increase the accuracy of modeling predictions, air-quality models are typically calibrated by comparing current air quality to model predictions for current conditions. Specifically, the model is used to calculate the fractional change in pollutant concentrations between a recent time period for which data exist (the base case) and a hypothetical future time period after emissions are controlled (the control case). The fractional change is then applied to the observed pollutant level for the recent time period to derive predictions of future concentrations when proposed emissions controls have been implemented. For example, if the current observed peak ozone level is 140 parts per billion (ppb), the simulated base case is 120 ppb, and the simulated control case is 90 ppb, the ratio of the modeled quantities (90:120 or 0.75, which is known as the correction factor) is multiplied by the observed ozone level (140 ppb) to yield a predicted future ozone concentration of 105 ppb for the control case. This approach may help reduce the bias introduced by modeling errors and, therefore, may be more accurate than using model results directly (absolute values) to estimate future pollutant levels. The committee recognizes that EPA appropriately used this approach for ozone for the benefits analysis for the HD engine and diesel-fuel rule but did not do so for PM2.5, citing the lack of available PM2.5 monitoring data.
The above discussion suggests that there are still significant uncertainties in model applications. Although these uncertainties are poorly characterized, they may be decreasing with time. The models that have been used in past benefits analyses noted above are subject to many uncertainties, the older ones more so than the newer ones. Many deficiencies of the older models have been remedied in the newest model, CMAQ, which may yield improved results. However, until tests are conducted that demonstrate the expected improvements in performance, CMAQ results will have to be treated as if they carry similar levels of uncertainty to current models.
One final point regarding models is that resource constraints often prevent simultaneously estimating concentration fields with fine spatial resolution over long periods and broad areas, such as the continental United States. Compromises must be made in one or more of these dimensions (area, time, or spatial resolution). Thus, models tend to be used to estimate concentrations over low-resolution grids, such as 36 × 36 km squares, for a few days or weeks. Such large spatial scales are more appropriate for secondary pollutants (such as ozone), which exhibit relatively smooth spatial variations, than for primary pollutants (such as diesel particles), which show strong spatial gradients. Using large spatial scales limits one’s ability to assess differential exposure within urban areas and, therefore, risks to population subgroups. Although an evaluation of differential exposures would be valuable, it can only be accomplished if source emissions or air-monitoring data are available at similar or finer scales and if sufficient resources are allocated to the task.
Resource constraints have also limited the periods of air quality that have been modeled in recent benefits analyses. The temporal resolution of the model outputs in days or weeks is well-suited for modeling of episodic excursions in the standards implementation context, which is the purpose for development of most models, but relatively less useful for benefits analysis, for which longer exposure records would result in more reliable health benefits estimates. For the HD engine and diesel-fuel rule, full benefits analyses were conducted only for the year 2030, although exposure modeling results were also given for two intermediate time periods (2007 and 2020). Given the need for long-term exposure estimates and the national importance of the benefits analyses, the committee recognizes that overcoming the resource constraints is a critical need.
HEALTH OUTCOMES
Air pollution may give rise to health outcomes depending on specific pollutants and their concentration or exposure levels. The appropriate selection and interpretation of health outcomes is integral to any assessment of health benefits. Overall, the health effects of air pollution can be described on three levels. The first level is the way that air pollution adversely affects biochemical, physiological, and pathological mechanisms. The second level concerns the way these mechanisms translate into recognized
health effects (symptoms, impairment of activity, pain, or death). The third level involves translation of health effects into public health terms (incidence, prevalence, and mortality rates).
The pathophysiological effects will, if sufficiently severe, become manifest in individuals as illness (symptoms, impairment, pain, disability, death) and be attributed to certain clinical diagnoses, such as asthma or pneumonia. These effects may be associated with the use of medical services or medications. However, the health effects of many air pollutants, such as PM and ozone, lack specificity. In other words, the manifestations of these air pollutants may have other causes and cannot be understood independently from risk factors with the same outcomes.
The primary health effects resulting from air pollution have been observed in the respiratory and cardiovascular systems (ATS 1996, 2000). There is also growing evidence that air pollution exposure may cause reproductive and developmental effects (Brunekreef 1999). Short-term effects are typically minor and reversible at the levels of air pollution generally encountered in the United States, unless there is a preexisting condition that has already reduced the reserve or adaptability of the individual (ATS 1996, 2000). For example, certain air pollutants may cause a transient mild cough or eye irritation in a healthy person with plenty of functional reserve. However, for an older person who has advanced chronic respiratory disease and who is acutely ill with a respiratory infection, exposure to air pollution might result in death or some other clinically observable outcome, such as hospital admission. If the person would die soon regardless of the exposure to air pollution, the additional effect of the air pollution could be small in terms of life-years lost.1 On the other hand, if the person would otherwise recover from the respiratory infection, the loss of life-years could be appreciable. Regarding the development of chronic disease, such as chronic obstructive pulmonary disease or asthma, the effects of air pollution are likely to act together with other risk factors, such as exposure to environmental tobacco smoke.
Most of the wide range of health outcomes described by the World Health Organization (WHO 2001) were considered by EPA for its benefits analyses (see Tables 2-1 and 2-5). However, many health outcomes were not quantified (EPA 1999, 2000; see Table 7-1) and included in the primary
analysis either because of insufficient data or because of possible double-counting of health outcomes. For benefits analysis, the most important distinction is between mortality and morbidity (illness). The use of mortality and specific morbidity outcomes in the context of benefits analysis is addressed in greater detail in the following sections. A discussion on causality follows these discussions. Because the outcomes evaluated in the EPA analyses reviewed by the committee were based on epidemiological studies, the following discussions focus on issues associated with using these studies as the basis for selection of outcomes.
Mortality
Mortality effects tend to dominate health benefits estimates when they are converted to life-years lost or to dollars (monetized). The attributes of mortality—socially important, accurately recorded, and one occurrence per person—make this outcome particularly suitable for health benefits analysis. However, although recorded by a doctor and classified using the International Classification for Diseases (ICD), the medical cause of death is subject to misclassification, especially for diseases of the cardiorespiratory system. Although misclassification may be a problem for epidemiological studies, it is less important for health benefits analyses, because the available estimates for valuation of mortality are relatively similar to those for specific causes of mortality, such as cardiovascular and chronic respiratory disease, considered in health benefits analyses for criteria air pollutants. This situation may change over time with the development of disease-specific cost estimates. For benefits analyses that use the American Cancer Society (ACS) study (Pope et al. 1995), a combined coefficient was used for cardiac and pulmonary mortality, avoiding the problem of cross-coding between these two disease categories.
Evidence is strongest for the effects of air pollution on adult mortality. However, EPA (1999, 2000) noted the emerging evidence linking air pollution and infant and child mortality. EPA did not incorporate this outcome into its primary benefits estimates because the body of evidence is too sparse. As more evidence emerges, EPA should consider incorporating this outcome into its primary benefits estimates.
Morbidity
For the estimation of health benefits, the committee notes that morbidity outcomes may be classified into five categories: pathophysiological, clinical diagnoses, symptoms, use of services, and effects on activity. For pathophysiological outcomes, examples mentioned in EPA analyses include effects on lung function and pulmonary inflammation. Changes in serum fibrinogen and heart-rate variability have also been found to be important physiological outcomes (Gold et al. 2000; Schwartz 2001a). These outcomes are useful for demonstrating toxicity and understanding mechanisms but have not been used for estimating health benefits either because they are unquantifiable or because they are not easy to translate into health effects to which a dollar value can be assigned. Furthermore, they might overlap with clinical outcomes that have been quantified, and including them would result in double-counting in the total benefits estimate. For example, quantification of changes in lung function may be possible because several cohort studies are available that show a relationship between reduced lung function and mortality. However, including benefits for changes in lung function in the total benefits estimate would result in at least some double-counting, because benefits for avoided mortality and acute respiratory morbidity are already directly estimated and included in the total benefits estimate.
The second category of outcomes (clinical diagnoses) includes chronic bronchitis, asthma attacks, and chronic asthma. The problem with the diagnosis of chronic bronchitis is that it covers a wide range of severity and time courses. At the mild end of the spectrum, it can be characterized as a chronic productive cough not associated with disabling symptoms and can even remit if other factors, such as smoking or occupational exposure, are reduced. At the other end of the spectrum, chronic bronchitis can be characterized by severe chronic airways obstruction accompanied by severe disability from shortness of breath and a need for long-term care. The same problems arise with the diagnosis of asthma because of the variation in frequency, duration, and intensity of asthma attacks.
The spectrum of severity in the study population (population evaluated in the epidemiological study) cannot be easily related to the target population (population characterized for the benefits analysis). The lack of clear cate-
gorization of severity also has implications for the application of monetization techniques, such as willingness to pay (see Chapter 6). For example, the severity of an avoided case of chronic bronchitis described in a valuation study should match the severity used to derive the concentration-response function; however, such matching is difficult if severity has not been adequately characterized in the epidemiological study. EPA has recognized the problems associated with the lack of clear categorization. In the primary analysis for the HD engine and diesel-fuel rule, EPA did not include cases of chronic bronchitis that remitted but provided an alternative calculation that included the remitted cases of chronic bronchitis as cases with the lowest severity rating (EPA 2000, see Table 7-25). EPA should continue to investigate and develop methods to account for different levels of severity when estimating health benefits.
The third category of outcomes is symptoms. Benefits for reductions in a variety of respiratory symptoms were estimated in the EPA analyses examined by the committee. EPA acknowledges the difficulties of estimating these benefits. One problem is that symptoms usually occur in clusters, such as cough, shortness of breath, and wheeze. Therefore, although estimating benefits for each symptom separately, EPA correctly cautions against adding them. Another problem lies in the valuation of symptoms, which are subjective and dependent on the severity of the effect.
The fourth category of outcomes relates to medical-care interventions resulting from health problems caused by air pollution. The outcome with most available data is the use of emergency rooms or hospital admissions. Different diagnoses will incur different costs because of variations in the length of hospital stay and the costs of treatments. EPA has recognized that studies of hospital admissions often use different groupings of ICD codes, which can cause overlap and double-counting.
In the United States, most evidence for the fourth category relates to admissions for individuals aged 65 or more, because the most accessible data for epidemiological studies are from Medicare. Many studies from outside North America report admissions across all ages, but these studies have not been used by EPA, presumably because they were considered less applicable to the United States. Use of the primary-care system is another potential outcome for this category that might be important at a population level. At present, only a few studies show an association between this outcome and exposures to air pollution, and these studies were all conducted outside the United States. The committee recommends that EPA consider
data from other studies to expand the age groups for which the outcomes apply and to incorporate the use of other relevant outcomes, such as the use of the primary-care system, in its benefits analyses.
The fifth category of health outcomes relates to the effect of air pollution on general well-being and activity level. EPA has primarily used major and minor restricted-activity days and workdays lost as the indicator for this category. A restricted-activity day is a day in which a person limits his or her normal activities because of illness. As a generalized measure of illness, the use of indicators of restricted activity has considerable potential; however, few studies are available. When restricted-activity days are included in an analysis, double-counting with other specific morbidity outcomes should be avoided. For estimating health benefits, EPA realizes that people may limit their activities for example, by staying indoors or taking more preventive medication, to avoid exposure to air pollution. However, these averting behaviors are probably not included in studies that link restricted-activity days to ambient air pollution. Nevertheless, averting behaviors may represent a substantial cost to society and should be acknowledged as being unmeasured in benefits analyses.
Any health benefits analysis presupposes that the concentration-response function can be applied to a population or to subgroups within the population. Accordingly, baseline measures of outcome prevalence or incidence are required. In the case of mortality, these measures are available. However, a baseline estimate for the benefits analysis that uses the same definition of disease severity or symptoms used in the epidemiological study that provided the concentration-response functions is generally not available for certain morbidity outcomes, such as diagnoses of chronic bronchitis and asthma attacks or symptoms of cough or shortness of breath. For example, no good baseline data are available to describe the incidence or pattern of asthma attacks in the community. That makes it difficult to estimate health benefits using results from a study of subjects who were not selected at random from the population of persons with asthma. The committee concludes that the uncertainties concerning the baseline should be included in any uncertainty analysis.
The goal of health benefits analysis is to consider all relevant health outcomes; exclusion of a health benefit from an analysis should be justified. However, information is insufficient at present to ensure that all relevant pathways and mechanisms of health effects are known. This state of uncertainty supports the use of total mortality as an outcome because it does
not require knowledge of the various pathways by which air pollution led to premature death. Regarding morbidity outcomes, restricted-activity days are also a useful measure because they encapsulate a variety of health outcomes and provide a generalized measure of well-being as stated above. More research should be conducted to provide better effect estimates for restricted-activity days.
Causality
A comprehensive discussion of causality is not necessary for a benefits analysis. This discussion is typically provided in the scientific documentation for the rule-making, such as the criteria document and other related reports, and in guidance provided by EPA’s Science Advisory Board. However, a brief review of the evidence for causality is needed in a benefits analysis for two reasons. First, the review should provide justification for inclusion and exclusion of specific health outcomes considered for a given analysis. Second, a causal association between air pollution and health outcomes is a key assumption in a benefits analysis, and the uncertainty associated with this assumption needs to be incorporated into the final benefits estimates (see Chapter 5 on uncertainty).
The analyses reviewed by the committee relied on observational epidemiological studies. Approaches to assessing causality from these studies have often been based on consideration of a number of “viewpoints” described by Hill (1965).2 The viewpoints included (1) temporal sequence of the associations (cause precedes effect), (2) consistency of the findings in different studies, (3) size of the effect, (4) monotonic exposure-response relationship, (5) coherence of the study results, (6) a plausible biological mechanism, (7) specificity of outcome, (8) analogy with similar exposures, and (9) evidence of change following an intervention.
These viewpoints should not be regarded as criteria because none is sufficient, and only one (the temporal relationship) is necessary for establishing causality. The use of such viewpoints as a checklist for causality was criticized extensively by Rothman (1986) and others (Lanes and Poole
1984). Furthermore, Weed and colleagues documented the arbitrary and capricious use of causal criteria to justify predetermined conclusions (Weed 1994, 1997; Weed and Gorelic 1996; Weed and Hursting 1998; Potischman and Weed 1999). In a randomized trial, Holman et al. (2001) also provided experimental evidence showing little consensus among epidemiologists on use of causal criteria.
Hill’s (1965) intention was to provide a framework for scientific reasoning that would allow a judgment to be made on the plausibility of explanations other than causality for associations reported in observational epidemiological studies. Therefore, using these viewpoints as the direct basis for a quantitative scale to express the likelihood of causality is inappropriate. However, reasoned consideration of these and other factors does and should influence the expert judgment about the plausibility of causal interpretation of studies.
Regarding Hill’s viewpoints in the context of time-series studies that have evaluated the relationship between PM and health effects, the strongest arguments for causality have been the consistency of effects, the existence of an exposure-response relationship, and coherence of findings (Bates 1992). These arguments are bolstered by clear evidence of health effects in severe air pollution episodes (Ito et al. 1993) and the increasing mechanistic evidence linking particles to health outcomes (Gold et al. 2000; Pope et al. 1999; Peters et al 2000a,b; Peters et al. 2001). However, the toxicological evidence for health effects at low PM concentrations is mixed (Vedal 1997; Gamble 1998; Heyder et al. 1999).
Regarding Hill’s viewpoints in the context of the major cohort studies that have evaluated the relationship between PM and health effects, the considerations differ somewhat from those for time-series studies. There are too few cohort studies to satisfy the consideration of consistency, and there is less supporting experimental evidence. However, there is some specificity for cardiopulmonary outcomes and lung cancer, considerable coherence of the study results, and an analogy with similar exposures (environmental tobacco smoke).
To determine the health outcomes that should be included in a benefits analysis or to estimate the uncertainty that is associated with the causal assumptions, several factors should be considered when interpreting epidemiological studies (Hennekens and Buring 1987). One factor to consider is the strength of the association between the pollutant and a health outcome. Appropriate statistical methods are typically applied to determine the
degree to which the observed association can be explained by chance (random variability), and EPA has included the random sampling error of the estimated concentration-response function in its uncertainty assessments (see Chapter 5). Another factor to consider is the possibility that the given association can be explained by confounding. For example, in cohort studies, it is important to control for such factors as education, smoking, environmental tobacco smoke, occupation, and region. In time-series studies, it is important to control for time-varying confounders, such as season, weather variables, and day of the week. Other factors that could influence study results are bias resulting from some aspect of the study design, such as the way in which study participants are selected, and error in the measurement of input data, such as exposure or disease data. A factor that should also be considered is whether the appropriate model has been used to evaluate the data.
Two general issues pertaining to confounding are relevant to air pollutants. First, air pollutants often have a common source and are subject to similar atmospheric dispersion processes. Therefore, their concentrations will tend to be correlated, and their independent effects are often difficult to disentangle using multipollutant models (see Concentration-Response Function section). However, the EPA analyses reviewed by the committee focused on PM and ozone, which tend not to confound one another. PM is a heterogeneous mixture, however, and the component responsible for the observed effects has not been determined. That adds to the uncertainty involved in estimating health benefits. The second issue is the possibility that some unknown factor that has not been controlled for explains the association. For example, variations in air pollution levels may also be associated with short-term (day-to-day) variations in societal activity, such as increased driving, construction, and industrial activity, which may increase the daily risk of health effects (Rietveld et al. 1999; Phillips et al. 2001). Similar arguments could be constructed for behavior related to the weather (Valberg and Watson 1998).
Little information was provided in the EPA analyses to judge the plausibility of the causal relationships assumed. As stated above, the evidence of causality should be summarized to justify the inclusion or exclusion of the health outcomes and to assess the uncertainty associated with the assumption of causality, which should be incorporated into the final benefits estimates, when possible. EPA should investigate and, if necessary, develop methods of evaluating causal uncertainty in relation to key outcomes, so that this uncertainty can be represented in the final benefits estimates.
CONCENTRATION-RESPONSE FUNCTIONS
A key element of benefits analysis is the “risk function” or “response function” that describes the quantitative association between ambient air pollution and the health effect. The term “concentration-response” used by the committee in this report reflects the assumption that measurements of ambient air pollutant concentrations adequately represent population exposures. The term coined from laboratory toxicology is traditionally known as dose-response. However, dose is rarely measured in air pollution epidemiology, and therefore, the committee has adopted the use of the term concentration-response to describe population exposure-response functions.
Benefits analysis assumes that a unit reduction in the concentration will lead to a specific level of reduction in the relevant health effects as reflected by the concentration-response coefficient. Several scientific methods are used to derive the response functions, and the inherent strengths and weaknesses of each approach affect the range of uncertainty of the resulting function. In the following sections, sources of concentration-response functions are described, issues associated with selecting epidemiological studies are discussed, and strengths and weaknesses of short-term and long-term epidemiological studies are addressed. Issues associated with threshold assumptions, analysis of population subgroups, and assumptions regarding effects lags are addressed in the final sections of this chapter. For each topic area, approaches chosen by EPA are discussed.
Sources of Concentration-Response Functions
Several types of scientific studies can be used to provide concentrationresponse functions. The following sections describe the strengths and weaknesses of using animal studies, human experimental studies, and epidemiological studies as sources for concentration-response functions.
Animal Studies As Sources of Response Functions
Animal toxicological studies typically involve controlled experiments of animals in chambers exposed to specified doses of pollutants. Animal studies have the advantage of applying fully controlled randomized experimental
designs and are able to specify accurately an exposure concentration and duration to a particular pollutant. Histological examination of tissues allows observation of specific biological, genetic, or biochemical changes and may assist in identifying whether a chemical is toxic through functional impairment, tissue damage, inflammation, hyperplasia, carcinogenesis, or mutagenesis. Toxicological studies also help elucidate the biological mechanism of the effect and may allow detection of minor changes, such as alterations in enzyme levels, that might not be symptomatic in humans.
Despite the advantages of animal studies, several substantial disadvantages limit their usefulness or create additional uncertainties in the assessment of human health benefits. First, use of animal studies in a health benefits analysis requires extrapolating from animal species to humans. Second, some effects observed in certain animals may not occur in humans because of differences in organ structure, metabolism, or other factors. Third, animals are typically exposed to high concentrations to elicit a statistically significant response in a study involving only a limited number of animals. Therefore, extrapolation from responses at high concentrations to responses at concentrations similar to ambient concentrations is required. Fourth, there is often substantial uncertainty about the shape of the concentration-response function at the lower concentrations. Fifth, only limited sample sizes and subgroups may be studied with toxicological studies making it difficult to capture the whole spectrum of sensitivities in human populations. Sixth, many important public health outcomes, such as hospitalization and work loss, and exposure conditions (for example, multiple decades at low levels) cannot be studied. Finally, replication of the actual mix of pollutants found in the ambient air has been difficult. Most laboratory studies have isolated one pollutant or a set of pollutants for experimental purposes. The strength of this approach is that it can help identify the most bioactive components of the ambient air pollutant mix. However, interactions among different pollutants as they exist under true conditions cannot be assessed.
In summary, toxicological animal studies may be useful in determining whether a given pollutant is toxic and in helping to elucidate potential biological mechanisms and pathways. However, application of results from animal studies to estimate the health benefits of ambient air pollution control requires several extrapolations, each of which involves considerable uncertainty. Because of these substantial limitations, data from human studies have typically been preferred to those from animal studies.
Human Experimental Studies As Sources of Concentration-Response Functions
Given the state of the science, benefits analyses should ideally rely on human data rather than animal data. Aside from the population-based epidemiological studies discussed in the next section, human data can be obtained from functional assessments made in clinical studies and in studies of occupationally exposed workers. Clinical studies typically involve controlled experiments of human volunteers in exposure chambers. A common example of this technique involves observing changes in lung function or asthma symptoms in subjects exposed to varying levels of ozone over set periods of time. Advantages of this method include the preciseness with which the exposure and the response may be assessed, the lack of a need to extrapolate from animal species to humans, the ability to detect subclinical changes, and the ability to determine whether an exposure has an effect. Disadvantages of using clinical studies for assessing benefits include limitations in sample size, the range of certain subgroups that can be studied (typically excluding children, older persons, and those with relatively severe cardiovascular disease), the use of only acute exposures, and the difficulty in replicating the entire mix of ambient pollutants. As with animal studies, clinical studies cannot examine such outcomes as visits to the doctor or hospitalization.
Health data on occupationally exposed workers can address some of the shortcomings of clinical studies. However, workers have historically been exposed to much higher concentrations of air pollutants than the general population. Therefore, extrapolation to lower exposure concentrations is sometimes necessary. Although the baseline health of the worker population is better than that of the general population, the elevated, long-term exposures experienced by workers can provide insight into the toxicity or lack of toxicity of specific components of ambient air pollution. The epidemiological studies described in the next section allow one to estimate concentration-response functions for the general population exposed to ambient air pollutant concentrations.
Epidemiological Studies As Sources of Concentration-Response Functions
Observational epidemiological studies involve the study of humans in
real situations. Thus, human health effects are observed under a wide range of behaviors and conditions using this method. Specific to air pollution, epidemiological studies have shown that when air pollutant concentrations changed at fixed site monitors, a corresponding change occurred in the observed incidence of many health effects.
The primary advantages to using epidemiological studies are the lack of a need to extrapolate results across species and the ability to study a wide range of health outcomes, including mortality, hospitalization, and respiratory symptoms. Different subgroups also may be examined in detail. For example, the correlation between air pollution and reported health may be examined in individuals with severe asthma or older people with chronic bronchitis. An additional advantage is that researchers can examine a wide range of pollutants, pollutant mixes, and averaging times by considering multiple seasons or locations.
Disadvantages to using epidemiological studies include imprecision in the measurement of exposure and response, potential confounding of the results, and the possibility of spurious findings. Furthermore, it is difficult to determine the underlying mechanism causing the effect or to identify the specific chemical constituent responsible for the observed effect. As noted previously, finding a statistically significant association between a health effect and a specific air pollutant does not prove causality.
Another issue with epidemiological studies is that some degree of extrapolation is required. Because epidemiological studies are time-consuming and expensive, all potential health effects of ambient air pollution in all cities or regions are not investigated. Therefore, using concentration-response functions from epidemiological studies for benefits analyses will require extrapolation from the study populations to the target populations in the benefits analysis. The extrapolation of results from epidemiological studies assumes a fairly similar spatial relationship between pollution monitors and population. Therefore, researchers often assume that a given change in the ambient air concentration of an air pollutant, such as PM10, will result in the same increase in risk in the applied area of the benefits analysis as in the original study area. Given the replication of health effects associated with PM10 in many parts of the United States and the world (Holgate et al. 1999), this assumption appears reasonable.
The process of extrapolation, however, involves several uncertainties. First, the underlying socioeconomic or health status of the population for which the benefits analysis is being conducted may differ from that of the
original study. Second, the human susceptibility for effects of ambient air pollution varies within populations. For example, short-term effects of air pollution on mortality are particularly associated with cardiopulmonary death. Age or underlying diseases, such as atherosclerosis or diabetes, may further modify this effect (Zanobetti et al. 2000; Zanobetti and Schwartz 2001). Similarly, some evidence exists that educational attainment itself, or as a marker for socioeconomic status or exposure, may modify the effects of long-term exposure to air pollution (Krewski et al. 2000; Pope et al. 2002). Therefore, the point estimate of the concentration-response function may differ across populations, depending on the distribution of these factors within the target population. One additional factor that may add uncertainty to the extrapolation is the variation in the composition of an air pollutant in different locations. For example, as discussed previously, PM is composed of different chemical constituents and particle sizes and, therefore, may differ in toxicity from one location to another. This uncertainty may diminish for gaseous pollutants, such as ozone.
Sources of Concentration-Response Functions For EPA’s Analyses
For the health benefits analyses reviewed by the committee, EPA used concentration-response functions from epidemiological studies. The committee believes that this approach was appropriate because using epidemiological studies avoids many of the problems encountered in the other types of studies. This approach cannot be generalized to all analyses because epidemiology might not be able to provide valid concentration-response functions for some toxic agents. Ultimately, the plausibility of the concentration-response function and the uncertainty surrounding it should be reflected in the benefits analysis. This requires a brief summary of the evidence for causality, including animal toxicity and human clinical studies.
Selecting the Appropriate Epidemiological Studies
A key issue in benefits analysis is selecting the concentration-response estimate from those in several studies. For each epidemiological study, a concentration-response function is derived for a given population, observa-
tion time, and exposure. This function is treated as the best estimate of the underlying true function. A small portion of the inherent uncertainty between the observed best estimate and the true unknown function is usually described with confidence intervals. The uncertainty increases with each level of generalization of the observed results. For example, the uncertainty increases when the results are transferred to nonparticipants of the same population and even more when they are transferred to other ages, ethnicities, disease status, cities, regions, or countries. Therefore, a better estimate might be an average function derived from several studies that evaluate different cities and populations.
Epidemiologists have sometimes given higher credence to concentration-response functions that are averages of a number of independent but valid single studies on the same pollutant and response. However, in air pollution epidemiology, studies conducted in different regions may involve air pollution of different quality and composition and, thus, different health relevance. Difficulties are also encountered, however, when a local study is judged as methodologically less valid than some nonlocal, more sophisticated study, possibly leading to the decision to ignore local concentration-response functions and adopt the nonlocal functions. Given these uncertainties and necessary judgments, it is not surprising that analysts do not have a universally accepted paradigm or set of rules for selecting concentration-response functions. International experts have written guidelines on behalf of the European office of the World Health Organization describing the difficulties and the range of decision options available (WHO 2000, 2001). Different projects have applied different processes to select the set of studies to derive concentration-response functions. Recent studies have tended (1) to include rather than exclude studies conducted in the same region or country for which the analysis has been done; (2) to rely on variance-weighted mean estimates rather then single studies; and (3) to combine North American and western European estimates but not assume quantitative comparability of these data with those from studies conducted in South America or Asia (Ostro et al. 1996; COMEAP 1997; Ostro and Chestnut 1998; Ostro et al. 1999; Künzli et al. 2000).
The committee believes that generally the most appropriate approach is to calculate a weighted mean estimate rather than choose one study from a set of studies conducted on the same health outcome to derive the concentration-response function. This estimate should be based on the available single estimates and a weighting procedure that takes the uncer-
tainty of each point estimate into account (for example, an inverse-variance approach). Additional weighting schemes, such as those giving higher weight to local studies, to more recent studies, or to some measure of central tendency or prior evidence, may be applied. Whatever process is adopted, the inclusion or exclusion of studies and the weighting scheme should be justified and clearly explained. The committee notes that the selection process ultimately should focus only on the validity and transferability of a study and not on whether a result is statistically significant.
Selecting a particular study or a set of studies is not the only challenge. The analyst must also choose among a vast array of models and specifications within the original study or studies. In fact, researchers are usually encouraged to evaluate the sensitivity of their results to alternative models and specifications. For example, in short-term-effect studies, researchers often present results for different lag structures; for different controls for weather, time, and seasonality; and for single- and multipollutant models. Sometimes the results are relatively robust (insensitive) to these alternative model specifications. However, more often, the results vary. If the results vary using different models and specifications, the analyst should attempt to evaluate the study carefully and use the most appropriate risk estimates.
The use of single- versus multipollutant models may have a large influence on risk estimates. Some researchers have attempted to identify one or more pollutants responsible for a given health effect by entering several pollutants as independent variables into an explanatory regression model. The results of multipollutant modeling can be difficult to interpret and do not necessarily yield more reliable results.
If the effect estimate for a pollutant of interest is unchanged by the addition of a second pollutant to the regression model, then the added pollutant is either not a confounder or, because of measurement error or variable misspecification, its confounding effects cannot be detected. If the addition of a second pollutant to a multivariate regression model changes the effect estimate for the pollutant of interest, this observation may be the result of collinearity among the pollutants. Regression estimates can vary widely with the inclusion or exclusion of highly correlated covariates. Including a highly correlated copollutant increases the standard error of the estimate and the associated confidence interval and often results in highly unstable effect estimates for the pollutant of interest. In addition, the relative effect estimates of the two pollutants may be influenced by the relative magnitudes of their exposure measurement errors. Given these potential uncertainties,
a multipollutant model cannot be assumed to yield necessarily the most accurate results. Failure to include a causally linked copollutant, however, can result in both omitted variable bias and imprecision in the estimate of risk associated with exposure to the primary pollutant.
A way to estimate the importance of a given pollutant in the presence of correlated copollutants is to examine the pollutant of interest in alternative cities. For example, it is useful to consider the effects of PM10 in a range of cities that have both high and low correlations with other relevant copollutants, such as ozone or sulfur dioxide (Schwartz 2000a). A consistent PM10 effect estimate under such different circumstances supports the notion of a causal relationship.
The findings of Sarnat et al. (2001) are also important in assessing the usefulness of multipollutant models. This study demonstrated that over time, ambient concentrations of gaseous pollutants were not associated with personal exposure to these gases but were associated with personal exposure to PM2.5. PM2.5 personal exposure was in turn associated with ambient concentrations of PM2.5. The authors concluded that ambient PM2.5 may be a suitable surrogate for personal PM2.5 exposure and that ambient gaseous pollutants may also be surrogates, not confounders, for PM2.5. These relationships should be examined in future studies to establish whether this important finding can be generalized to other settings.
In summary, statistics alone cannot resolve the question of the relative influence of various pollutants on a given health outcome. Statistical results must be interpreted by experts familiar with the strengths and limitations of various modeling approaches and causal mechanistic information. In many cases, expert judgments may have as large a role as the numerical analysis in interpreting such data for benefits assessment.
EPA’s Selection of Epidemiological Studies
Overall, the committee found that the studies selected by EPA for use in its benefits analysis were generally reasonable choices. However, the criteria and process by which EPA reached its decisions are not clearly articulated in many cases. EPA should document clearly the rationale for its selection of studies and concentration-response coefficients, because these choices require judgment on the part of the analyst. For example, weighted averages of coefficients are used in some cases and coefficients
from single studies are used in others, even when multiple studies are available. It would be reasonable in some cases to extend the effect estimates to age groups beyond those used in the original study. For example, estimates for respiratory symptoms are provided only for those ages included in the original studies, such as children aged 7 to 14, when the effects are probably not restricted to this narrow age group.
Although the EPA analyses may rely on different underlying studies, the concentration-response functions for various outcomes tend to be similar across different studies. Thus, inconsistencies in the selection of studies may have little impact on the overall estimates; however, comparability across analyses might be difficult. One advantage of using the same estimate as used in other benefits analyses (rather than deriving new, even more appropriate estimates) is the ability to compare benefits estimates across different areas, times, and studies (Künzli et al. 2000).
Specifically, for long-term effects of air pollution on mortality, EPA used results from the large ACS study (Pope et al. 1995) and evaluated use of the Harvard six cities study (Dockery et al. 1993) in the sensitivity analyses. Given the size and precision in the ACS study, this decision appears to have been a reasonable one. However, the large ACS sample size is not necessarily grounds for adoption of this study over the others with smaller samples. For example, the Harvard six cities study has some advantages over the ACS study, such as the use of a random population sample and the careful placement of monitors for the study. Furthermore, the educational attainment of the Harvard six cities study was more representative of the general population than that of the population in the ACS study, indicating that the effect estimate from the ACS study might be low for the general population as educational attainment appears to be an effect modifier.
Given the reanalyses of both studies (Krewski et al. 2000), the recent extended analyses of the ACS study (Pope et al. 2002), the availability of a third U.S. cohort study (Abbey et al. 1999; McDonnell et al. 2000), the Swedish case-control study on lung cancer mortality and air pollution (Nyberg et al. 2000), and the publication of the first European cohort study (Hoek et al. in press), EPA should thoroughly review the selection of the best estimate for long-term effects of air pollution on mortality. EPA may want to consider derivation of a weighted mean estimate from the cohort studies following review of the entire database.
Short-Term Versus Long-Term Studies
Air pollution epidemiological studies have investigated the association of acute and chronic health outcomes with both short- and long-term exposures (Künzli et al. 2001a). For benefits analysis, a clear understanding of the strengths and weaknesses of studies that examine the effects of short-and long-term exposure is crucial because health benefits resulting from improvements in air quality will appear on different time scales. Therefore, key issues regarding these studies are reviewed in this section. Given its dominant role in benefits analysis and the large quantity of available data, mortality is the focus of this discussion. Data on morbidity outcomes is less comprehensive and must be improved, especially if the value assigned to mortality decreases and morbidity outcomes play a more dominant role in the benefits analyses.
Short-term exposures typically have been studied using time-series methods that test the hypothesis that daily changes in air pollution are followed within days or weeks by changes in mortality or morbidity among the exposed population in a specific area. For example, a time-series study could investigate the association between emergency room visits and air pollution each day in a community over several years. Figure 4-1 provides a simplified model of the proposed course of events that time-series studies investigate. An inherent feature of these studies is the assumed length of time periods, which are typically short (days). The duration of exposure (ta) is usually a 1-day average, often extended to a simple average over a few days. The lag time (tb) between exposure (ta) and a change in health (tc)is usually set at 1 or a few days. The time during which effects of the exposure might occur (tc) is usually fixed at 1 day.
Time-series studies have the distinct advantage of reducing potentially confounding or omitted variables because population characteristics, such as age, smoking habits, occupational exposure, and health habits, are basically unchanged over the study period. The only factors that are likely to vary with daily mortality and morbidity are environmental and meteorological conditions. Some studies have shown that mortality and morbidity vary for unknown reasons with day of week, calendar date, and certain social factors (Möller et al. 1999; Phillips et al. 1999; Smyth et al. 1999). If these factors vary on a daily basis with air pollution, then they could be confounders. However, time-series studies have typically taken into account certain weather factors, such as temperature and relative humidity, that vary on a
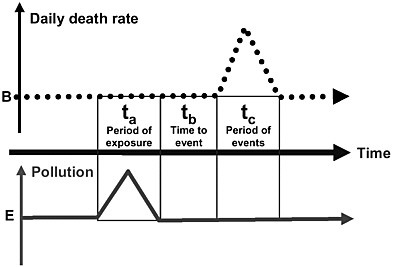
FIGURE 4-1 Simplified model of the time-series analysis, which addresses whether a change in air pollution is followed by changes in mortality (or morbidity). All time periods (period of exposure, lag time to the event, duration of the period with changed outcome rates) relevant to the model are short (a few days or weeks). B is the long-term average death rate in the population. E is the long-term average ambient pollutant concentration.
daily basis with air pollution (Samet et al. 2000; Katsouyanni et al. 2001). Another advantage of the times-series studies is that the large number of these studies offers the unprecedented opportunity to evaluate confounding, effect modification across cities, and consistency of results.
Although time-series studies are attractive for benefits analysis because the concentration-response estimates from these studies may provide strong evidence for the occurrence of an effect, most time-series studies underestimate the short-term impact. Furthermore, they do not include effects that result from long-term exposure (Künzli et al. 2001a,b).3 Only a few time-
series studies formally consider exposure over several days before the mortality event (Schwartz 2000b; Braga et al. 2001; Zanobetti et al. 2002). The more recent time-series studies that have evaluated longer exposure periods have generated effect estimates two to three times higher than those using a single-day exposure. These findings support the assumption that restricting relevant time periods to 1 or 2 days excludes short-term health effects that take a few more days or even weeks to occur. For example, an exposure may trigger a myocardial infarction, resulting in intensive care unit treatment rather than an immediate death; however, the infarction may lead to death in some cases during the period of convalescence, which may be 2 weeks after the primary event (Künzli et al. 2001a,b; Martuzzi 2001). Therefore, when evaluating the short-term effects of air pollution, analysts should use the results of time-series studies that integrate over several days or weeks the exposure period and the time period to the event (cumulative or distributed lag models) rather than those that restrict these time periods to 1 or 2 days.
Another disadvantage of using time-series studies to assess the impact of air pollution on mortality for a benefits analysis is that they do not provide information about the amount of time lost resulting from the premature deaths, which is critical information for certain valuation techniques that use life-years lost rather than mortality cases (see Chapter 6). There is evidence that the time lost due to short-term exposure is more than just displacement of a few days. Using both frequency- and time-domain methods, Zeger et al. (1999) and Schwartz (2000b) showed that most air-pollution-associated mortality is not due to such displacement. Specifically, the average life-shortening for cardiovascular deaths appears to be greater than 2 to 3 months. However, deaths resulting from chronic obstructive pulmonary disease (COPD), which consists mainly of emphysema and chronic bronchitis, may be consistent with a short-term mortality displacement hypothesis (Schwartz 2000c, 2001b).
The committee notes that the ideal epidemiological study should assess both the cumulated long-term life-time exposure and the more recent exposure patterns, including the exposure period shortly before death. The best approach would be to assess the effect of various degrees of exposure on life expectancy using a randomized intervention study, but this study design is not feasible in the field of ambient air pollution research. Studies of long-term exposure have involved both cross-sectional and prospective cohort study designs. Cross-sectional mortality studies compare baseline mortality
across populations rather than the fluctuation of rates over short time periods. However, these studies lack information on individuals, making proper adjustment for relevant covariates, such as smoking and occupational exposure, difficult, if not impossible. Therefore, cross-sectional comparisons of mortality rates are inferior sources of concentration-response functions for long-term effects.
A better approach to assessing the influence of air pollution on baseline mortality rates is the prospective cohort mortality study. These studies follow large groups of people living under environmentally distinct conditions over time and assess both their exposures and relevant health covariates. For benefits analyses, a more complete assessment of the impacts of air pollution is generated by prospective cohort mortality studies (Dockery et al. 1993; Pope et al. 1995; Abbey et al. 1999; Pope et al. 2002; Hoek et al. in press) than by time-series studies. Whereas time-series studies do not assess the effect of air pollution on baseline mortality rates, cohort studies directly measure the association of long-term exposure on life expectancy. The cohort studies are not restricted to a narrow time period between exposure and health effect but assume that some cumulated exposure experience might result in shorter life expectancy due to, for example, illnesses, such as chronic bronchitis or lung cancer (Abbey et al. 1995; Nyberg et al. 2000; Pope et al. 2002). The assumptions made are comparable to those made regarding the health effects of smoking for which the cumulated pack-years are associated with shortening of life expectancy. In contrast, the time-series approach would address the question of whether the risk of dying might be higher a few days after a day of smoking 20 cigarettes compared with smoking only five cigarettes.
Figure 4-2 illustrates the effect of long-term exposure on mortality evaluated in a prospective cohort study. In this graph, the average frailty or susceptibility of death (probability of dying) is lowest after the neonatal period and then increases over a lifetime leading to death at time T0. Repeated and cumulated long-term exposures from regular smoking or ambient air pollutants, for example, may shift the frailty level upward. As a result, time of death is shifted to a younger age (Te), Δt being the life-years lost when life expectancy in the exposure scenario is compared with that in a no-exposure scenario. Therefore, this approach assumes that the shortening of life is due to not only the exposure pattern experienced shortly before death, but also the long-term cumulated exposure experience. The exposure in the days before death might be influential because it could cause
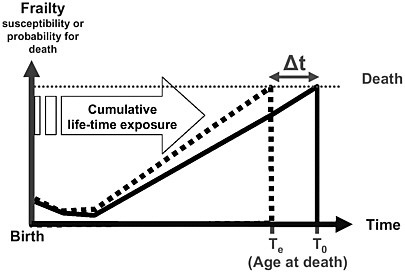
FIGURE 4-2 Simplified model for long-term exposure effects in which the frailty level increases over the lifetime, resulting in death. The basic model without exposure reaches death at age T0. Under the long-term exposure scenario (lifetime air pollution or long-term smoking), the increase in the frailty level is accelerated, reaching death at an earlier point in life, Te. Δt reflects the life-years lost due to exposure.
additional life-years to be lost (increase Δt). Thus, there might be cases in which only the past long-term exposure contributed to life-shortening, cases in which only short-term exposure before death contributed to life-shortening, and cases in which both aspects of exposure contributed to life-shortening (Künzli et al. 2001a,b). Prospective cohort studies could include the cases of mortality due to short-term exposure, as well as cases resulting from long-term exposure.
The particular advantage of the cohort studies is the measurement of time (person-years or life expectancy). Accordingly, concentration-response functions from cohort studies theoretically can be used to provide estimates of the number of lives lost due to air pollution each year and the amount of life-years lost in a population. From a public-health perspective, life-years lost might be more relevant than annual number of mortality cases.
A disadvantage of the prospective cohort air pollution study is the ecological assignment of exposure, which is inherently imprecise.4 Thus, the exposure measures may increase the statistical variability in the data, reducing the ability to observe effects. This source of variation may be particularly great when long time periods are evaluated for increasingly mobile populations. Another key disadvantage is assessing differences in mortality across different populations, in contrast to time-series studies that evaluate differences within a single population. Therefore, cohort studies may have a greater chance of confounding because of some unmeasured population characteristics.
Although cohort studies measure person-time directly, the available cohort studies present only death rates and numbers of deaths, not estimates of life-years lost. The additional number of people dying in 1 year and the life-years lost by these deaths are linked by the age distribution of these individuals at death. However, this distribution has not been published, and assumptions must be made about the age structure of air-pollution-attributable deaths. Several authors have used local data on age- and disease-specific death rates to estimate indirectly the amount of time lost due to air pollution. However, these estimates have larger uncertainties than the estimates for the lives lost (Brunekreef 1997; Pope 2000; Sommer et al. 2000; Miller 2001).
Despite some differences in the central estimates of concentration-response coefficients, the cohort studies from the United States suggest important associations between long-term exposure and time to death and appear to be the most appropriate study design to assess the impacts of air pollution on health. One finding that supports using the cohort study design over the time-series study design is the reported association between lung cancer and air pollution exposure (Nyberg et al. 2000; Pope et al. 2002). Lung cancer involves a process in which exposure to carcinogens results in the development of clinical disease (cancer) many years after exposure. In such cases, death may occur regardless of the ambient air quality during the days before death. Given this fact, the time-series study will not typically capture such cases of death, although air pollution was an underlying long-term contributing factor that led to life-shortening. In other words, the
total life-years lost from short-term exposures is not identical to the total life-years lost observed in the cohort studies. The latter quantity is greater than the quantity that can be captured by the time-series study. Therefore, it is essential to use the cohort studies in benefits analysis to capture all important effects from air pollution exposure.
EPA’s Approach to Using Short-Term and Long-Term Studies
For the estimation of mortality benefits, EPA had to choose a concentration-response function from the small number of cohort studies or from the large number of time-series studies. The committee finds that EPA’s decision to base mortality estimates primarily on the cohort studies is reasonable. Given the uncertainties in the cohort data and the publication of new studies, EPA should reevaluate the database of studies now available to derive a concentration-response function.
EPA used the time-series studies to derive benefits estimates of selected morbidity outcomes for its primary analyses. For example, in the benefits analysis for the HD engine and diesel-fuel rule, hospital admissions for various illness, such as those for COPD, were estimated using time-series studies. The committee believes that consideration of these studies is appropriate to estimate acute effects from short-term exposure. However, recent investigations have revealed problems for some models, but not all, that use the S-plus statistical software to fit generalized additive models (GAM) to the data (HEI 2002). Therefore, this problem should be thoroughly investigated to determine the effect on the coefficients used in the benefits estimation.
Analysts face the challenge of interpreting the findings from the studies that evaluate short-term and long-term exposure. Theoretically, a cohort study measures the total life-years lost due to long-term exposure to air pollution. However, the available cohort studies use crude measures of cumulative exposure, such as the annual mean value, and the effects of short-term exposures are unlikely to be fully captured in the cohort studies. Thus, the overall effect estimates may be a combination of effects from long-term exposure plus some fraction from short-term exposure. The amount of overlap is unknown (Künzli et al. 2001a,b). Zeger et al. (in press) provides a new analytical framework for addressing the contributions of various exposure time periods to the total life-years lost. The approach
has not been applied to benefits analysis but may provide further insight into the contribution of short-term and long-term exposure to life-years lost and may clarify the amount of overlap. Determining the amount of overlap between the study types is an important research need.
Finally, short- and long-term effects of air pollution on morbidity have been investigated less extensively than mortality. Therefore, the analytical uncertainties may be larger for morbidity than mortality. For long-term exposure, the contribution of PM and other pollutants to development of cardiopulmonary morbidity is an important area of scientific inquiry. EPA could play a leading role in addressing these knowledge gaps.
Linearity and Thresholds
The shape of the concentration-response functions may influence the overall estimate of benefits. The shape is particularly important for lower ambient air pollution concentrations to which a large portion of the population is exposed. For this reason, the impact of the existence of a threshold may be considerable.
In epidemiological studies, air pollution concentrations are usually measured and modeled as continuous variables. Thus, it may be feasible to test linearity and the existence of thresholds, depending on the study design. In time-series studies with the large number of repeated measurements, linearity and thresholds have been formally addressed with reasonable statistical power. For pollutants such as PM10 and PM2.5, there is no evidence for any departure of linearity in the observed range of exposure, nor any indication of a threshold. For example, examination of the mortality effects of short-term exposure to PM10 in 88 cities indicates that the concentration-response functions are not due to the high concentrations and that the slopes of these functions do not appear to increase at higher concentrations (Samet et al. 2000). Many other mortality studies have examined the shape of the concentration-response function and indicated that a linear (nonthreshold) model fit the data well (Pope 2000). Furthermore, studies conducted in cities with very low ambient pollution concentrations have similar effects per unit change in concentration as those studies conducted in cities with higher concentrations. Again, this finding suggests a fairly linear concentration-response function over the observed range of exposures.
Regarding the studies of long-term exposure, Krewski et al. (2000)
found that the assumption of a linear concentration-response function for mortality outcomes was not unreasonable. However, the statistical power to assess the shape of these functions is weakest at the upper and lower end of the observed exposure ranges. Most of the studies examining the effects of long-term exposure on morbidity compare subjects living in a small number of communities (Dockery et al. 1996; Ackermmann-Liebrich 1997; Braun-Fahrländer et al. 1997). Because the number of long-term effects studies are few and the number of communities studied is relatively small (8 to 24), the ability to test formally the absence or existence of a no-effect threshold is not feasible. However, even if thresholds exist, they may not be at the same concentration for all health outcomes.
A review of the time-series and cohort studies may lead to the conclusion that although a threshold is not apparent at commonly observed concentrations, one may exist at lower levels. An important point to acknowledge regarding thresholds is that for health benefits analysis a key threshold is the population threshold (the lowest of the individual thresholds). However, the population threshold would be very difficult to observe empirically through epidemiology, because epidemiology integrates information from very large groups of people (thousands). Air pollution regulations affect even larger groups of people (millions). It is reasonable to assume that among such large groups susceptibility to air pollution health effects varies considerably across individuals and depends on a large set of underlying factors, including genetic makeup, age, exposure measurement error, preexisting disease, and simultaneous exposures from smoking and occupational hazards. This variation in individual susceptibilities and the resulting distribution of individual thresholds underlies the concentration-response function observed in epidemiology. Thus, until biologically based models of the distribution of individual thresholds are developed, it may be productive to assume that the population concentration-response function is continuous and to focus on finding evidence of changes in its slope as one approaches lower concentrations.
EPA’s Use of Thresholds
In EPA’s benefits analyses, threshold issues were discussed and interpreted. For the PM and ozone National Ambient Air Quality Standards (NAAQS), EPA investigated the effects of a potential threshold or refer-
ence value below which health consequences were assumed to be zero (EPA 1997). Specifically, the high-end benefits estimate assumed a 12-microgram per cubic meter (µg/m3) mean threshold for mortality associated with long-term exposure to PM2.5. The low-end benefits estimate assumed a 15-µg/m3 threshold for all PM-related health effects. The studies, however, included concentrations as low as 7.5 µg/m3. For the Tier 2 rule and the HD engine and diesel-fuel rule, no threshold was assumed (EPA 1999, 2000). EPA in these analyses acknowledged that there was no evidence for a threshold for PM.
Several points should be noted regarding the threshold assumptions. If a threshold is assumed where one was not apparent in the original study, then the data should be refit and a new curve generated with the assumption of a zero slope over a segment of the concentration-response function that was originally found to be positively sloped. The assumption of a zero slope over a portion of the curve will force the slope in the remaining segment of the positively sloped concentration-response function to be greater than was indicated in the original study. A new concentration-response function was not generated for EPA’s benefits analysis for the PM and ozone NAAQS for which threshold assumptions were made. The generation of the steeper slope in the remaining portion of the concentration-response function may fully offset the effect of assuming a threshold. These aspects of assuming a threshold in a benefits analysis where one was not indicated in the original study should be conveyed to the reader. The committee notes that the treatment of thresholds should be evaluated in a consistent and transparent framework by using different explicit assumptions in the formal uncertainty analyses (see Chapter 5).
Analysis of Population Subgroups
Regulators may want to understand the differential effects of regulations for a variety of reasons, including the question of equity, the desire to achieve the maximum benefit, and regional interests. Differential health effects may occur because the effects of the regulation result in different reductions in population exposures or because subgroups within the population vary in response to a given exposure reduction. The latter effect can occur because baseline rates of health outcomes may vary across subgroups or because the concentration-response function may differ across
subgroups. Differential health effects may be of interest across geographic regions; across demographic categories of sex, age, or race; or across groups with varying health status (such as persons with asthma versus those without asthma), socioeconomic status, or behavioral factors (such as smokers versus nonsmokers).
To investigate the possibility of differential exposure reductions, exposure must be estimated on relevant spatial scales. Exposure is most easily estimated spatially at the level of town or region. However, analysts may need to consider other dimensions. For example, the association between health effects and proximity to heavily traveled roads may need to be investigated. For this study, the exposure could be estimated using geographical information system (GIS) methods, and possible health effects could be evaluated using epidemiological data relating increases in respiratory problems to traffic proximity. It might also be important to model exposure at the small area level, such as inner-city environments. As indicated previously, when estimating health benefits associated with finely mapped exposures, concentration-response functions should be derived from epidemiological studies conducted at similar geographical exposure scales.
Given the assumption that the relative risk of a health outcome is proportional to the level of exposure, the predicted number of cases for a specific health outcome will also be proportional to the baseline rate for that health outcome. Because baseline risks for subgroups can vary by an order of magnitude or more, the additional number of cases in two subgroups of the same size can vary by that amount. Therefore, special attention should be given to the subgroups at the greatest baseline risks, where the attributable risks would be greatest (Künzli 2002; Röösli et al. in press).
As noted above, expected health benefits across subgroups may vary because of differences in the concentration-response function. The differences may arise from variations in vulnerability due to age, preexisting disease, or factors related to socioeconomic status. Alternatively, regional differences in concentration-response functions may reflect differential toxicity of regional PM. Recent studies suggest some differences in concentration-response functions across different subgroups, such as persons from cities with higher traffic-related primary emissions (Katsouyanni et al. 2001; Rijnders et al. 2001) or persons with different educational levels (Krewski et al. 2000; Pope et al. 2002).
The complexity and uncertainty of analyzing subgroups in benefits analysis can be illustrated with the results of the recent extended follow-up of
the ACS cohort (Pope et al. 2002). The study observed different sizes of the concentration-response function for men and women, the concentration-response function being smaller and nonsignificant for women. Furthermore, associations of air pollution with mortality were strong in groups with low educational level but decreased with increased educational level. No association was observed among those with more than a high-school degree. Specifically, relative risks of all-cause mortality were estimated to be 1.2 per 10 µg/m3 for the subgroup with less than a high-school education and 1.0 per 10µg/m3 for those with more than a high-school education. The underlying reasons for these differences across subgroups are not known, but several explanations may be possible.
Depending on the interpretation, analysts may choose different strategies for benefits analysis, reaching potentially different results. For example, if a sex difference is explained genetically (only men being susceptible to effects of long-term exposure) only men would be included in the analysis—modeling and deriving exposure, baseline health frequencies, and concentration-response functions for men only. However, differences in exposure to air pollution may cause concentration-response functions to appear dissimilar. For example, in the Pope et al. (2002) study, the disappearance of an effect in the high-education group may be explained partly by errors in the assigned exposure. Specifically, the wealthier individuals typically live in the cleaner parts of cities. Thus, the assigned concentration may overestimate true residential exposure among the wealthy, but underestimate exposure among the economically disadvantaged. Given this scenario, the true exposure may be lower among the high-education group and the variation of exposure for this group across cities may be smaller than the measures used in model estimation. This may reduce the statistical power in the high-education group and bias the concentration-response function. If the subgroup findings are driven by exposure measurement issues, a subgroup benefits analysis may be less appropriate than simply applying the aggregate total risk function for the full population.
EPA’s Analysis of Subgroups
EPA analyzed subgroup-specific effects only to the extent that benefits were assessed for the subgroups considered in the original studies (for example, restriction by age for mortality [more than 30 years] or for lower
respiratory symptoms among children [7-14 years]). Other potentially relevant strata were not considered. EPA should explain its decision to extrapolate (or not) to other subgroups. Risk assessors should be aware of the paradox that a sophisticated assessment requiring more complex analytical tools may have more biased findings than a simple aggregated analysis.
As a final note, a hierarchical set of models (models that increase in complexity with each stage of the analysis) may help to distinguish factors that affect the results. For example, in the first stage of a multicity analysis, regressions may be run relating mortality and morbidity to air pollution for each city. In the second stage of the analysis, city-specific factors, such as socioeconomic and demographic factors or copollutants, may be examined to determine whether these factors influence the first-stage city-specific effect estimates. Samet et al. (2000) tested for effect modification of the PM10-mortality association among the 90 cities used in the study. Using citywide statistics, they tested for potential modification using local socioeconomic-related variables, including household income, educational level, public transit use, and unemployment level. None of those factors helped to explain the city-specific pollution effects. However, the variable representing educational level had a moderate association with the regression coefficient for PM10.
Effect Lags and EPA’s Assumptions
Understanding long-term disease processes is important for benefits analysis. For example, certain health benefits resulting from a change in air quality may occur only after several years. Although it appears that mortality following short-term exposure to PM occurs within a relatively short time, little is known about the temporal relationship between longer-term exposure and mortality as demonstrated in the prospective cohort studies. For example, the ACS study (Pope et al. 1995) provided little information as to whether the observed geographic differences in mortality risks are due to a 1-year average or some multiyear history of PM exposures preceding mortality. Thus, it is not known which period of exposure is the most important and how quickly benefits from air pollution reductions will appear in the case of long-term disease processes. In the Swedish lung cancer study (Nyberg et al. 2000), effects were strongest for the exposure 20-30 years ago. For other outcomes, other time periods may be relevant.
The time course relating exposure to outcome is an important assumption in benefits analysis, especially when long-term mortality effects dominate the analysis, as occurs in PM analyses. It is important because health benefits that occur far into the future may count less based on the way the benefits are monetized. In EPA’s benefits analyses for the Tier 2 rule and the HD engine and diesel-fuel rule, EPA assumed a weighted 5-year time course of benefits in which 25% of the PM-related mortality benefits were assumed to occur in the first and second year, and 16.7% were assumed to occur in each of the remaining 3 years. Although recommended by EPA’s Science Advisory Board, the committee found little justification for a 5-year time course and recommends that future benefits analyses more fully account for the uncertainty regarding lags in health effects by incorporating a range of assumptions and probabilities on the temporal relationship.
CONCLUSIONS
-
EPA’s approaches to exposure assessment have evolved considerably over time because of the continued improvement in the models and the marked increase in available monitoring data for key pollutants. Overall, the methods used in the most recent EPA analysis reviewed by the committee (heavy-duty engine and diesel-fuel analysis) represent an appropriate and reasonably thorough application of the available data and models for exposure assessment.
-
Many uncertainties associated with exposure assessment need to be addressed more fully as more data become available. These uncertainties include the assumptions that ambient pollutant concentrations consistently represent population exposures across locations and at future times, that sources affect actual exposures in the same way that they affect ambient concentrations, and that all particle types have a constant potency.
-
The appropriate selection and definition of adverse health outcomes is integral to any assessment of health benefits. A wide range of health effects associated with exposure to air pollution has been described and most of them have been carefully considered by EPA. However, many health outcomes are not quantified because of insufficient data or because of the potential for double-counting.
-
Data for many health outcomes are restricted to a specific age group, and EPA did not extrapolate those data beyond the age ranges pro-
-
vided in the studies. However, recent studies conducted outside the United States provide information on certain health outcomes with broader age ranges and on outcomes, such as use of the primary care system, not evaluated by EPA.
-
EPA used concentration-response functions from epidemiological studies. The committee supports this approach because using epidemiological studies avoids many of the problems encountered with animal toxicity and human clinical studies.
-
The studies selected by EPA for use in its benefits analyses were generally reasonable choices. However, the criteria and the process by which EPA reached its decisions are often not clearly articulated.
-
For the analysis of mortality, EPA used cohort studies to derive benefits estimates in the analyses reviewed by the committee. The committee supports this approach. Compared with time-series studies, cohort studies give a more complete assessment of the long-term, cumulative effects of air pollution. Furthermore, the particular advantage of cohort studies is that they provide data to estimate the number of life-years lost in a population, not just the number of lives lost, thus allowing for several valuation methods to be used.
RECOMMENDATIONS
-
As in all other stages of the benefits analysis, EPA should justify and clearly describe the assumptions and methods used to assess exposure, choose health outcomes, and select studies and concentration-response functions, paying careful attention to assessing and communicating key sources of uncertainty.
-
Because pollution modeling rarely addresses the smaller-scale issue of how local concentrations from specific source categories interact with human time-activity patterns, EPA should examine how different major source categories, for example, mobile versus large stationary sources, affect total exposures per unit emissions.
-
EPA has typically made the assumption of equivalent potency across particle types because of insufficient scientific information. As more data become available, EPA should strengthen its benefits analyses by evaluating a range of alternative assumptions regarding relative particle toxicity and incorporate these assumptions in sensitivity or uncertainty analyses.
-
The lack of clear categorization of severity of certain health outcomes in benefits analyses has implications for the quantification and the valuation of these outcomes. Although EPA has made some attempt to recognize this issue, it should continue to develop and improve methods used to reconcile differences between the severity of disease described in air pollution epidemiology and that commonly used to develop estimates of background disease prevalence and incidence.
-
EPA should consider data from U.S. and non-U.S. studies to extrapolate beyond the age groups evaluated and incorporate other relevant outcomes not evaluated in its current benefits analyses.
-
EPA should give more emphasis to the assessment, presentation, and communication of changes in morbidity. Although often difficult to quantify, these factors may begin to play a more dominant role in benefits analysis if the value assigned to mortality decreases.
-
EPA provided little information in the benefits analyses reviewed by the committee on causal association between particular types of air pollution and adverse health outcomes. EPA should summarize the evidence for causality to justify the inclusion or exclusion of the health outcomes and to assess the uncertainty associated with the assumption of causality.
-
EPA should investigate and, if necessary, develop methods of evaluating causal uncertainty relating to key outcomes so that this uncertainty can be represented in the final benefits estimates.
-
Although the committee believes the use of the ACS study to derive premature mortality estimates was reasonable, EPA should thoroughly review its selection of the best estimate for long-term effects of air pollution on mortality. Several new studies have been published since the ACS study, including an extended analysis of the ACS study, a new U.S. cohort study, and other non-U.S. studies. EPA should also consider whether the derivation of a weighted mean estimate from the cohort studies is appropriate following review of the database.
-
To evaluate short-term effects of air pollution, EPA should use concentration-response functions from studies that integrate over several days or weeks the exposure period and the time period to the event (cumulative or distributed lag models) rather than those that restrict these time periods to 1 or 2 days.
-
Although the assumption of no thresholds in the most recent EPA benefits analyses was appropriate, EPA should evaluate threshold assump-
-
tions in a consistent and transparent framework using several alternative assumptions in the formal uncertainty analysis.
-
The committee found little justification for the 5-year time course of exposure and outcome assumed in the more recent EPA analyses and recommends that EPA more fully account for the uncertainty regarding lags in health effects by incorporating a range of assumptions and probabilities on the temporal relationship.
-
EPA is encouraged to estimate and report benefits by age, sex, and other demographic factors. The committee recognizes, however, that evaluating the differences for various subgroups adds complexity and uncertainty to the analysis and that caution must be exercised in the interpretation of such results.
REFERENCES
Abbey, D.E., B.L. Hwang, and R.J. Burchette. 1995. Estimated long-term ambient concentrations of PM10 and development of respiratory symptoms in a nonsmoking population. Arch. Environ. Health 50(2):139-152.
Abbey, D.E., N. Nishino, W.F. McDonnel, R.J. Burchette, S.F. Knutsen, W.L. Beeson, and J.X. Yang. 1999. Long-term inhalable particles and other air pollutants related to mortality in nonsmokers. Am. J. Respir. Crit. Care Med. 159(2):373-382.
Ackermann-Liebrich, U., P. Leuenberger, J. Schwartz, C. Schindler, C. Monn, G. Bolognini, J.P. Bongard, O. Brandli, G. Domenighetti, S. Elsasser, L. Grize, W. Karrer, R. Keller, H. Keller-Wossidlo, N. Künzli, B.W. Martin, T.C. Medici, A.P. Perruchoud, M.H. Schoni, J.M. Tschopp, B. Villiger, B. Wuthrich, J.P. Zellweger, and E. Zemp. 1997. Lung function and long-term exposure to air pollutants in Switzerland. Study on air pollution and lung disease in adult (SAPALDIA) team. Am. J. Respir. Crit. Care Med. 155(1):122-129.
ATS (American Thoracic Society). 1996. Health effects of outdoor air pollution. Committee of the Environmental and Occupational Health Assembly of the American Thoracic Society. Am. J. Respir. Crit. Care Med. 153(1):3-50.
ATS (American Thoracic Society). 2000. What constitutes an adverse health effect of air pollution? Official statement of the American Thoracic Society. Am. J. Respir. Crit. Care Med. 161(2 Pt. 1):665-673.
Bates, D.V. 1992. Health indices of the adverse effects of air pollution: The question of coherence. Environ. Res. 59(2):336-349.
Bennett, D.H., T.E. McKone, J.S. Evans, W.M. Nazaroff, M.D. Margni, O. Jolliet, and K.R. Smith. 2002. Defining intake fraction. Environ. Sci. Technol. 36(9):207A-211A.
Braga, A.L., A. Zanobetti, and J. Schwartz. 2001. The lag structure between particulate air pollution and respiratory and cardiovascular deaths in 10 U.S. cities. J. Occup. Environ. Med. 43(11):927-933.
Braun-Fahrländer, C., J.C. Vuille, F.H. Sennhauser, U. Neu, T. Kunzle, L. Grize, M. Gassner, C. Minder, C. Schindler, H.S. Varonier, and B. Wuthrich. 1997. Respiratory health and long-term exposure to air pollutants in Swiss schoolchildren. SCARPOL Team. Swiss study on childhood allergy and respiratory symptoms with respect to air pollution, climate and pollen. Am. J. Respir. Crit. Care Med. 155(3):1042-1049.
Brunekreef, B. 1997. Air pollution and life expectancy: Is there a relation? Occup. Environ. Med. 54(11):781-784.
Brunekreef, B. 1999. Air pollution kills babies. Epidemiology 10(6):661-662.
COMEAP (Committee on the Medical Effects of Air Pollutants). 1997. The Quantification of the Effects of Air Pollution on Health in the United Kingdom. Department of Health, U.K. [Online]. Available: http://www.doh.gov.uk/comeap/statementsreports/airpol7.htm [accessed September 10, 2002].
Dockery, D.W., C.A. Pope, X. Xu, J.D. Spengler, J.H. Ware, M.E. Fay, B.G. Ferris, and F.E. Speizer. 1993. An association between air pollution and mortality in six U.S. cities. N. Engl. J. Med. 329(24):1753-1759.
Dockery, D., J. Cunningham, A.L. Damokosh, L.M. Neas, J.D. Spengler, P. Koutrakis, J.H. Ware, M. Raizenne, and F.E. Speizer. 1996. Health effects of acid aerosols on North American children: Respiratory symptoms . Environ. Health Perspect. 104(5):500-505.
EPA (U.S. Environmental Protection Agency). 1997. Regulatory Impact Analyses for the Particulate Matter and Ozone. National Ambient Air Quality Standards (NAAQS) and Proposed Regional Haze Rule. Regulatory Economic Analysis Inventory. A.97.9. Office of Air Quality Planning and Standards, Office of Air and Radiation, U.S. Environmental Protection Agency, Research Triangle Park, NC.
EPA (U.S. Environmental Protection Agency). 1999. Regulatory Impact Analysis – Control of Air Pollution from New Motor Vehicles: Tier 2 Motor Vehicle Emissions Standards and Gasoline Sulfur Control Requirements. EPA 420-R-99-023. Engine Program and Compliance Division, Office of Mobile Sources, Office of Air and Radiation, U.S. Environmental Protection Agency. December 1999. [Online]. Available: http://www.epa.gov/OMS/regs/ld-hwy/tier-2/frm/ria/r99023.pdf [accessed September 10, 2002].
EPA (U.S. Environmental Protection Agency). 2000. Regulatory Impact Analysis: Heavy-Duty Engine and Vehicle Standards and Highway Diesel Fuel Sulfur Control Requirements. EPA 420-R-00-026. Office of Air and Radiation, U.S. Environmental Protection Agency, Washington, DC. December 2000.
Gamble, J.F. 1998. PM2.5 and mortality in long-term prospective cohort studies: Cause-effect or statistical associations? Environ. Health Perspect. 106(9):535-549.
Gery, M.W., G.Z. Whitten, J.P. Killus, and M.C. Dodge. 1989. A photochemical kinetics mechanism for urban and regional scale computer modeling. J. Geophys. Res. 94 (D10):12925-12956.
Gold, D.R., A. Litonjua, J. Schwartz, E. Lovett, A. Larson, B. Nearing, G. Allen, M. Verrier, R. Cherry, and R. Verrier. 2000. Ambient pollution and heart rate variability. Circulation 101(11):1267-1273.
HEI (Health Effects Institute). 2002. Important New Findings from NMMAPS Investigators. June 2002. [Online]. Available: www.healtheffects.org/news.htm [accessed September 10, 2002].
Hennekens, C.H., and J.E. Burning. 1987. Epidemiology in Medicine, 1st Ed., S.L. Mayrent, ed. Boston: Little Brown.
Heyder, J., I. Beck-Speier, B. Busch, P. Dirscherl, P. Heilmann, G.A. Ferron, M. Josten, E. Karg, W.G. Kreyling, A.G. Lenz, K.L. Maier, U. Miaskowski, S. Platz, P. Reitmeir, H. Schulz, S. Takenaka, and A. Ziesenis. 1999. Health effects of sulfur-related environmental air pollution. 1. Executive summary. Inhal. Toxicol. 11(5):343-359.
Hill, A.B. 1965. The environment and disease: Association or causation? Proc. R. Soc. Med. 58:
295-300.Hoek, G., B. Brunekreef, S. Goldbohm, P. Fischer, P.A. van den Brandt. In press. The association between mortality and indicators of traffic-related air pollution in a Dutch cohort study. Lancet.
Holgate, S., J. Samet, H. Koren, and R. Maynard. 1999. Air Pollution and Health. San Diego: Academic Press.
Holman, C.D., D.E. Arnold-Reed, N. de Klerk, C. McComb, and D.R. English. 2001. A psychometric experiment in causal inference to estimate evidential weights used by epidemiologists. Epidemiology 12(2):246-255.
Ito, K., G.D. Thurston, C. Hayes, and M. Lippmann. 1993. Associations of London, England, daily mortality with particulate matter, sulfur dioxide, and acidic aerosol pollution. Arch. Environ. Health 48(4):213-220.
Janssen, N.A.H., J. Schwartz, A. Zanobetti, and H.H. Suh. 2002. Air conditioning and source-specific particles as modifiers of the effect of PM10 on hospital admissions for heart and lung disease. Environ. Health Perspect. 110(1):43-49.
Katsouyanni, K., G. Touloumi, E. Samoli, A. Gryparis, A. Le Tertre, Y. Monopolis, G. Rossi, D. Zmirou, F. Ballester, A. Boumghar, H.R. Anderson, B. Wojtyniak, A. Paldy, R. Braunstein, J. Pekkanen, C. Schindler, and J. Schwartz. 2001. Confounding and effect modification in the short-term effects of ambient particles on total mortality: Results from 29 European cities within the APHEA2 project. Epidemiology 12(5):521-531.
Kinney, P.L. 1999. The pulmonary effects of outdoor ozone and particle air pollution. Semin. Respir. Crit. Care Med. 20(6):601-607.
Krewski,D., R.T.Burnett, M.S.Goldberg, K.Hoover, J.Siemiatycki, M.Jerrett, M. Abrahamowicz, and W.H. White. 2000. Reanalysis of the Harvard Six Cities Study and the American Cancer Society Study of Particulate Air Pollution and
Mortality, A Special Report of the Institute’s Particle Epidemiology Reanalysis Project. Final Version. Health Effects Institute, Cambridge, MA. July 2000. [Online]. Available: http://www.healtheffects.org/pubs-special.htm [accessed September 10, 2002].
Künzli, N., R. Kaiser, S. Medina, M. Studnicka, O. Chanel, P. Filliger, M. Herry, F. Horak Jr., V. Puybonnieux-Texier, P. Quenel, J. Schneider, R. Seethaler, J.C. Vergnaud, and H. Sommer. 2000. Public-health impact of outdoor and traffic-related air pollution: A European assessment. Lancet 356(9232):795-801
Künzli, N., S. Medina, R. Kaiser, P. Quénel, F. Horak Jr, and M. Studnicka. 2001a. Assessment of death attributable to air pollution: Should we use risk estimates based on time series or on cohort studies? Am. J. Epidemiol. 153(11):1050-1055.
Künzli, N., R. Kaiser, and S. Medina. 2001b. RE: Assessment of death attributable to air pollution: Should we use risk estimates based on time series or on cohort studies? [Letter]. Am. J. Epidemiol. 154(10):974-975.
Künzli, N. 2002. The public health relevance of air pollution abatement. Eur. Respir. J. 20(1):198-209.
Laden, F., L.M. Neas, D.W. Dockery, and J. Schwartz. 2000. Association of fine particulate matter from different sources with daily mortality in six U.S. cities. Environ. Health Perspect. 108(10):941-947.
Lanes, S.F. and C. Poole. 1984. “Truth in packaging?” The unwrapping of epidemiologic research. J. Occup. Med. 26(8):571-574.
Martuzzi, M. 2001. RE: Assessment of death attributable to air pollution: Should we use risk estimates based on time series or on cohort studies? [Letter]. Am. J. Epidemiol. 154(10):974.
Marshal, J., W. Riley, T. McKone, and W. Nazaroff. 2001. Estimating Exposure to Motor Vehicle Emissions: The Dose Fraction Approach. ISEA 2001, Exposure Analysis: An Integral Part of Disease Prevention, Annual Conference of International Society of Exposure Analysis, November 4-8, 2001, Charleston, SC.
McDonnell, W.F., N. Nishino-Ishikawa, F.F. Petersen, L.H. Chen, and D.E. Abbey. 2000. Relationships of mortality with the fine and coarse fractions of long-term ambient PM10 concentrations in nonsmokers. J. Expo. Anal. Environ. Epidemiol. 10(5):427-436.
Miller, B.G. 2001. Life-table methods for predicting and quantifying long-term impacts on mortality. Pp. 20-23 in Quantification of the Health Effects of Exposure to Air Pollution: Report of a WHO Working Group. EUR/01/5026342. European Centre for Environment and Health, World Health Organization.
Möller, J., J. Hallqvist, F. Diderichsen, T. Theorell, C. Reuterwall, and A. Ahlbom. 1999. Do episodes of anger trigger myocardial infarction? A case-crossover analysis in the Stockholm Heart Epidemiology Program (SHEEP). Psychosom. Med. 61(6):842-849.
NRC (National Research Council). 1991. Human Exposure for Airborne Pollutants: Advances and Opportunities. Washington, DC: National Academy Press.
Nyberg, F., P. Gustavsson, L. Jarup, T. Bellander, N. Berglind, R. Jakobsson, and G.
Pershagen 2000. Urban air pollution and lung cancer in Stockholm. [Editorial]. Epidemiology 11(5):487-495.
Ostro, B., and L. Chestnut. 1998. Assessing the health benefits of reducing particulate matter air pollution in the United States. Environ. Res. 76(2):94-106.
Ostro, B., J.M. Sanchez, C. Aranda, and G.S. Eskeland. 1996. Air pollution and mortality: Results from a study of Santiago, Chile. J. Expo. Anal. Environ. Epidemiol. 6(1):97-114.
Ostro, B., L. Chestnut, N. Vichit-Vadakan, and A. Laixuthai. 1999. The impact of particulate matter on daily mortality in Bangkok, Thailand. J. Air Waste Manage. Assoc. 49(9):100-107.
Ott, W.R. 1995. Human exposure assessment: The birth of a new science. J. Expo. Anal. Environ. Epidemiol. 5(4):449-472.
Peters, A., E. Liu, R.L. Verrier, J. Schwartz, D.R. Gold, and M. Mittleman. 2000a. Air pollution and incidence of cardiac arrhythmia. Epidemiology 11(1):11-17.
Peters, A., S. Perz, A. Döring, J. Stieber, W. Koenig, and H.E. Wichmann. 2000b. Activation of the autonomic nervous system and blood coagulation in association with an air pollution episode. Inhal. Toxicol. 12(Suppl. 2):51-61.
Peters, A., D.W. Dockery, J.E. Muller, and M.A. Mittleman. 2001. Increased particulate air pollution and the triggering of myocardial infarction. Circulation 103(23):2810-2815.
Phillips, D.P., N. Christenfeld, and N.M. Ryan. 1999. An increase in the number of deaths in the United States in the first week of the month—an association with substance abuse and other causes of death. N. Engl. J. Med. 341(2):93-98.
Phillips, D.P., G.C. Liu, K. Kwok, J.R. Jarvinen, W. Zhang, and I.S. Abramson. 2001. The Hound of the Baskervilles effect: Natural experiment on the influence of psychological stress on timing of death. BMJ 323(7327):1443-1446.
Pope, C.A. III. 2000. Epidemiology of fine particulate air pollution and human health: Biologic mechanisms and who’s at risk? Environ. Health Perspect. 108(Suppl. 4):713-723.
Pope, C.A. III, M.J. Thun, M.M. Namboodiri, D.W. Dockery, J.S. Evans, F.E. Speizer, and C.W. Heath Jr. 1995. Particulate air pollution as a predictor of mortality in a prospective study of U.S. adults. Am. J. Respir. Crit. Care Med. 151(3 Pt 1):669-674.
Pope, C.A. III, R.L. Verrier, E.G. Lovett, A.C. Larson, M.E. Raizenne, and R.E. Kanner. 1999. Heart rate variability associated with particulate air pollution. Am. Heart J. 138(5 Pt. 1):890-899.
Pope, C.A. III, R.T. Burnett, M.J. Thun, E.E. Calle, D. Krewski, K. Ito, and G.D. Thurston. 2002. Lung cancer, cardiopulmonary mortality, and long-term exposure to fine particulate air pollution. JAMA. 287(9):1132-1141.
Potischman, N., and D.L. Weed. 1999. Causal criteria in nutritional epidemiology. Am. J. Clin. Nutr. 69(6):1309S-1314S.
Rietveld, S., I. van Beest, and W. Everaerd. 1999. Stress-induced breathlessness in asthma. Psychol. Med. 29(6):1359-1366.
Rijnders, E., N.A. Janssen, P.H. van Vliet, and B. Brunekreef. 2001. Personal and outdoor nitrogen dioxide concentrations in relation to degree of urbanization and traffic density. Environ. Health Perspect. 109(Suppl 3):411-417.
Rojas-Bracho, L., H.H. Suh, and P. Koutrakis. 2000. Relationships among personal, indoor, and outdoor fine and coarse particle concentrations for individuals with COPD. J. Expo. Anal. Environ. Epidemiol. 10(3):294-306.
Röösli, M., N. Künzli, C. Schindler, and C. Braun-Fahrländer. In press. What effect measure should be used for impact assessment in a new population context? J. Human Ecol. Risk Assess.
Rothman, K.J. 1986. Pp. 16-20 in Modern Epidemiology, 1st Ed. Boston: Little, Brown.
Samet, J.M., S.L. Zeger, F. Dominici, F. Courriero, I. Coursac, D.W. Dockery, J. Schwartz, and A. Zanobetti. 2000. The National Morbidity and Mortality Air Pollution Study. Part 2: Morbidity and Mortality from Air Pollution in the United States, Research Report 94. Health Effects Institute, Cambridge, MA. June 2000. [Online]. Available: http://www.healtheffects.org/Pubs/Samet2.pdf [accessed September 10, 2002].
Sarnat, J.A., P. Koutrakis, and H.H. Suh. 2000. Assessing the relationship between personal particulate and gaseous exposure of senior citizens living in Baltimore, MD. J. Air Waste Manage. Assoc. 50(7):1184-1198.
Sarnat, J.A., J. Schwartz, P.J. Catalano, and H.H. Suh. 2001. Gaseous pollutants in particulate matter epidemiology: Confounders or surrogates? Environ. Health Perspect. 109(10):1053-1061.
Schwartz, J. 2000a. Assessing confounding, effect modification and thresholds in the association between ambient particles and daily deaths. Environ. Health Perspect. 108(6):563-568.
Schwartz, J. 2000b. The distributed lag between air pollution and daily deaths. Epidemiology 11(3):320-326.
Schwartz, J. 2000c. Harvesting and long term exposure effects in the relation between air pollution and mortality. Am. J. Epidemiol. 151(5):440-448.
Schwartz, J. 2001a. Air pollution and blood markers of cardiovascular risk. Environ. Health Perspect. 109 (Suppl. 3):405-409.
Schwartz, J. 2001b. Is there harvesting in the association of airborne particles with daily deaths and hospital admissions? Epidemiology 12(1):55-61.
Smith, KR. 1993. Fuel combustion, air pollution and health: The situation in developing countries. Annu. Rev. Energy Environ. 18:529-566.
Smyth, J.M., M.H. Soefer, A. Hurewitz, A. Kliment, and A.A. Stone. 1999. Daily psychosocial factors predict levels and diurnal cycles of asthma symptomatology and peak flow. J. Behav. Med. 22(2):179-193.
Sommer, H., N. Künzli, R. Seethaler, O. Chanel, M. Herry, S. Masson, J.C. Vergnaud, P. Filliger, F. Horak Jr., R. Kaiser, S. Medina, V. Puybonnieux-Texier, P. Quenel, J. Schneider, and M. Studnicka. 2000. Economic Evaluation of Health Impacts Due to Road Traffic-Related Air Pollution. An Impact Assessment Project of
Austria, France and Switzerland. Workshop on Assessing the Ancillary Benefits and Costs of Greenhouse Gas Mitigation Strategies, 27-29 March 2000, Washington DC. [Online]. Available: http://www.oecd.org/pdf/M00007000/M00007491.pdf [accessed September 10, 2002].
Surgeon General’s Advisory Committee. 1964. Smoking and Health: Report of Advisory Committee to Surgeon General of the Public Health Service. Public Health Service Publication 1103. U.S. Department of Health, Education, and Welfare, Washington, DC: Government Printing Office.
Susser, M. 1973. Causal Thinking in the Health Sciences: Concepts and Strategies of Epidemiology. New York: Oxford University Press.
Susser, M. 1977. Judgment and causal inference: Criteria in epidemiologic studies. Am. J. Epidemiol. 105(1):1-15.
Susser, M. 1988. Falsification, verification and causal inference in epidemiology: Reconsideration in the light of Sir Karl Popper’s philosophy. Pp. 33-58 in Causal Inference, K.J. Rothman, and S.F. Lines, eds. Chestnut Hill, MA: Epidemiology Resources.
Susser, M. 1991. What is a cause and how do we know one? A grammar for pragmatic epidemiology. Am. J. Epidemiol. 133(7):635-648.
Valberg, P.A., and A.Y. Watson. 1998. Alternative hypotheses linking outdoor particulate matter with daily morbidity and mortality. Inhal. Toxicol. 10(7):641-662.
Vedal, S. 1997. Ambient particles and health: Lines that divide. J. Air Waste Manage. Assoc. 47(5):551-581.
Weed, D.L. 1994. Alcohol, breast cancer, and causal inference: Where ethics meets epidemiology. Contemp. Drug Probl. 21(1):185-204.
Weed, D.L. 1997. On the use of causal criteria. Int. J. Epidemiol. 26(6):1137-1141.
Weed, D.L. and S.D. Hursting. 1998. Biologic plausibility in causal inference: Current method and practice. Am. J. Epidemiol. 147(5):415-425.
Weed, D.L. and L.S. Gorelic. 1996. The practice of causal inference in cancer epidemiology. Cancer Epidemiol. Biomarkers Prev. 5(4):303-311.
WHO (World Health Organization). 2000. Guidelines for Air Quality. Geneva: World Health Organization.
WHO (World Health Organization). 2001. Quantification of the Health Effects of Exposure to Air Pollution: Report of a WHO Working Group. European Centre for Environment and Health, World Health Organization.
Zanobetti, A., and J. Schwartz. 2001. Are diabetics more susceptible to the health effects of airborne particles? Am. J. Respir. Crit. Care Med. 164:831-833.
Zanobetti, A., J. Schwartz, and D. Gold. 2000. Are there sensitive subgroups for the effects of airborne particles? Environ. Health Perspect. 108(9):841-845.
Zanobetti, A., J. Schwartz, E. Samoli, A. Gryparis, G. Touloumi, R. Atkinson, A. Le Tertre, J.Bobros, M.Celko, A.Goren, B.Forsberg, P.Michelozzi, D. Rabczenko, E. Aranguez Ruiz, and K. Katsouyanni. 2002. The temporal pattern
of mortality responses to air pollution: A multicity assessment of mortality displacement. Epidemiology 13(1):87-93.
Zeger, S.L., F. Dominici, and J. Samet. 1999. Harvesting-resistant estimates of pollution effects on mortality. Epidemiology 10(2):171-175.
Zeger, S, F. Dominici, A. McDermott, and J. Samet. In press. Bayesian hierarchical modeling of public health surveillance data: A case study of air pollution and mortality. In Monitoring the Health of Populations: Statistical Principles and Methods for Public Health Surveillance, R. Brookmeyer and D. Stroup, eds. Oxford: Oxford University Press.


