
2
Scope of SESTAT
SESTAT defines scientists and engineers to include both college graduates educated in science and engineering fields and those who work in science and engineering occupations, whether educated in those fields or not. The population of scientists and engineers includes technicians and technologists, researchers, educators, and managers of the science and engineering enterprise (National Science Foundation, 2002; National Research Council, 1989). It totals approximately 12 million individuals, which is about 8 percent of the U.S. labor force. This small group has a disproportional effect on the U.S. economy and particularly on the rapid technological change that characterizes the economy. Consequently, policy makers and researchers within government, industry, and academia need timely information about the numbers and characteristics of scientists and engineers in the United States. Information of interest includes: numbers in each specialty, demographic characteristics and comparisons, numbers entering and leaving different fields, comparison of supply (e.g., numbers of graduates) with demand, matching of education to job, and factors that affect the education and utilization of scientists and engineers (National Science Foundation, 2002; National Research Council, 1989).
In its 1989 report, the National Research Council concluded that NSF should develop and maintain a data system to provide information that permits users to apply their own definitions of the science and engineering population for their particular research and analysis purposes, and that the
system should support analyses of the scientific and engineering community from the perspectives of both occupational employment and academic training (National Research Council, 1989:55-56). NSF describes SESTAT as follows (National Science Foundation, 2002:2):
SESTAT is a comprehensive and integrated system of information about the employment, educational, and demographic characteristics of scientists and engineers in the United States. It comprises data collected through three national sample surveys supported by NSF: the National Survey of College Graduates (NSCG), the National Survey of Recent College Graduates (NSRCG), and the Survey of Doctorate Recipients (SDR). These surveys are conducted biennially; each is administered to a different sample population of bachelor’s and above college degree holders.
THE NATIONAL SURVEY OF COLLEGE GRADUATES
The National Survey of College Graduates (NSCG) was first administered in April 1993 and biennially thereafter, through 1999. The survey covers a nationally representative sample of college degree holders1 who were identified through the 1990 decennial census. The 1993 NSCG was a special baseline survey of a stratified random sample of individuals identified through the census long form. Eligible persons were those who resided in the United States as of April 1990 and held a bachelor’s degree or higher in any field, not necessarily in the sciences or engineering. In 1993, two selected groups from the NSCG were incorporated into the SESTAT database: those with science or engineering (S&E) degrees, and those with non-S&E degrees but who worked in science and engineering occupations during April 1993.
These two populations are collectively referred to as the NSCG S&E panel. In 1995 and subsequent rounds of the survey, these same two groups have been followed (National Science Foundation, 2002; Westat, 2002b).
THE NATIONAL SURVEY OF RECENT COLLEGE GRADUATES
A second survey, the National Survey of Recent College Graduates (NSRCG), is used to incorporate into SESTAT new U.S. S&E degree earners in the 1990s. In 1993, the NSRCG consisted of a sample of individuals who earned new S&E bachelor’s or master’s degrees in the prior three academic years.2 The NSRCG sample is a cluster sample identified through sampling of educational institutions in a first stage, and, in a second stage, sampling bachelor’s degree and master’s degree graduates from within these institutions. The Integrated Postsecondary Education Data System (IPEDS) was used to construct the sampling frame for educational institutions. The data from that system, for more than 9,900 postsecondary institutions, includes types of programs, levels of awards offered, enrollments, and degree completions for various levels.
Biennially since 1995, the previous NSRCG sample cases have been moved into the NSCG sample frame, and a new NSRCG sample has been selected, consisting of individuals who earned new S&E bachelor’s or master’s degrees in the prior 2 academic years.
THE SURVEY OF DOCTORATE RECIPIENTS
A third survey, the Survey of Doctorate Recipients (SDR), initiated during the 1970s, follows a sample of holders of S&E doctorates earned at U.S. institutions throughout their careers, from year of degree award until age 75. Every 2 years, a sample of new S&E doctoral degree earners is added to the SDR from a fourth survey, the Survey of Earned Doctorates (SED). Each SDR sample frame includes all U.S.-earned S&E doctorates through the previous academic year. As new doctorate recipients are added to the panel, the sample of existing participants is dropped to maintain a roughly constant sample size. Table 2-1 presents, for the years 1993 and 1995, the number of cases per survey. Westat (2002b) provides a more detailed description of the surveys that are integrated into the SESTAT, including their sampling techniques and frame sources. Additional detailed information on SESTAT methodology is provided on the SRS SESTAT internet website (http://www.nsf.gov/sbe/srs/stats.htm [September,
TABLE 2-1 Number of Cases by Survey
2002]). Detailed information on IPEDS is available at the website of the Department of Education’s Center for Education Statistics (www.ed.gov [September, 2002]).
TYPES OF INFORMATION CONTAINED IN SESTAT
Table 2-2 lists the degree fields and occupational categories within which more detailed educational and occupational labels are organized.
In addition to the estimated counts of individuals for specific educational and occupational categories, SESTAT contains a wide range of information about scientists and engineers (National Science Foundation, 2002). For the employed, labor force information includes items such as primary occupation and salary, type of employer, supervisory responsibilities, relationship between work and highest degree, typical work activities, licensing and certification prerequisites, and secondary jobs held. For those who are unemployed or not in the labor force during the reference week, labor force information includes items such as job last worked, data of last job, and reasons for not working. Other work-related information includes membership in professional associations and participation in work-related training activities.
TABLE 2-2 Degree Fields and Occupational Categories in SESTAT
|
Major Educational Field and Educational Groups of Disciplines |
Minor Major and Minor Occupational Categories |
|
Science and Engineering |
|
|
Computer and mathematical sciences • Computer and information sciences • Mathematical sciences |
Computer and mathematical scientists • Computer and information scientists • Mathematical scientists • Postsecondary teachers of computer and mathematical sciences |
|
Life and related sciences • Agricultural and food sciences • Biological sciences • Environmental life sciences • Health and related sciences (doctorate only) |
Life and related scientists • Agricultural and food scientists • Biological scientists • Environmental life scientists • Postsecondary teachers of life and related sciences |
|
Physical and related sciences • Chemistry, except biochemistry • Earth sciences, geology, and oceanography • Physics and astronomy • Other physical sciences |
Physical scientists • Chemists, except biochemists • Earth scientists, geologists, and oceanographers • Physicists and astronomers • Other physical scientists • Postsecondary teachers of physical and related sciences |
|
Social and related sciences • Economics • Political and related sciences • Psychology • Sociology and anthropology • Other social sciences |
Social and related scientists • Economists • Political and related scientists • Psychologists • Sociologists and anthropologists • Other social scientists • Postsecondary teachers of social sciences |
|
Engineering • Aerospace and related engineering • Chemical engineering • Civil and architectural engineering • Electrical and related engineering • Industrial engineering • Mechanical engineering • Other engineering |
Engineers • Aerospace and related engineers • Chemical engineers • Civil and architectural engineers • Electrical and related engineers • Industrial engineers • Mechanical engineers • Other engineers • Postsecondary teachers of engineering |
|
Major Educational Field and Minor Educational Groups of Disciplines |
Major and Minor Occupational Categories |
|
Nonscience and Nonengineering |
|
|
Management and administration |
Managers and administrators |
|
Health and related (bachelor’s and master’s only) |
Health-related occupations |
|
Teaching and education |
Teachers, except S&E postsecondary teachers |
|
|
Non-S&E postsecondary teachers |
|
Social service and related |
Social services and related occupations |
|
Technology and technical |
Technologists and technicians |
|
Sales and marketing |
Sales and marketing occupations |
|
Arts, humanities, and related |
Arts, humanities, and related occupations |
|
Other nonscience and nonengineering |
Other nonscience and nonengineering occupations |
|
SOURCE National Science Foundation (2002: Appendix A) |
|
Educational information in SESTAT includes dates awarded a high school diploma and associate degrees; level, field, and date for the first bachelor’s degree and up to the two most recent other degrees; and any continuing education, including postdegree college courses, field of study, and extent of employer financing. The SESTAT surveys also collect information on family characteristics (marital status, spouse’s employment status, children, and parents’ educational attainment) and demographic characteristics (age, gender, race/ethnicity, disability, country of birth, and citizenship type).
In addition, special modules have been conducted to provide more detailed information on labor force status, postdoctoral experience, patent and publication activity, and alternative or temporary work experience.
POPULATION COVERAGE OF THE CURRENT SESTAT SAMPLE FRAME
This section describes limitations in the population coverage of the current SESTAT sample, which is based on the 1990 census and supplements from the NSRCG and SDR.
The current SESTAT definition of scientists and engineers includes two disjointed groups: persons with S&E degrees, no matter what their occupation, and college graduates who do not have S&E degrees but who are working in an S&E occupation. Those working in S&E occupations without bachelor’s degrees (e.g., persons with associate’s degrees in any field) are excluded from the SESTAT population. Figure 2-1 depicts the SESTAT target population. The dashed oval shows the combinations of degree type, labor force status, and S&E occupational status that are included in the SESTAT target population.
Theoretically, the 1993 NSCG can provide complete coverage of the SESTAT population in April 1990, because all members of that population were U.S. residents with college degrees at the time of the 1990 census. However, by 1993, the SESTAT population had grown with the inclusion of four new groups:
-
Graduates with a first bachelor’s degree received in 1990 to 1992, at least one of whose degrees was in an S&E field.
-
Graduates with a first college degree received in 1990 to 1992, with no college degree in an S&E field, but who were employed in an S&E occupation during April 1993.
-
Immigrants since April 1990 with a foreign college degree in an S&E field (and no U.S. degree).
-
Immigrants since April 1990, with one or more foreign college degrees in a non-S&E field, but who were employed in an S&E occupation during April 1993.
The 1993 NSRCG is designed to provide complete coverage of group (1)—recent additions to the population of graduates in an S&E field. However, there is no source available to efficiently sample from groups (2) - (4) over the decade. Consequently, the SESTAT surveys systematically missed those groups.
In subsequent biennial periods, analogous coverage gaps occur. Consequently, the importance of these three omitted groups accumulates over time. In addition, in and after 1995 there was another group that SESTAT systematically failed to capture:
-
Graduates who were eligible for the 1993 NSCG but not SESTAT (i.e., no S&E degree and not employed in an S&E occupation during April 1993) who became employed in an S&E occupation by April 1995.
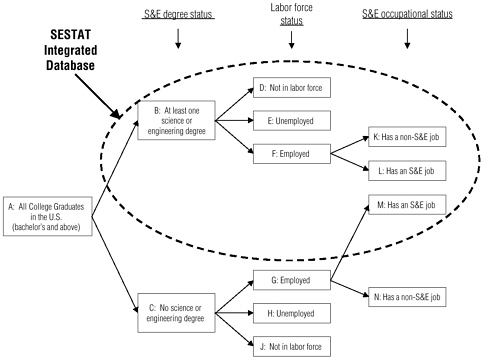
FIGURE 2-1 Schematic of SESTAT population as a function of S&E degree status, labor force status, and S&E occupation status.
SOURCE: National Science Foundation (2002: Figure 1).
Present data do not allow estimation of the size of these noncovered groups with much precision. Almost certainly, group (1)—new graduates with S&E degrees—constituted the majority of additions to the S&E population over the 1990s. However, the noncovered groups may also contribute a substantial portion of the pool. For example, the April 1997 Current Population Survey estimated that 210,000 college graduates working in S&E fields had immigrated into the United States since 1990—6.0 percent of all graduates working in S&E occupations (Westat, 2002c). Although many of those immigrants may have been eligible for the NSRCG, none of those with only foreign degrees would have been covered by SESTAT. Because the majority of the S&E population is not employed in S&E fields, there may be an even larger number of additional post-1990 immigrants with foreign degrees in S&E fields who are not employed in S&E fields.
Survey nonresponse may have an even greater adverse effect than the noncovered groups on the accuracy of estimated characteristics for the S&E population. Table 2-3 summarizes published response rates for the three
SESTAT components. The first column of the table shows response rates for the part of the NSCG sample that SRS attempted to interview. The 78 percent shown for 1993 is the response rate for the initial sample. In subsequent years, SRS contacted only those individuals who had responded in all previous survey waves of the NSCG (or NSRCG, if applicable). Consequently, the NSCG conditional response rates shown for the later years include only respondents from previous cycles. For the last three cycles of conditional rates for NSCG, the unconditional response rates for the initial 1993 NSCG sample (in the second column) are roughly multiplicative.3 For example, the unconditional response rate in 1995 was about 74 percent (78 percent times 95 percent), and it dropped to about 63 percent in 1999. The response rates shown for the NSRCG and SDR are unconditional, reflecting only the sample that was selected for the particular cycle (year).
The 63 percent unconditional response rate for the NSCG sample in 1999 is troubling. SRS weights data from respondents to account for differences between respondents and nonrespondents in characteristics that are known for both groups. However, to the extent that nonrespondents differ in ways that cannot be explained by known characteristics, SESTAT results will be biased. As the proportion of nonrespondents increased over the 1990s, it is likely that the magnitude of any bias also increased. Unfortunately, SRS does not have data that could help to estimate the size of this bias.
TABLE 2-3 Selected Unweighted Response Rates for the SESTAT
|
|
Components (in percent) |
Conditional Response Rate Unconditional Response Rate |
||
|
Year |
NSCG (Reported) |
NSCG (Computed)a |
NSRCG (Reported) |
SDR (Reported) |
|
1993 |
78 |
78 |
84 |
87 |
|
1995 |
95 |
74 |
83 |
85b |
|
1997 |
94 |
70 |
81 |
84 |
|
1999 |
91 |
63 |
79 |
82 |
|
SOURCE: Data from Westat (2002a: Table 1), amended according to personal communication from SRS staff. Notes: See text for discussion. For background information also see design and methodology report on the National Science Foundation SESTAT website (http://srsstats.sbe.nsf.gov/techinfo.html). aThe computed rates for 1995 and later are approximate. The committee acknowledges that these rates are based on assumptions that the committee has not been able to verify. bIn 1995 a subsample of mail nonrespondents was selected for computer-assisted telephone interview (CATI) follow-up. The unweighted response rate using the total sample (including those subsampled out) as the base is 77 percent. The weighted response rate was 85 percent, as shown in the table. |
||||


