
3
Air Emissions
INTRODUCTION
This chapter describes the emissions of concern to the committee, their character as possible pollutants, factors that influence their production and dispersion in the atmosphere, their spatial and temporal dynamics, and their potential impacts. This description of the emissions of concern, along with the preceding section that described the livestock industry that produces them, sets the stage for the remaining chapters.
The focus of this report is on air emissions from animal feeding operations (AFOs). This section outlines some aspects of that issue. First, it discusses the chemical species of interest, with special attention to the contributions of AFOs to the inventories of these species (Table 3-1). Next, the various factors that determine the rates of emissions from individual AFOs are discussed. Following this, the dispersion of these emissions is discussed to provide a framework for understanding the relationship between emissions and atmospheric concentrations. Finally, the committee discusses in somewhat greater detail the potential human health and environmental impacts of air emissions of the key species. It should be noted that the material in this section is not meant to be a comprehensive survey, but rather is designed to highlight certain key issues in terms of air emissions from AFOs. The goal is to set the stage for the more detailed analysis of the scientific basis for estimating air emissions from AFOs in Chapters 4 and 5.
SPECIES OF INTEREST
Ammonia
The nitrogen in animal manure can be converted to ammonia (NH3) by a combination of hydrolysis, mineralization, and volatilization (e.g., Oenema et al.,
TABLE 3-1 Annual Anthropogenic Emissions of Constituents of Concern, 1990a
|
|
NH3 (Tg N) |
N2O (Tg N) |
NOb (Tg N) |
CH4 (Tg C) |
VOCs (Tg mass) |
|||||
|
Global |
U.S. |
Global |
U.S. |
Global |
U.S. |
Global |
U.S. |
Global |
U.S. |
|
|
Energy |
|
|||||||||
|
Fossil fuel combustion + production |
0.1 |
0.0 |
0.2 |
0.1 |
21.2 |
6.7 |
70.1 |
16.3 |
67.3 |
10.2 |
|
Biofuel combustion |
2.2 |
0.2 |
0.1 |
0.0 |
1.3 |
0.1 |
11.5 |
0.3 |
31.6 |
0.9 |
|
Industrial Processes |
0.2 |
0.0 |
0.5 |
0.1 |
1.5 |
0.1 |
0.6 |
0.0 |
55.7 |
12 |
|
Agriculture |
|
|||||||||
|
Agriculture and natural land |
12.6 |
1.0 |
1.0 |
0.1 |
5.2 |
0.4 |
44.4 |
0.4 |
NAc |
NA |
|
Animals |
21.1 |
1.4 |
1.0 |
0.1 |
1.0 |
0.1 |
68.7 |
5.7 |
NA |
NA |
|
Biomass burning |
|
|||||||||
|
Savannah burning |
1.8 |
0.0 |
0.1 |
0.0 |
3.1 |
0.0 |
4.8 |
0.0 |
4.9 |
0.0 |
|
Deforestation |
1.4 |
0.0 |
0.0 |
0.0 |
1.1 |
0.0 |
4.2 |
0.0 |
7.8 |
0.0 |
|
Waste |
|
|||||||||
|
Agriculture waste burning |
1.3 |
0.1 |
0.1 |
0.0 |
2.2 |
0.2 |
8.9 |
0.7 |
13.8 |
1.2 |
|
Landfills |
2.7 |
0.1 |
0.0 |
0.0 |
0.0 |
0.0 |
26.5 |
7.5 |
0.0 |
0.0 |
|
Total |
43 |
3 |
3 |
0.4 |
37 |
8 |
240 |
31 |
181 |
24 |
|
Percent from animals |
48 |
50 |
33 |
25 |
1 |
1 |
19 |
18 |
NA |
NA |
|
a H2S emissions are not available for the level of disaggregation shown for other species, but they are small relative to other S s ources (e.g., SO2 from fossil fuel combustion) on a national and global basis. They might be important on a regional basis in some areas. b Estimates of NO emissions from manure applied to fields vary substantially. Reported values for the fraction of manure nitrogen lost as NO have been as high as 5.4 percent, but 2 percent was chosen as a midrange value. Uncertainty is approximately a factor of two. c VOC emissions are not available for agricultural sources except agricultural waste burning. SOURCE: van Aardenne et al. (2001). |
||||||||||
2001). Urea in the urine of mammals can be hydrolyzed rapidly to ammonia and carbon dioxide by urease enzymes present in feces. On a global scale, animal farming systems emit to the atmosphere ~20 Tg N/yr as NH3 (Galloway and Cowling, 2002), an amount that comprises about 50 percent of total NH3 emissions from terrestrial systems (van Aardenne et al., 2001). Based on gridded emissions documented by van Aardenne et al. (2001), about 3 Tg N/yr was emitted from natural and anthropogenic sources in the United States in the mid-1990s. Emissions from animal waste (1.4 Tg N/yr) accounted for about 50 percent of the total. This figure is similar to the 1.9 Tg N/yr in Figure 1-1 (Howarth et al., 2002) estimated to come from animal emissions.
Once emitted, the NH3 can be converted rapidly to ammonium (NH4+) aerosol by reactions with acidic species (e.g., HNO3 [nitric acid] and H2SO4 [sulfuric acid]) found in ambient aerosols. Gaseous NH3 is removed primarily by dry deposition, while aerosol NH4+ is removed primarily by wet deposition. As an aerosol, NH4+ contributes directly to PM2.5 (particulate matter having an aerodynamic equivalent diameter of 2.5 μm or less) and, once removed, contributes to ecosystem fertilization, acidification, and eutrophication. After NH3 is emitted to the atmosphere, each nitrogen atom can participate in a sequence of effects, known as the nitrogen cascade (see discussion of environmental impacts and Figure 3-2 later in this chapter) in which a molecule of NH3 can, in sequence, impact atmospheric visibility, soil acidity, forest productivity, terrestrial ecosystem biodiversity, stream acidity, and coastal productivity (Galloway and Cowling, 2002). Excess deposition of reactive nitrogen can also decrease the biodiversity of terrestrial ecosystems (NRC, 1997). Since the residence times of NH3 and NH4+ in the atmosphere are on the order of days, a regional-scale perspective is necessary to assess the environmental effects of, and control strategies for, NH3 emissions.
Nitrous Oxide
Nitrous oxide (N2O) forms and is emitted to the atmosphere via the microbial processes of nitrification and denitrification. Global emissions in 1990 were ~15 Tg N/yr (Olivier et al., 1998), of which anthropogenic sources accounted for ~3 Tg N/yr. Of these, N2O emissions from animal excreta accounted for ~1 Tg N/yr (Olivier et al., 1998; van Aardenne et al., 2001). In the United States, total anthropogenic sources in 1990 were ~0.4 Tg N/yr, with animal excreta contributing about 25 percent (Table 3-1) (van Aardenne et al., 2001).
N2O diffuses from the troposphere to the stratosphere, where it is lost to photolysis and other processes. Once emitted, N2O is globally distributed because of its long residence time (~100 years); it contributes to both tropospheric warming and stratospheric ozone depletion. N2O has a global warming potential 296 times that of carbon dioxide (CO2) (IPCC, 2001).
Nitric Oxide
Anthropogenic activities, especially combustion of fossil fuels, account for most of the nitric oxide (NO) released into the atmosphere (van Aardenne et al., 2001). Nitrification in aerobic soils appears to be the dominant agricultural pathway to NO. Direct emissions of NO from livestock and manure are believed to be relatively minor, but a substantial fraction of manure nitrogen applied to soils as fertilizer can be emitted as NO. However, emissions from agricultural systems are discussed briefly as a whole because of the direct link between livestock agriculture and feed-grain agriculture in the United States.
The contribution of soil emissions to the global oxidized nitrogen budget is on the order of 10 percent (Finlayson-Pitts and Pitts, 2000; Seinfeld and Pandis, 1998; Stedman and Schetter, 1983). Where corn is grown extensively, the contribution is much greater, especially in summer; Williams et al. (1992a) estimated that contributions from soils amount to about 26 percent of the emissions from industrial and commercial processes in Illinois, and may dominate emissions in Iowa, Kansas, Minnesota, Nebraska, and South Dakota. The fraction of fertilizer nitrogen released as NO depends on the amount and form of nitrogen (reduced or oxidized) applied to soils, the vegetative cover, temperature, soil moisture, and agricultural practices such as tillage. A small fraction of NH4+ and other reduced nitrogen compounds in animal manure can also be converted to NO by microbial action in soils.
Nitric oxide and nitrogen dioxide (NO2) are rapidly interconverted in the atmosphere and are referred to jointly as NOx. In turn, NOx can be incorporated into organic compounds such as peroxyacetyl nitrate (PAN) or further oxidized to HNO3. Gas-phase HNO3 can be converted to aerosol nitrate (NO3−) (e.g., by reaction with ammonia). The sum of all oxidized nitrogen species (except N2O) in the atmosphere is often referred to as NOy. The residence time of NOy is of the order of days in the lower atmosphere, with the principal removal mechanism involving wet and dry deposition of HNO3 and aerosol NO3−. In terms of environmental effects, NOx is an important (and often limiting) precursor in tropospheric ozone (O3) production. Furthermore, NO3− aerosol is a contributor to PM2.5, and nitrogen deposition in the forms of HNO3, and aerosol NO3− can have ecological consequences as mentioned earlier.
Methane
Methane (CH4) is produced by microbial degradation of organic matter under anaerobic conditions. Total global anthropogenic CH4 is estimated to be 320 Tg CH4/yr (corresponding to 240 Tg C/yr [teragrams of carbon per year]) (van Aardenne et al., 2001), comparable to the total from natural sources (Olivier et al., 2002). Of the various anthropogenic sources, the agricultural sector is the largest, with livestock production being a major component within this sector
(van Aardenne et al., 2001). In the United States, livestock emissions contribute 7.6 Tg CH4/yr (5.7 Tg C/yr) of a total anthropogenic source of 41 Tg CH4/yr (31 Tg C/yr) (van Aardenne et al., 2001).
The primary source of CH4 in livestock production is ruminant animals. Ruminants (sheep, goats, camels, cattle, and buffalo) have unique, four-chambered stomachs. In one chamber, called the rumen, bacteria break down grasses and other feedstuff and generate CH4 as one of several by-products. The production rate of CH4 is affected by energy intake, which is in turn affected by several factors such as quantity and quality of feed, animal body weight, and age, and varies among animal species and among individuals of the same species (Leng, 1993). CH4 is also emitted during anaerobic microbial decomposition of manure (DOE, 2000). The most important factor affecting the amount produced is how the manure is managed, because some types of storage and treatment systems promote an oxygen-depleted (anaerobic) environment. Metabolic processes of methanogens lead to CH4 production at all stages of manure handling. Liquid systems tend to encourage anaerobic conditions and to produce significant quantities of CH4, while more aerobic solid waste management approaches may produce little or none. Higher temperatures and moist conditions also promote CH4 production.
Methane is destroyed in the atmosphere by reaction with the hydroxyl (•OH) radical. Because of its long residence time (~8.4 years), CH4 becomes distributed globally. Methane is a greenhouse gas and contributes to global warming (NRC, 1992); it has a global warming potential 23 times that of CO2 (IPCC, 2001).
Volatile Organic Compounds
Volatile organic compounds (VOCs) vaporize easily at room temperature and include fatty acids, nitrogen heterocycles, sulfides, amines, alcohols, aliphatic aldehydes, ethers, p-cresol, mercaptans, hydrocarbons, and halocarbons. Total emissions of VOCs from all sources in the United States were estimated to be 30.4 Tg/yr in 1970 and 22.3 Tg/yr in 1995 (EPA, 1995a).
The major constituents of AFO VOC emissions that have been identified include organic sulfides, disulfides, C4 to C7 aldehydes, trimethylamine, C4 amines, quinoline, dimethylpyrazine, and C3 to C6 organic acids, along with lesser amounts of aromatic compounds and C4 to C7 alcohols, ketones, and aliphatic hydrocarbons.
Hydrogen Sulfide
Hydrogen sulfide (H2S) is produced in anaerobic environments from the microbial reduction of sulfate in water and the decomposition of sulfur-containing organic matter in manure. On a global basis, 0.4-5.6 Tg S/yr of reduced sulfur
gases (mostly H2S and dimethyl sulfide) are emitted from land and sea biota (Penner et al., 2001). Most atmospheric H2S is oxidized to sulfur dioxide (SO2), which is then either dry deposited or oxidized to aerosol sulfate and removed primarily by wet deposition. The residence time of H2S and its reaction products is of the order of days.
The short lifetime of H2S, coupled with the fact that H2S emissions from AFOs on a global (Schnoor et al., 2002) and national (NAPAP, 1990) basis are small relative to other atmospheric sulfur sources (e.g., soils, volcanoes, wetlands, fossil fuel combustion), means that H2S emissions from AFOs contribute relatively little to ecosystem effects. However, it appears that H2S emissions on a regional basis could be important contributors to the sulfur burden of the atmosphere for those regions with a high density of AFOs and few other sources. Emission inventories of H2S for these regions are necessary to explore this issue further. H2S may also have local effects of concern, especially odor.
Particulate Matter
In this report, the committee considers particulate matter as PM10 and PM2.5. PM10 is commonly defined as airborne particles with aerodynamic equivalent diameters (AEDs) less than 10 μm. The number refers to the 50 percent cut diameter in a Federal Reference Method PM10 sampler where particles of 10 μm AED are collected at 50 percent efficiency (62 Fed. Reg. 38651-38701). Similarly, PM2.5 refers to the particles that are collected in a Federal Reference Method PM2.5 sampler, which has a 50 percent cut diameter of 2.5 μm (62 Fed. Reg. 38651-38701). The classification is important from the perspective of this report because of the manner in which PM is regulated (see Chapter 6).
AFOs can contribute directly to primary PM through several mechanisms, including animal activity, animal housing fans, and air entrainment of mineral and organic material from soil, manure, and water droplets generated by high-pressure liquid sprays, and they can contribute indirectly to secondary PM by emissions of NH3, NO, and H2S, which are converted to aerosols through reactions in the atmosphere. Particles produced by gas-to-particle conversion generally are small and fall into the PM2.5 size range. Key variables affecting the emissions of PM10 from feedlots include the amount of mechanical and animal activity on the soil-manure surface, the moisture content of the surface, and the fraction of the surface material in the 0-10 μm size range.
The AED of PM is critical to its health and radiative effects. PM2.5 can reach and be deposited in the smallest airways (alveoli) in the lungs, whereas larger particles tend to be deposited in the upper airways of the respiratory tract (NRC, 2002b). Smaller particles are also most effective in attenuating visible radiation, causing regional haze.
Odor
Odor from AFOs is not caused by a single species but is rather the result of a large number of contributing compounds (including NH3, VOCs, and H2S), Schiffman et al. (2001) identified 331 odor-causing compounds in swine manure. A further complication is that odor involves a subjective human response. Though research is under way to relate olfactory response to individual odorous gases, odor measurement using human panels appears to be the method of choice now and for some time to come. Since odor can be caused by hundreds of compounds and is subjective in human response, estimates of national or global odor inventories are not currently possible. Odor is a common source of complaints from people living near AFOs, and it is for local impacts that odor has to be quantified.
Two methods are reported in the literature for how to define odor intensity. A standard developed and used in Europe (European Committee for Standardization, 2002) defines odor unit (OU) as the mass of a mixture of odorants in 1 m3 of air at the odor detection threshold (ODT)—the concentration of a mixture that can be detected by 50 percent of a panel. The standard further defines the odor concentration of a sample as the number of OUs in 1 m3 of sample, which is numerically equivalent to the dilution ratio required to dilute the sample to the ODT. Others define OU as a unitless odor concentration, which is numerically equivalent to the numerical factor by which an air sample must be diluted until the odor reaches the ODT.
Other Substances
During the course of this study, the committee was informed through its scientific sessions and public forums of other potential substances (e.g., bioaerosols, pesticides, and carbon disulfide emitted through the air from AFOs) that should be considered for this final report. The committee was also informed by sponsors of their priority for the committee to report on those substances (NH3, H2S, N2O, VOCs, PM, and odor) listed in the Statement of Task (Appendix A). In the interim report, the committee reached a consensus to add NO to this list.
As the committee deliberated its final report, consideration was given to the availability of information on other substances, the Statement of Task, sponsors’ priorities, and the time available to meet sponsors’ needs. Although the committee might have liked to explore these other substances, it did not do so because of those considerations. Likely, much less scientific information exists on measurement protocols and the importance of AFOs in the emission of other substances; however a lack of discussion in this report should not be construed as an indication of a lack of their potential importance. A brief discussion has been included on bioaerosols (Appendix C).
FACTORS AFFECTING AIR EMISSIONS
Climatic and Geographic Differences
Differences in climate influence emissions from AFOs because of differences in temperature, rainfall frequency and intensity, wind speed, topography, and soils. Increases in mean ambient temperature and moisture are expected to increase gaseous emission rates from several components of AFOs, including manure storage and land to which manure has been applied. Averaging reported emission factors does not remove the effects of these climate factors, especially if the emission factors selected were determined mostly in one climatic region of the country. This bias remains when emission factors for one type of animal are applied to others by adjustments to reflect differences in excretion rates.
Differences in emissions from AFOs may also arise because of other geographic differences, such as availability of land for manure or lagoon effluent utilization, rates of evapotranspiration, and differences in soil texture and drainage that can impact application rates of lagoon water, or differences in soil microenvironments that affect microbial action and the resulting gaseous emissions. The breed of a given animal species (e.g., selected for cold or heat tolerance) and feed formulations (because of changes in animal maintenance requirements) may also vary in response to geographic and climatic differences.
It is difficult to project how these various sources of uncertainty will combine to influence gaseous emissions and whether these factors will have significant impacts on percentages of nitrogen, carbon, or sulfur lost in gaseous species averaged over a year’s time. Climatic differences do not negate the mass balance flows of elements through AFOs (as discussed in Chapter 5), so that, unless there is a significant change in storage of an element within the manure management system, changes in total emissions (to air and water) can come about only because of changes in excretion resulting from changes in feed formulation or efficiency of animal nutrient utilization. Differences may not be as important for annual emissions of major gaseous species (e.g., NH3, CH4) as for shorter-term emissions of PM and odors.
Hourly, Daily, and Seasonal Changes
Changes in emissions from individual AFOs due to hourly, daily, and seasonal variations are discussed here because measurements to characterize emissions have usually been conducted for short periods of time. Failure to account for short-term cycles in an experimental design could result in significant systematic errors in a derived annual emission factor. Table 3-2 illustrates seasonal variations in ammonia emission fluxes (mass/area-time) from primary anaerobic swine lagoons. Within one study (Harper et al., 2000), there is as much as a 12.5-fold variation in measured ammonia flux during one summer season. While some of
TABLE 3-2 Measured Emission Fluxes of Ammonia from Primary Anaerobic Swine Lagoons as a Function of Measurement Method and Period
|
Measurement Methoda |
Period |
TANb (mg/L) |
Emission Fluxc(kg NH3-N/ha-d) |
Reference |
|
Micromet. |
August-October |
917-935 |
73-156d |
Zahn et al. (2001) |
|
Micromet. |
Summer |
230-238 |
3.2-40 |
Harper et al. (2000) |
|
Micromet. |
Winter |
239-269 |
1.3-1.9 |
Harper et al. (2000) |
|
Micromet. |
Spring |
278-298 |
3.1-9.8 |
Harper et al. (2000) |
|
Micromet. |
August |
574 |
15.4-22 |
Harper and Sharpe (1998) |
|
Micromet. |
January |
538 |
4.7-12.1 |
Harper and Sharpe (1998) |
|
Micromet. |
May |
741 |
5.2-15.4 |
Harper and Sharpe (1998) |
|
Micromet. |
Summer |
193 |
2.9-8.4 |
Harper and Sharpe (1998) |
|
Micromet. |
Winter |
183 |
6.0-9.1 |
Harper and Sharpe (1998) |
|
Micromet. |
Spring |
227 |
3.0-6.6 |
Harper and Sharpe (1998) |
|
Chamber |
August |
587-695 |
34-123 |
Aneja et al. (2000) |
|
Chamber |
December |
599-715 |
5.3-28 |
Aneja et al. (2000) |
|
Chamber |
February |
580-727 |
1.3-10 |
Aneja et al. (2000) |
|
Chamber |
May |
540-720 |
12.3-52 |
Aneja et al. (2000) |
|
TG OP-FTIR |
May |
— |
37-122 |
Todd et al. (2001) |
|
TG OP-FTIR |
November |
— |
7.8-67.6 |
Todd et al. (2001) |
|
Chamber |
September |
101-110 |
0.57-3.5 |
Aneja et al. (2001) |
|
Chamber |
November |
350 |
0.46-1.73 |
Aneja et al. (2001) |
|
Chamber |
February-March |
543-560 |
0.72-5.39 |
Aneja et al. (2001) |
|
Chamber |
March |
709-909 |
0.82-2.95 |
Aneja et al. (2001) |
|
Chamber |
April-July |
978-1143 |
104 |
Heber et al. (2001) |
|
Chamber |
May-July |
326-387 |
39 |
Heber et al. (2001) |
|
aMicromet. = micrometeorological; Chamber = dynamic flow-through chamber; TG OP-FTIR = tracer gas open path Fourier transform infrared spectroscopy. bTAN = total ammoniacal nitrogen concentration (milligrams per liter), except for the Aneja et al. (2000) entries, which are for TKN (total Kjeldahl nitrogen) because TAN was not available. TAN is typically 45-95% of TKN. cEmission fluxes are in kilograms of nitrogen as NH3 per hectare per day. dHalf of the lagoon was covered and half was uncovered; the lower numbers were measured from the covered half. SOURCE: Data are from Arogo et al. (2001, Tables 9 and 10). Lagoon surface areas varied from 0.39 to 3.07 ha. |
||||
the variability in fluxes in the table is probably due to variability in temperatures and pH, there is little information in the scientific literature to suggest what other factors are important.
AFOs are essentially collections of different biological systems—each operating with its own hourly, daily, and seasonal cycles. At the scale of the individual animal, there are daily cycles in the activities of eating, defecating, and
moving about (the latter is particularly important for generating PM from cattle feedlots). Some microbial cycles that produce emissions may be closely tied to animal activity through the amount and frequency of defecation. As an animal grows, the amount and composition of its feed intake change, as do the amount and composition of its manure (NRC, 1994, 1998a, 2000, 2001a). This gives rise to corresponding changes in microbial activity and emissions. Lactating animals experience changes in productivity throughout their natural cycle, with changes in feed consumed and nutrients excreted (NRC, 1998a, 2000, 2001a). Although the capacity of an AFO may remain essentially constant, different numbers of animals may occupy this space during the year, depending on the production cycle used. Thus, the cycling of animals through an AFO is another source of variation in emissions.
Upsets in the daily rhythms of animals may result in changes in feed ingested and nutrients excreted, and may last for a period of several days. Such upsets may occur due to illness, drastic short-term changes in weather, or breakdowns of farm equipment. Depending on the manure management system employed, such event-driven changes may not have significant effects in terms of emissions of NH3 or CH4 but may have a major impact on other emitted species such as VOCs and PM. Other event-driven processes that can increase emissions include lagoon turnover, flush cycles for housing units, manure scraping at feedlots, and land application of lagoon liquids (EPA, 2001a).
The impact of daily cycles and upsets on estimates of annual emissions may not be important, provided a sufficient number of observations are made to account for them. However, given the current paucity of emissions data for the development of emission factors for AFOs, it is not possible to determine to what extent such cycles and upsets may have affected published emission measurements. As discussed in the interim report, (NRC, 2002a, Chapter 2), averaging does not compensate for the systematic bias that may be present as a result of the failure of an experimental design to account adequately for such events.
Animal Life Stage
Reference has already been made to changes in feed formulations that occur during the life cycles of most animals produced at AFOs and their subsequent effects on the amount and composition of fecal matter and urine excreted (NRC, 1994, 1998a, 2000, 2001a). Figure 3-1 (NRC, 2002a) provides an example of changes in the rate of nitrogen excreted for “grow-finish” swine produced at AFOs in the southeastern United States. The data are based on a growth model (ARC, 1981) used by a commercial swine producer to adjust feed formulations. Data have been normalized to 100 percent for the highest rate of nitrogen excretion to prevent the disclosure of proprietary information. Additional examples of nitrogen excretion across species in varying stages of growth and production are provided in Appendix D.
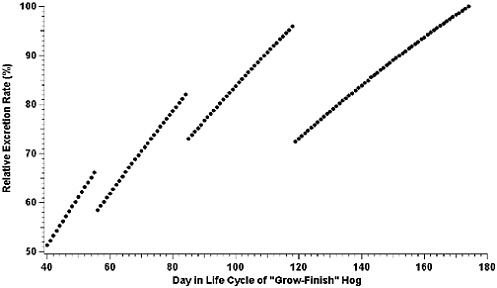
FIGURE 3-1 Relative excretion rate of nitrogen versus day in the life cycle of a grow-finish hog at a commercial swine production facility in the southeastern United States. Animals attain the designation of grow-finish hog at approximately day 40 in their life cycle and are finished at about day 174.
As expected, the relative amount of nitrogen excreted daily tends to increase as the pig grows, reflecting changes in the daily total nitrogen consumed. The actual feed formulation is changed four times during the growth cycle of the hog to account for changes in nitrogen required for maintenance and growth. Sharp decreases in the relative amount of nitrogen excreted per day when the formulation changes are not simply an artifact of the model, but reflect periods of adjustment by the animal to the changes in feed composition. Overall, there is a series of curvilinear increases in the amount of nitrogen excreted per day for finishing swine under this model, with nitrogen excretion nearly doubling during the latter half of the animal’s growth period. The emphasis in Figure 3-1 is on total nitrogen excreted. Expressed as a percentage of body weight, the nitrogen excreted would actually decrease throughout the life cycle.
Figure 3-1 illustrates that if daily housing emissions of NH3 are directly related to daily nitrogen excretion, and the model is an accurate representation of nitrogen excretion, there will not be a simple increase in emissions from the confinement unit with time. Thus, averaging together emission measurements made from several different housing units with different age animals, or from the same housing unit during different times in one growth cycle, may significantly under-or overestimate emissions, depending on the age of the animals when samples are taken. Actual emissions, however, will also depend on the manure collection prac-
tices (flush frequency, pit recharge, pull plug, or pit storage) associated with the confinement unit. A manure collection practice that accumulates manure for relatively long periods of time, such as pit storage, may act to smooth the variations in nitrogen emissions due to variations in daily excretion. At a minimum, the data displayed in Figure 3-1 demonstrate that the same sampling scheme may not be applicable to all swine confinement units and that measurements of emissions may have to be weighted to account for differences in animal age.
Management
Optimal management is vital to the success of individual AFOs for the production of quality animals and should also result in decreased emissions. For example, appropriate drainage and manure removal minimize PM generation from cattle feedlots (Sweeten et al., 1998). Effects of animal health on feeding habits are important to maintain consistent nutrient uptake efficiency and prevent feed spoilage. This attention includes maintenance of proper ventilation for animals in confined housing units, maintenance of drainage systems to remove manure on a frequent basis, and regular (perhaps daily) visual inspection of animals and their daily routines. Adherence to nutrient management plans will decrease the potential for excessive air emissions or surface runoff that results from overapplication of nutrients to crops. Anaerobic lagoons should not exceed design-loading rates and should be maintained in the proper pH range for waste stabilization.
Quantitatively assessing the overall impact of effective management on decreasing emissions is currently not possible due to the paucity of emissions data. However, management practices should be included in assessing emissions from individual AFOs. A summary of milk production for 372 dairy farms in the Mid-Atlantic region of the United States (Jonker et al., 2002; Table 3-3) demonstrates the effects that management practices can have on nitrogen utilization efficiency (NUE). Each management practice has its own distinct effect on milk production and NUE. Feeding a total mixed ration increased milk production by 6.6 percent with no significant change in NUE. Use of bovine somatotropin resulted in a significant increase in both milk production and NUE, thereby decreasing the amount of nitrogen excreted per unit of production. While farms that practiced seasonal calving had significantly lower milk production, NUE was unchanged.
Roles of Microorganisms in Emission Rates
Microbes play important roles in the generation of gases emitted at various stages in animal production systems. Microbial activity is primarily responsible for degradation of feed, generation of methane by ruminants, and conversion of animal waste to produce pollutant gas emissions from housing, storage, and land to which manure is applied.
TABLE 3-3 Relationship of Management Practices on 4 Percent Fat Corrected Milk and Nitrogen Utilization Efficiency
|
Management Practice |
4% Fat Corrected Milk (% change)a |
Nitrogen Utilization Efficiency (% change)a |
|
Total mixed ration |
6.6b |
−1.4 |
|
DHIA memberc |
10.7b |
4.4d |
|
BSTe |
14.1b |
6.9b |
|
3× milkingf |
9.9b |
5.3 |
|
Extended photoperiod |
11.3b |
4.3d |
|
Seasonal calving |
−15.1b |
−1.4 |
|
Cover crops |
0.4 |
2.1 |
|
Nitrogen nutrient management plan |
−0.7 |
0.0 |
|
MUN testingg |
6.9b |
2.5 |
|
Complete feedh |
−6.3b |
−5.6b |
|
aPercent change from using versus not using the management practice. bP <.01. Probability that the use of the technology is actually different than not using the technology. cDairy Herd Improvement Association membership with routine monitoring for milk production. dP <.05. Probability that the use of the technology is actually different than not using the technology. eBovine somatotropin. fMilking cows three times compared to twice daily. gMilk urea nitrogen (MUN) can be used to assess diet adequacy for lactating dairy cattle (Jonker et al., 1999). hComplete feeds are grain mixtures manufactured for use on multiple farms compared to custom grain mixes used on an individual farm. SOURCE: Data derived from Jonker et al. (2002, Table 8). |
||
Ruminant livestock, such as cattle, have a digestive system that allows them to eat coarse plant material that humans and other animals cannot digest. This makes it possible to obtain food from land that is not suitable for crop production by having livestock harvest forage and convert it to milk and/or meat. The unique digestive system of a ruminant animal consists of a four-part stomach, which includes the rumen, reticulum, omasum, and abomasum. The rumen is the first and largest compartment, making up about 80 percent of the total stomach volume, and is unique to ruminant animals. In it, microbial organisms such as bacteria, protozoa, and fungi break down and ferment plant material into products that the animal can use for energy.
Methanogenic bacteria, located mainly in the rumen, are responsible for the methane produced in the animal’s digestive tract as fibrous materials in feed are broken down. Since methane production results from this action, diets that are high in forages (relative to concentrates) will produce more methane. The use of ionophores in feed (dairy cattle are excluded) causes a temporary decrease in
methane production by suppressing methanogenic bacteria in the rumen. Although this effect is temporary (as bacteria become resistant to the effects of the ionophore), ionophores do serve to increase the efficiency of feed utilization.
DISPERSION OF AIR EMISSIONS—METEOROLOGICAL CONSIDERATIONS
Temporal Dynamics
An atmospheric substance can be characterized by its lifetime (also called its residence time) in the atmosphere—defined as the time required (in the absence of sources) to decrease its concentration to 1/e (where e is the base of the system of natural logarithms; 1/e is approximately 0.37) of the initial concentration. The chemical species of interest in air emissions from AFOs span a wide range of lifetimes. Soluble species (i.e., NH3, some VOCs) have lifetimes equivalent to those of water in the atmosphere, about 1 to 10 days, depending on precipitation. Reactive species such as NO and H2S have lifetimes on the order of days or less before they are oxidized to other more water-soluble species such as nitric and sulfuric acids. The lifetimes of VOCs are controlled by the rates of hydroxyl radical attack and water solubility, and range from hours to months. Methane has a much longer lifetime of about 8.4 years. N2O is removed by ultraviolet (UV) photolysis and attack by O(1D), which is an electronically excited oxygen atom generated in the stratosphere by O3 photolysis at wavelengths less than 320 nm. N2O has a lifetime of about 100 years and is essentially inert in the troposphere.
Lifetimes vary with location and time. In the planetary boundary layer (PBL)—that part of the atmosphere interacting directly with the surface of the earth and extending to about 2 km—lifetimes tend to be short; below a temperature inversion, dry deposition can rapidly remove reactive species such as NH3. Table 3-4 summarizes typical lifetimes in the PBL for species of interest in this report.
Above the PBL, in the troposphere where wind speeds are higher, temperatures lower, and precipitation is less frequent, the lifetime and range of a pollutant may be much greater. Convection transports short-lived chemicals from the PBL to the free troposphere, where they are diluted by turbulent mixing and diffusion. For key atmospheric species involved in nonlinear processes, such as NO and cloud condensation nuclei (CCN), convection can transform local air pollution problems into regional or global problems.
Spatial Dynamics
Concentrations in the atmosphere depend on the rates and spatial extents of emissions at the surface and on transport, mixing, and reaction in the lower atmosphere. Micrometeorological tools are being developed to support both forward
TABLE 3-4 Typical Lifetimes in the Planetary Boundary Layer for Pollutants Emitted from Animal Feeding Operations
|
Species |
Lifetime |
|
NH3 |
~1-10 days |
|
N2O |
100 years |
|
NO |
~1 day |
|
CH4 |
8.4 years |
|
VOCs |
Hours to months, depending on the compound |
|
H2S |
~1 day |
|
PM |
1-10 days, depending on particle size and composition |
|
Odora |
— |
|
aOdor, which results from a mixture of NH3, VOCs, and H2S, is an olfactory response to what is often a complex mixture of compounds; it decreases with time after an emission event in response to dispersion (dilution), deposition, and chemical reactions. |
|
calculations, where given emission rates are used to estimate downwind concentration fields, and inverse calculations, where measured concentration fields are used to estimate emission rates. In either of these approaches, the tools must account for the characteristics of the surface and their effects on the flow field, and the effects of regional meteorology. The magnitude of surface roughness, in concert with large-scale pressure gradients, affects the vertical mixing in the lower atmosphere (i.e., dispersion), and the spatial variability of roughness affects the geometry of the mean wind field (i.e., the trajectory of plumes). The strength of surface heating affects the stability of the air column, with convective (unstable) conditions leading to enhanced vertical mixing and temperature inversion (stable) conditions leading to inhibited vertical mixing. From considerations of the effects of PBL stability on the vigor of mixing, it is clear that extreme local pollution episodes generally occur under conditions that combine low horizontal wind speeds—as is often the case when a high-pressure ridge dominates the synoptic-scale weather—with relatively stable temperature profiles (e.g., cooler surface temperatures with warmer air aloft). This results in slow advection horizontally from the source and inhibited mixing vertically, contributing to high surface concentrations (with the emitted mass spread over a relatively small volume of air). A strong temperature inversion (temperature increasing rapidly with elevation) also prevents transport of pollutants to the free troposphere. Consequently, local concentrations are generally highest when ground-level inversions are strongest. A variety of processes, including subsidence, radiation, and advection, can cause inversions. Local orographic conditions, such as lying in a valley, can exacerbate inversions and dictate the wind fields. A detailed discussion is beyond the scope of this report. (A discussion of meteorological effects on concentrations of carbon monoxide, which results mostly from vehicle emissions, can be found in NRC, 2002d.)
Gaussian dispersion models, as commonly used in a regulatory context, have the advantage of providing simple analytical results. However, these models rely on a suite of restrictive conditions that severely limit their robustness under real-field conditions. The transport and mixing from agricultural production facilities are complicated by complex land surface features and transient meteorological conditions. Specifically, the manner in which the patterns of surface roughness, topography, and heating control the trajectory and dispersion of concentration plumes is not captured by these types of models. Observations have demonstrated the failures. Thus, inverse modeling approaches (in which atmospheric concentration measurements are used to estimate the underlying emissions) based on Gaussian models are of limited use in the context of estimating emissions from AFOs.
Progress is being made with a combination of field measurements and Eulerian modeling approaches. Complex landscapes lead to complex solution spaces, thus dictating the need for longer-term observations to characterize the transport-mixing and to identify its controls. Moreover, there is need for increased effort with multidimensional observations, such as with scanning lidar (light detection and ranging) that can characterize evolving plume geometries. (A lidar is a device similar to radar except that it emits pulsed laser light rather than microwaves.) These data sets provide the basis for the construction and testing of multiscale Eulerian modeling frameworks; coarse Eulerian mesoscale models provide regional meteorological forcing and finer scale nested Eulerian models predict plume characteristics over local surface features. However, there has not been a widespread use of these advanced modeling techniques in the AFO regulatory context.
The complexities of the various kinds of air emissions and the temporal and spatial scales of their distribution make direct emission measurements at the individual AFO level generally impractical and cost prohibitive other than in a research setting. Relatively straightforward methods for measuring emission rates by measuring airflow rates and the concentrations of emitted substances are often not available. Flow rates and pollutant concentrations may be available for confined animal housing with forced ventilation, but usually not for emissions from lagoons or soils. An increased research effort on measurement technologies and three-dimensional modeling for flow and transport over complex terrain, with a further focus on stable PBL conditions, is needed to close the gap between the available tools (which presently include restrictive idealized assumptions) and field situations of interest.
POTENTIAL IMPACTS
This section of the report addresses the environmental and human health impacts of materials emitted from AFOs. The impacts occur on a variety of scales, depending on the species (Table ES-1).
Health Effects
Air emissions from AFOs beyond the property line are partly of concern because of their possible effects on human health. The human health effects of the various substances vary with exposure (concentration × time) of humans. The health effects of the substances noted in the following text are based on known levels of exposure; however, there is little scientific evidence that exposures of humans outside the AFOs themselves have significant effects on human health because the concentrations are usually below threshold levels. This may not be the case within the boundary of the AFO and especially in enclosed animal housing. Most of the concern with possible health effects of air emissions from AFOs focuses on ammonia, hydrogen sulfide, and particulate matter. Odor is also discussed in this section because hydrogen sulfide is an important odor-causing substance. Although the evidence of human health effects outside of AFOs is limited, the committee believes additional research may be warranted.
Ammonia
The health effects of ammonia have long been recognized, and the scientific literature on them is extensive. The most recent toxicologic profile for ammonia, published in 1990 by the Agency for Toxic Substances and Disease Registry (ATSDR) of the Centers for Disease Control and Prevention, summarized the human health effects of inhalation (see Tables 3-5 and 3-6). (Ingestion and dermal exposure were also considered, but are not relevant here.) Effects are listed at the lowest concentration at which they were observed.
Ammonia has a strong, sharp, characteristic odor that many people find objectionable. The odor is generally detectable at concentrations greater than 50 parts per million (ppm), so harmful exposures are likely to be detected early enough for the exposed person to take evasive action. Tables 3-5 and 3-6 show that there is little likelihood of even minimal health effects of long-term exposure to ammonia at concentrations less than 0.3 ppm, and that even concentrations up
TABLE 3-5 Short-Term Exposurea to Ammonia
TABLE 3-6 Long-term Exposurea to Ammonia
|
Concentration (ppm) |
Length of Exposure |
Description of Effects |
|
0.3 |
|
Minimal risk level |
|
100 |
6 weeks |
Irritation of eyes, nose, and throat |
|
aMore than 14 days. |
||
to 50 ppm for a day do not have serious health consequences. Ammonia is also a precursor to secondary ammonium nitrate aerosol, whose health effects are discussed below.
Hydrogen Sulfide
Hydrogen sulfide is a colorless gas with a strong and generally objectionable rotten egg odor, detectable at concentrations down to 0.5 parts per billion (ppb). Paradoxically, most people cannot smell H2S at concentrations greater than 100 ppm. Most of the data on H2S toxicity are in the form of no observed adverse effects levels (NOAEL) or lowest observed adverse effect levels (LOAEL). These are, respectively, the highest concentrations at which no adverse effects were noted in the populations examined and the lowest concentrations at which such effects were in fact observed. A threshold of sorts may be presumed to exist at some point between these two exposure concentrations for a specific outcome in the population studied. Whether that threshold is well determined and whether it applies to other populations are generally matters of scientific judgment.
The toxicologic profile of H2S is described below. ATSDR (1999) summarized the relationships between exposure and health outcomes as follows; data are for humans unless otherwise noted:
Acute Effects
Death. Human studies were not reported, but mortality was 100 percent in small groups of rats exposed for 3 minutes to 1655 ppm, 12 minutes to 800 ppm (males), or 4 hours to 500-700 ppm (males). The LD-50 (the dose for 50 percent mortality) was estimated to be 587 ppm for rats exposed for two hours or 335 ppm for six hours.
Respiratory, Cardiovascular, and Metabolic Effects. The NOAEL for humans ranged from 2 to 10 ppm for one exposure of 15 minutes to two exposures of 30 minutes each.
Immunological Effects. The NOAEL was 50 ppm for rats exposed for four hours.
Neurological Effects. Headaches were reported in 3 of 10 asthmatics exposed to 2 ppm H2S for 30 minutes. Biochemical changes were found in the
brains of guinea pigs exposed to 20 ppm for one hour per day for 11 days, although the NOAEL for impaired performance in rats was 100 ppm for two hours.
Chronic Effects
No human studies were reported, and no animal studies reported on deaths from longer exposure. The NOAEL for exposures up to 90 days seemed to be 80 ppm for most systemic end points in rats and mice, and 8.5 ppm in pigs.
Particulate Matter
Particles are highly complex in terms of size, physical properties, and composition, and there may be important synergistic effects with gases in the air. Particles—PM10 and especially PM2.5—have been linked to health effects found on at least two time scales (Schwartz, 1994). Populations with long-term exposure to heavier loads of particles have higher rates of both total mortality and mortality from major cardiovascular diseases, as well as increased rates of morbidity, expressed primarily as hospital admissions. The magnitude of the effect varies with location and may not be present in every population. A second type of effect, seen in time series studies within a single population, is short-term correlation of PM concentrations with mortality and morbidity, generally within 0-3 days of exposure to above-average concentrations.
Most observers are convinced that these correlations reflect cause and effect rather than the effects of co-pollutants and other confounders, but many also believe that it is not just the particulate nature of the particles that does the damage. Damage seems to be most intense with the smallest particles (less than 2.5 μm or PM2.5), which can be composed of elemental carbon, adsorbed complex organic molecules, heavy metals, bioaerosols, acid aerosols, ammonium nitrate, and other materials. Substantial research interest is now directed at elucidating the aspects of PM that cause various health effects. It is by no means clear that the hazards of rural PM can be inferred from research focused on urban PM.
Odor and VOCs
Many of the complaints about AFOs are generated by odor. As classes of compounds, odor and VOCs can be considered together. In terms of their health and environmental effects, some of the VOCs may irritate the skin, eyes, nose, and throat. They can also be precursors to the formation of tropospheric ozone and PM2.5. Odorous VOCs can stimulate sensory nerves to cause neurochemical changes that might influence health by compromising the immune system. However, the effects of air emissions from AFOs on public health are not fully understood or well studied. Greater mood disturbance (Schiffman et al., 1995) and increased rates of headaches, runny nose, sore throat, excessive coughing, diarrhea, and burning eyes have been reported by persons living near swine opera-
tions in North Carolina (Wing and Wolf, 2000). Thu et al. (1997) observed similarities between the pattern of symptoms among community residents living near large swine operations and those experienced by workers. Caution must be exercised in interpreting the studies because environmental exposure data were not reported.
Environmental Impacts
The environmental impacts of the nitrogen-, carbon-, and sulfur-containing species emitted from AFOs are well known and thus are reviewed only briefly here. Nitrous oxide and methane are radiatively active and contribute to the greenhouse effect in the troposphere (IPCC, 2001; NRC, 2001b). Some VOCs participate in atmospheric photochemical reactions, while others play an important role as heat-trapping gases (King, 1995). A large portion of N2O is transferred to the stratosphere where it has the potential to contribute to stratospheric ozone depletion. Nitric oxide and ammonia also have environmental impacts. Nitric oxide contributes to increased concentrations of O3 in the troposphere and can result in decreased productivity of crops and terrestrial ecosystems (Ollinger et al., 2002). Ammonia in the atmosphere can react with sulfuric and nitric acids to form ammonium sulfate and nitrate aerosols. It plays an important role in the direct and indirect effects of aerosols on radiative forcing and thus global climate change (Seinfeld and Pandis, 1998; Penner et al., 2001).
In addition to these effects of emitted NO and NH3, both species also contribute to a wide variety of other environmental impacts as they are converted to other chemical species and cycle through environmental reservoirs. Referred to as the “nitrogen cascade,” the sequential transfer of reactive nitrogen through environmental systems results in environmental changes as nitrogen moves through each system or is temporarily stored (Galloway and Cowling, 2002). The cascade is illustrated in Figure 3-2.
Nitrogen is converted by human activity from molecular nitrogen (N2) to reactive NOx and NHx (NHx is used here to mean the total of NH3 and NH4+). New NOx is produced primarily by combustion processes (energy production), while NH3 is produced by the Haber-Bosch process to make fertilizer used to increase food production. About half of the nitrogen in fertilizer applied to global agroecosystems is incorporated into crops and used for human and livestock consumption (Smil, 1999, 2001); the other half is transferred to the atmosphere as NH3, NO, N2O, or N2 or lost to aquatic ecosystems, primarily as nitrate. Ammonia from agroecosystems can follow a variety of pathways, resulting in a sequential series of impacts; the same is true for NOx. In sequence, an atom of nitrogen (in NOx) can first increase tropospheric ozone, then produce small particles that decrease atmospheric visibility, and then increase acidity in precipitation. Following deposition to terrestrial ecosystems, that same nitrogen atom can increase soil acidity, decrease biodiversity, and increase or decrease ecosystem productiv-
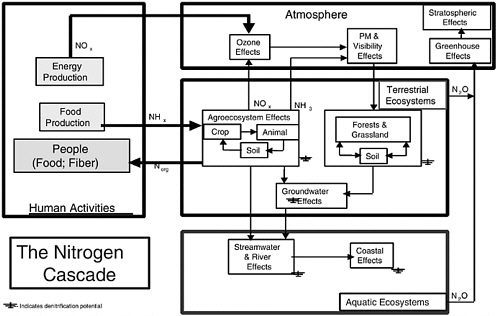
ity. If discharged to aquatic ecosystems, it can increase surface water acidity and lead to coastal eutrophication. If the nitrogen atom is converted to N2O and emitted back to the atmosphere, it can first increase greenhouse warming and then deplete stratospheric ozone. As Figure 3-2 illustrates, an atom of reactive nitrogen (Nr), can enter the cascade at different places. An important characteristic of the cascade is that once an Nr atom enters, its source (e.g., fossil fuel combustion, fertilizer production) becomes irrelevant—except for different types of control strategies that may be employed.
The emissions of H2S from AFOs generally make a minor contribution to the sulfur burden of the atmosphere relative to the SO2 from the burning of fossil fuels. Where there are few other sulfur sources however, H2S can contribute significantly to the PM2.5 burden.
Particulate matter in the atmosphere decreases visibility. The primary environmental and ecologic effects of particles are related to haze, which is caused by the suspended aerosols that both absorb and scatter light. The primary constituents of concern are carbonaceous materials (absorption) and aerosols containing sulfates and nitrates (scattering). Even though the atmosphere naturally limits our ability to distinguish an object from background by Rayleigh scattering (when the size of the aerosol is much less than the wavelength of visible light), Mie scattering (when the size of the aerosol is approximately equal to the wavelength of visible light) can greatly decrease visibility.
FINDING 2. Air emissions from animal feeding operations are of varying concern at different spatial scales, as shown in Table 3-7.
RECOMMENDATION: These differing effects, concentrations, and spatial distributions lead to a logical plan of action for establishing research priorities to provide detailed scientific information on the contributions of AFO emissions to potential effects and the subsequent implementation of control measures. USDA and EPA should first focus their efforts on the measurement and control of those emissions of major concern.
FINDING 3. Measurement protocols, control strategies, and management techniques must be emission and scale specific.
RECOMMENDATIONS:
-
For air emissions important on a global or national scale (i.e., ammonia and the greenhouse gases methane and N2O), the aim is to control emissions per unit of production (kilograms of food produced) rather than emissions per farm. Where the environmental and health benefits outweigh the costs of mitigation it is important to decrease the
TABLE 3-7 Committee’s Scientific Evaluation of the Potential Importance of AFO Emissions at Different Spatial Scales
|
Emissions |
Global, National and Regional |
Local—Property Line or Nearest Dwelling |
Primary Effects of Concern |
|
NH3 |
Majora |
Minor |
Atmospheric deposition, haze |
|
N2O |
Significant |
Insignificant |
Global climate change |
|
NOx |
Significant |
Minor |
Haze, atmospheric deposition, smog |
|
CH4 |
Significant |
Insignificant |
Global climate change |
|
VOCsb |
Insignificant |
Minor |
Quality of human life |
|
H2S |
Insignificant |
Significant |
Quality of human life |
|
PM10c |
Insignificant |
Significant |
Haze |
|
PM2.5c |
Insignificant |
Significant |
Health, haze |
|
Odor |
Insignificant |
Major |
Quality of human life |
|
aRelative importance of emissions from AFOs at spatial scales based on committees’ informed judgment on known or potential impacts from AFOs. Rank order from high to low importance is major, significant, minor, and insignificant. While AFOs may not play an important role for some of these, emissions from other sources alone or in aggregate may have different rankings. For example VOCs and NOx play important roles in the formation of tropospheric ozone; however the role of AFOs is likely to be insignificant compared to other sources. bVolatile organic compounds. cParticulate matter. PM10 and PM2.5 include particles with aerodynamic equivalent diameters up to 10 and 2.5 μm, respectively. |
|||
-
aggregate emissions. In some geographic regions, aggregate emission goals may limit the number of animals produced in those regions.
-
For air emissions important on a local scale (H2S, particulate matter, and odor), the aim is to control ambient concentrations at the farm boundary and/or nearest occupied dwelling. Standards applicable to the farm boundary and/or nearest occupied dwelling must be developed.
-
Monitoring should be conducted to measure concentrations of air pollutants with possible health concern at times when they are likely to be highest and in places where the densities of animals and humans, and typical meteorological conditions, are likely to result in the highest degree of human exposure.
FINDING 4. There is a general paucity of credible scientific information on the effects of mitigation technology on concentrations, rates, and fates of air emissions from AFOs. However, the implementation of technically and economically feasible management practices (e.g., manure incorporation into soil) designed to decrease emissions should not be delayed.
RECOMMENDATION: Best management practices (BMPs) aimed at mitigating AFO air emissions should continue to be improved and applied as new information is developed on the character, amount, and dispersion of these air emissions, and on their health and environmental effects. A systems analysis should include impacts of a BMP on other parts of the entire system.
SUMMARY
This chapter described the various constituents of air emissions that are of primary interest and the factors that determine emissions rates and dispersion as they affect atmospheric concentrations. The effects of temporal and spatial factors are described along with the complexities of modeling the flow of emissions over complex terrain as they affect field measurements. Potential impacts of these air emissions on human health and the environment are described and put in the context of expected rates and concentrations of emissions from animal feeding operations.


