
4
Measuring Emissions
INTRODUCTION
Emissions from animal feeding operations (AFOs) have local, regional, and global impacts. The committee was charged by the U.S. Environmental Protection Agency (EPA) and the U.S. Department of Agriculture (USDA) to provide recommendations on the most promising science-based methodologies and modeling approaches for estimating and measuring these emissions. This implies a desire by EPA and USDA to quantify and perhaps limit these emissions and to evaluate decreases made possible by abatement strategies and management practices.
Air quality in the United States is maintained through the adoption of both National Ambient Air Quality Standards (NAAQS) and air pollutant source emission standards that are applied to numerous sources. The latter implies that the emission rates of specific air pollutants from each source type are known. If an airshed does not meet the NAAQS, knowledge of the emission rates from the various sources in the airshed allows the development of strategies to improve air quality by targeting important sources for control. While this approach to regulation may be straightforward for some industrial operations, livestock feeding operations pose especially complicated issues for estimating and measuring air emissions.
AFOs are complex physical, chemical, and biological systems. Feeding, digestion, excretion, and animal and site activity show diurnal, seasonal, and life cycle variations. Once feces and urine leave the animal, they undergo a variety of processes that are driven by wind, temperature, moisture, and microbial metabolism. Factors such as pH and the availability of oxygen affect the communities of microorganisms that are going through their own life cycles and are responsible
for transforming the nonvolatile compounds in feed, water, and manure into volatile compounds such as ammonia (NH3), nitrous oxide (N2O), nitric oxide (NO), methane (CH4), and volatile organic compounds (VOCs), as well as hydrogen sulfide (H2S) and other odor-causing compounds.
A complication in measuring emissions from AFOs is that most emissions are released from area sources such as cattle feedlots, wastewater lagoons, or the land to which manure or lagoon liquid is applied, rather than from a few discrete point sources (e.g., animal house exhaust fans). Spatial and temporal variation exists. Measuring area emission rates often depends on measuring atmospheric concentrations and characterizing the micrometeorology or using atmospheric dispersion models to back-calculate the emission rates that gave the concentrations observed. Measuring emission rates from animal housing with forced ventilation is relatively easier; one measures concentrations and ventilation airflow rates. The variability in atmospheric concentrations possible near an area source is illustrated by measurements of ammonia shown in Figure 4-1. Over a period of about half an hour, the average NH3 concentration near a dairy wastewater lagoon varied from about 10 to 700 ppb (parts per billion). This variability (a factor of 70) was due primarily to variable wind speed and direction during the measurement period.
Although direct measurement of off-property impacts of the various emissions from every AFO is not practical, there is a need for an approach that can be used by local, state, or federal agencies to estimate emissions from individual AFOs. The overall air quality management goal is to limit emissions to concentrations that will not lead to exceedances of the NAAQS for criteria pollutants or other regulatory limits described in Chapter 6.
AFO emissions have impacts on several spatial and temporal scales. Greenhouse gases such as nitrous oxide and methane, which have long atmospheric half-lives and are transported for long distances, have global rather than local or regional effects; their annual emissions from U.S. agriculture are important but their local or regional concentrations are not. The fraction of these gases from AFOs is of some concern because some kinds of controls may be applied more efficiently to large sources than to smaller ones.
Primary particulate matter and odors are of concern mostly to individuals near the emission sources. What are important for them are not annual totals, but ambient concentrations averaged over short periods of time (typically 1 to 24 hours). These concentrations depend not only on short-term emission rates, but also on meteorological conditions at the time, including wind speed and direction, atmospheric stability, and precipitation. Some pollutants act at a variety of scales. Ammonia and H2S contribute to short-range odor and toxicity, but react in the atmosphere to form secondary fine particulate matter (PM2.5) dispersed over a regional scale; VOCs contribute to odor and also react with nitrogen oxides (NOx) in the presence of heat and sunlight to form tropospheric ozone (O3), another regional problem. For air pollutants that can have adverse human health
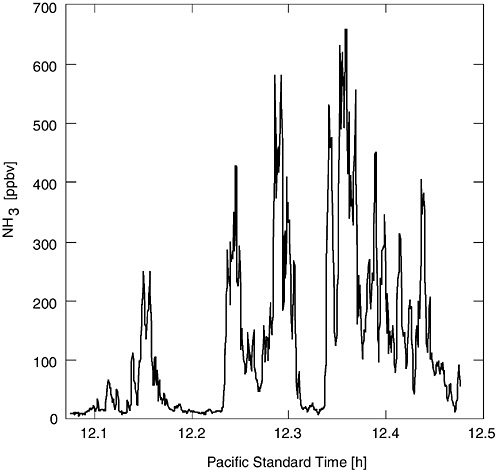
FIGURE 4-1 Ammonia concentrations (averaged over a 68-m path) measured near a dairy wastewater lagoon. Method used was an ultraviolet differential optical absorption spectroscopy technique with a detectability limit of 1 ppb and a time resolution of 0.6 second.
SOURCE: Reprinted from Mount et al., 2002, with permission from Elsevier Science.
effects, the time course of concentrations inhaled is important; for PM, health effects also depend on the physical, chemical, and biological characteristics of the particulate material. Concentrations of odorants are important, but measurement and understanding of their health effects are still in their infancy.
CALIBRATION, SAMPLING, AND CONCENTRATION MEASUREMENTS
The substances of interest in this report run the gamut from the most accurately measured atmospheric trace gases, with a long history of precise calibra-
tion standards, to the most challenging biologically active substances, for which accurate measurement remains a research topic. Measurement methods and calibration standards for methane, nitric oxide, and nitrous oxide are among the most thoroughly studied. Observations can be made with well-characterized methods and with low uncertainty relative to natural variability. Controlled intercomparisons of various analytical techniques under field conditions have led to uniform international calibration standards and the identification of reliable instruments. In ambient air under a variety of weather conditions and for a broad range of concentrations, CH4 and N2O can be measured within 1 percent and NO within 15 percent (Fehsenfeld et al., 1987). In the case of odor, no formal effort to standardize methodology has occurred in the United States.
Calibration Gases
The more stable gases, CH4, N2O, NO, and some nonmethane hydrocarbons (NMHCs) can be stored as compressed gas mixtures. The mixing ratios of these gases remain stable for years if the cylinders are stored and handled properly, so these mixtures can provide reliable calibration standards with absolute uncertainty well below 10 percent.
NIST Standard Reference Materials
Calibration gas standards of CH4, NO, and N2O in air or in nitrogen (certified at concentrations of approximately 5 to 40 ppm [parts per million]) are obtainable from the Standard Reference Material (SRM) Program of the National Institute of Standards and Technology (NIST), formerly the National Bureau of Standards (NBS), in Gaithersburg, Maryland. These SRMs are supplied as compressed gas mixtures at about 135 bar (1900 pounds per square inch [psi]) in high-pressure aluminum cylinders containing 800 L (liters) of gas at standard temperature and pressure, dry (STPD) (NBS, 1975; Guenther et al., 1996). Each cylinder is supplied with a certificate stating concentration and uncertainty. The concentrations are certified to be accurate to ±1 percent relative to the stated values. Because of the resources required for their certification, SRMs are not intended for use as daily working standards, but rather are to be used as primary standards against which transfer standards can be calibrated.
NIST Traceable Reference Materials
Calibration gas standards of CH4, N2O, and NO in air or nitrogen (N2), in the concentrations indicated above, are obtainable from specialty gas companies. Information as to whether a company supplies such mixtures is obtainable from the company or from NIST’s SRM Program. These NIST Traceable Reference Materials (NTRMs) are purchased directly from industry and are supplied as com-
pressed gas mixtures at approximately 135 bar (1900 psi) in high-pressure aluminum cylinders containing 4000 L of gas at STPD. Each cylinder is supplied with a certificate stating concentration and uncertainty. The concentrations are certified to be accurate to within ±1 percent of the stated values (Guenther et al., 1996).
More recent work (Phillips et al., 2001) recommends the annular denuder sampling with on-line analysis rotary annular denuder technique for continuous measuring of ammonia concentrations from AFOs. Wet chemistry methods (acid bubblers or passive “ferm tube” samples) are generally acceptable but cannot measure continuously. For determining emission rates that require measurement of ventilation rate, Phillips et al. (2001) suggests the use of fan-wheel anemometers or a tracer gas method using sulfur hexafluoride for force- and naturally-ventilated buildings, respectively.
MEASURING CONCENTRATIONS AND COMPOSITIONS
Ammonia
For ambient (outside) air, several reviews and intercomparisons of ammonia detection techniques have been published (Harrison and Kitto, 1990; Wiebe et al., 1990; Williams et al., 1992a). Results of the intercomparisons have been in-conclusive. Interference from particles and problems with sampling and conversion efficiency (including temperature and humidity dependence) complicate measurements. The long-term stability of ammonia in compressed gas mixtures has not been demonstrated, but calibration standards can be produced using permeation devices.
Samples collected using both denuders and filters can be analyzed by aqueous-phase colorimetry or ion chromatography to measure NH3 and ammonium ion (NH4+). Diffusion denuders coated to remove specific gases rely on the relatively rapid diffusion of gases compared to particles to remove the gases while allowing the particles to pass through the denuder. With sequential gas samplers, for example, air is drawn through two parallel channels, each containing a quartz filter followed by a cellulose filter impregnated with citric acid. In front of one sampler is an NH3 denuder made of citric acid-coated parallel tubes, which remove vapor-phase ammonia but not particulate-phase ammonium. The impregnated filters collect ammonium and ammonia (as ammonium ion) quantitatively. Ammonium is extracted from the filters into water and measured via colorimetry or ion chromatography. Gaseous ammonia is calculated from the difference between the two channels. Chow et al. (1996) report that the analytical uncertainty in a single measurement is typically ±10 percent for a measured value that is more than 10 times below detection limits, but this accuracy has not been confirmed by independent analysis. The response time depends on the concentration, varying from days to hours.
Ammonia can be converted to NO on hot stainless steel in the presence of oxygen and the NO detected via chemiluminescence, as described below. Conversion can take place either continuously or following collection onto a denuder. This technique suffers from potential interference from other substances, such as nitrogen dioxide (NO2) and nitric acid (HNO3), that are also converted to NO. To avoid such interferences, the system can be zeroed with an ammonia-specific scrubber such as an acid-coated denuder tube. Response times vary from minutes to hours; absolute accuracy and precision are unknown.
Ammonia can be dissociated photolytically and the NH fragment detected with photolytic fragmentation laser-induced fluorescence (PF-LIF). Heating by a tuned carbon dioxide (CO2) laser followed by interferometry to measure ammonia has also been reported (Owens et al., 1999). These techniques are labor intensive and expensive, but sensitive and fast relative to filter techniques.
In an intercomparison conducted in a cold dry environment in Colorado (Williams et al., 1992b), the photofragmentation and denuder systems agreed well, within 15 percent in some cases. Problems with sampling and gas-to-particle conversion caused some filter techniques to differ from other methods by about 35 percent. All techniques generally agreed to within a factor of two for fog-free conditions. Fourier transform infrared spectrometry has been used with some success to measure trace gas concentrations in swine facilities (Childers et al., 2001), although the conversion to emission fluxes has met with only very limited success. Tunable diode laser techniques can also be applied with sensitivity levels of several parts per billion. Older techniques involve use of ferm tubes, absorption flasks, filter badges, and shuttles.
Major problems associated with NH3 detection and analyses are related to emissions of NH3 to instrument inlet surfaces. Many methods also rely on integrated sample collection. Mount et al. (2002) recently described a new technique for measuring atmospheric NH3 in real time, using differential optical absorption spectroscopy (DOAS). Their method avoids a collecting medium and thus circumvents the common problem of losses to inlet surfaces. They reported a detection limit on the order of 1 ppb. This method has not yet been tested in intercomparison studies.
Nitrous Oxide
For nitrous oxide, gas chromatography (GC) followed by electron capture detection (GC-ECD), tunable diode laser spectroscopy (TDLS), and Fourier transform infrared spectroscopy (FTIR) have demonstrated accuracy well above the natural variability of the emitting systems. Esler et al. (2000) report N2O measurement precision of 1 percent, which is inadequate for long-term global trend analysis, but more than adequate for emission measurements. GC-ECD has been used successfully for some time (e.g., Robertson et al., 2000). Intercomparisons
have indicated agreement of standards to within 1 percent. These techniques work on both ambient air samples and grab samples stored in canisters.
Nitric Oxide
Nitric oxide is generally measured in situ with instruments based on chemiluminescence. NO at ambient concentrations cannot be reliably stored in grab samples for later analysis; it is too reactive at typical concentrations in ambient air. Chemiluminescence detection of NO involves reaction with excess ozone to produce electronically excited NO2, which then relaxes to emit a photon. This technique has been investigated extensively in both laboratory and field studies (Fehsenfeld et al., 1987; Crosley, 1996). It compares well with laser-induced fluorescence and is generally accepted to be reliable (at concentrations relevant to emissions studies) to better than 15 percent with 95 percent confidence. Response times are on the order of 1 minute.
Methane
Methane is measured most commonly with GC followed by flame ionization detection (FID). Interagency intercomparisons indicate agreement to well within 1 percent (Masarie et al., 2001). The technique works on both ambient samples and air stored in canisters. TDLS has also proven successful for monitoring CH4 (Billesbach et al., 1998).
Volatile Organic Compounds
Hydrocarbons can be measured with gas chromatography followed by flame ionization detection (GC-FID). Detection by mass spectroscopy is sometimes used to confirm species identified by retention time (Westberg and Zimmerman, 1993; Dewulf and Van Langenhove, 1997). Preconcentration is typically required for less abundant species. In an intercomparison conducted with 16 components among 28 laboratories, agreement was typically tens of percent (Apel et al., 1994). In a more recent intercomparison (Apel et al., 1999), 36 investigators from around the world were asked to identify and quantify C2 to C10 hydrocarbons (HCs) in a mixture in synthetic air. Calibration was based on gas standards of individual compounds, such as propane in air, and a 16-compound mixture of C2 to C16n-alkanes, all prepared by NIST and certified to ±3 percent. The top-performing laboratories, including several in the United States, obtained agreement of generally better than 20 percent for the 60 compounds. Intercomparison of NMHCs in ambient air has yet to be reported. Measurement of other volatile organic compounds such as those containing nitrogen, oxygen, or sulfur remains a focus of ongoing research; a summary of these techniques is beyond the scope of this report.
Hydrogen Sulfide
Wet chemistry techniques, gas analyzers, and monitors are available for measuring concentrations of hydrogen sulfide in air. The wet chemistry technique involves the collection of sulfides in heavy-metal salt solutions and later recovery and measurement of sulfide using wet chemistry methods. The heavy-metal salt solutions, when exposed to H2S, form insoluble metal sulfide precipitates (Barth and Polkowski, 1974; Elliott et al., 1978). Zinc acetate, mercuric chloride (HgCl2), and mercuric cyanide (Hg[CN]2) solutions are common. The concentration of H2S in air was calculated by the mass of it collected in the solution divided by the volume of air, which is determined from the flow rate of air that travels through the collection impingers and the time period of collection. Wet chemistry techniques tend to be time consuming and may experience loss of sulfide due to incomplete recovery of sulfide from the precipitates.
When the concentration of H2S in the air sample is below the detection limit of GC, concentrating procedures, such as cold traps (Beard and Guenzi, 1983) and adsorbent materials (Elliott et al., 1978), must be used. Gas chromatography provides good dependability and accuracy for gas analysis and has been used by researchers for H2S measurements (Banwart and Bremner, 1975; Powers et al., 2000). However, the relatively poor portability of GC limits its use mostly to the environments of the research laboratory. Therefore, GC is usually not suited for on-site monitoring unless a mobile laboratory is provided at the measurement site. Portable and durable analyzers and monitors are more desirable for field measurement and monitoring. Three gas analyzers that have been used recently for H2S concentration monitoring around livestock farms are described below.
For the Zellweger MDA Single Point Air Monitor (SPM) the detection limit is 1 ppb for hydrogen sulfide (2.6 ppm for ammonia). The accuracy is 20 percent. The SPM uses a paper tape treated with a dry reagent medium to collect and analyze the gas. Upon exposure to the target gas, the paper tape changes color in direct proportion to the gas concentration in the air sample. A photo-optic system within the SPM measures the color intensity range and determines the gas concentration based on 15-minute averages. Bicudo et al. (2002) used this instrument for measuring ambient H2S concentrations near swine barns and manure storages.
The Portable Jerome Hydrogen Sulfide Analyzer (Model 631-X, Arizona Instrument, Phoenix, AZ) has an accuracy of 6-8 percent depending on the concentration of H2S to be measured. This instrument uses a gold film sensor for detection and measurement. It has been used recently by several researchers for monitoring ambient H2S concentrations around livestock farms (Wood et al., 2001). It was noted that the sensor was affected by other sulfide compounds. However, due to the lower response factors of the sensor to them, the Jerome meter is considered to be capable of providing quantitative detection of H2S.
The TEI Model 45C H2S Analyzer has an H2S-to-SO2 (sulfur dioxide) converter coupled to a pulsed fluorescence SO2 analyzer. The detection limit is 0.5
ppb. Ni et al. (2002a) and Zahn et al. (2002) used this instrument for H2S analysis in swine buildings and over a swine wastewater lagoon.
Based on researchers’ reports and manufacturers’ information, the Portable Jerome Hydrogen Sulfide Analyzer and the TEI Model 45C H2S Analyzer are considered good choices of instrumentation for measuring and monitoring ambient H2S concentrations at livestock farms.
The experience of researchers with field measurement and monitoring of H2S is scarce. The consistency and accuracy of H2S analyzers have to be better understood, and proper usage and calibration procedures must be developed.
Particulate Matter
Measurement technologies for particulate matter (PM) are profoundly affected by the complexity of PM emissions. PM is not a single well-defined entity such as N2O or CH4. The actual constituents vary, as do particle sizes, depending on geographical location and meteorological conditions. Fresh particles from urban sources can be quite active; the aerosol chemistry in polluted, urban airsheds is intricate and dynamic. Combustion sources such as motor vehicles and boilers release volatile and semivolatile organic compounds, some of which quickly condense to form very small particles. These ultrafine particles serve as condensation nuclei upon which other organic and inorganic vapors condense, thus growing the particles in the proximity of their sources. As it is transported downwind, the aerosol mix “ages” as numerous other processes take place. Organic vapors condense on organic and other types of aerosol particles, including soil and inorganic particles. Gaseous ammonia reacts with gaseous nitric acid to form particulate ammonium nitrate. Particles containing sulfuric acid form from the oxidation of gaseous SO2; these react with other gases, including ammonia. Smaller particles tend to agglomerate into larger ones; photochemistry can take place in some. The primary particles emitted directly from the combustion sources and the secondary particles generated from these atmospheric reactions and from condensation growth tend to be smaller than 1 μm in aerodynamic diameter (“fine particulate matter”). Thus, the nature of PM depends not only on the source, but also on other co-pollutants, chemical reactions, and distance from the source.
By comparison, PM from animal feeding operations tends to contain a significant fraction of mechanically generated material such as soil, dried manure, and so forth—material that is typically larger than 1 μm in aerodynamic diameter (“coarse particulate matter”). In many rural areas with AFOs, especially in arid and semiarid regions, there is a relatively large mass concentration of coarse particulate matter, compared to fine. Air in rural agricultural areas may also carry a significant load of fine PM from the reaction of gaseous ammonia with other chemical compounds such as nitric acid. In addition, it has been speculated that the particulate organic material that exists in rural areas may contain bioaerosols such as toxins, allergens, viruses, bacteria, and fungi. To date, studies of bioaero-
sols in swine barns have been limited, in part because there are no currently accepted standard methods for bioaerosol measurement, and in part because no sampler has been fully characterized for bioaerosol collection efficiency.
Chemical changes may take place in the rural atmosphere; however, the chemistry is likely to be less complex than that in the urban atmosphere, especially with respect to particulate organic matter. In any event, the chemical composition of particulate matter in rural areas will be substantially different from that in urban areas. Whatever the complexities, it is by no means clear that the hazards of rural PM can be inferred from research focused on urban PM, but at present both are regulated in the same way.
Atmospheric particulate matter is measured by a variety of techniques, but for regulatory purposes, the primary measures are PM10 and PM2.5. Both PM10 and PM2.5 are “operationally defined” by the measurement technique. PM10 is the particulate matter captured in a size–selective inlet that removes particles with an aerodynamic equivalent diameter (AED) of 10 μm with an efficiency of 50 percent. PM2.5 is similarly defined but for particles with AED of 2.5 μm. The AED is not a true physical dimension of the particle, but rather an equivalent diameter based upon a spherical particle with a density of 1 g/cm3 with the same settling velocity as the particle in question. In measurements of both PM10 and PM2.5 there is some collection of particles larger than the indicated size and loss of some smaller, since a perfectly sharp cutoff based on particle size is not currently possible.
Both PM10 and PM2.5 samplers collect particles with a variety of sizes, shapes, and compositions. Size-selective sampler inlets are usually based on some type of inertial separation to remove larger, undesired particles. The remaining material is then collected onto some sort of sampling media, typically a Teflon, quartz, or nylon filter substrate. The mass concentration is determined by weighing the filter before and after sampling and dividing the weight increase by the total air volume that passed through the sampler.
Chemical and biological analyses are normally carried out on integrated samples collected over a period of time, typically 24 hours. Other methods are available for measuring PM in real (or semireal) time, but there is currently no continuous single method that measures true particulate mass for all compositions. Complications of current samplers include weight loss from semivolatile materials and weight gain by adsorption of gas-phase substances—including water—during sampling and handling. Continuous methods that rely on optical techniques must be calibrated for each type of particulate matter, since optical properties are a function of particle size and composition. Moreover, particles larger than about 2 μm are not very active optically, making instruments (e.g., nephelometers) based on these methods less reliable for the coarse PM that is often encountered in rural areas with AFOs.
Water contributes significantly to the mass of some PM samples. In integrated sampling, the commonly accepted procedure involves equilibrating filters
before and after sampling at a constant specified temperature and relative humidity to control the particle-bound water. In many continuous samplers the problem of particle-bound water, especially at high relative humidity, is dealt with by heating the inlet. This can cause a problem when monitoring for PM2.5 containing a significant fraction of ammonium nitrate, whose heating can cause decomposition back to NH3 and HNO3. A similar weight loss problem occurs when heating semivolatile organic compounds causes desorption from the filter.
Problems associated with determining true atmospheric PM concentrations are compounded by the lack of available calibration standards. While there is a NIST standard for urban PM, there is, at this time, no NIST-traceable standard aerosol mix that can be used to calibrate particulate samplers and monitors. It is possible to calibrate the individual components of a PM sampler with NIST or NIST traceable standards, but it is not possible to calibrate the entire PM sampler system. Quality control procedures test the individual components of the measurement and estimate the overall uncertainty using propagation of error analysis. Individual components that can be assigned measures of quality include flow rate, particulate mass, and temperature and pressure. Other quality control procedures include the use of lab and field blanks and duplicate sampling and analyses. There is considerable ongoing effort in the research community to improve and refine the measurement of atmospheric particles and their constituents, on a real-time, size-segregated, and chemically speciated basis.
Odor
Odor is a sensation produced by stimulation of chemoreceptors in the olfactory epithelium in the nose. The substances that produce the sensation, which include NH3, VOCs, and hydrogen sulfide (H2S), are called odorants. Zahn et al. (1997) established a significant correlation between air concentrations of VOCs and odor offensiveness in swine production facilities. Odor threshold (OT) refers to the minimum concentration of odorant necessary for perception in a specified percentage of the population, usually 50 percent; it is a statistical value, representing the best estimate from a group of individual scores. If only a single compound produces the odor, odor intensity can be expressed in terms of the concentration (e.g., micrograms per cubic meter) of that compound. However, with odors from animal sources, which are generally caused by complex mixtures of compounds, odor concentration is expressed in terms of odor units (OUs) per cubic meter. A concentration of 100 OU/m3 means that a given volume of odorous air must be diluted with 100 volumes of odor-free air before it reaches the detection threshold.
In the recently developed European Standard, the unit of measurement for odor concentration is the European Odor Unit per cubic meter (OUE/m3; European Committee for Standardization, 2002). An OUE is defined as the amount of odorant(s) in 1 m3 of neutral gas at standard conditions that elicits a physiological
response from a panel at detection threshold equivalent to that elicited by 123 μg of n-butanol (1 European Reference Odor Mass). Researchers in the United States have not formally adopted this as the standard unit of measurement.
Odor Sampling
Proper collection and storage of odor samples prior to presentation to panelists or instruments is important for ensuring the accuracy of the measurements. Samples may be collected for immediate or delayed analysis. In sampling for immediate analysis (also called dynamic sampling), the odor sample is ducted directly to an analyzer, such as an olfactometer, without intermediate storage. In sampling for delayed analysis, a sample is collected and transferred to a sample container for later analysis. Both the materials in contact with the sample and the sample storage time can affect the chemical composition and therefore the measurement results. Specifications for sampling equipment and for calibration, conditioning, cleaning, and re-use procedures are described in the European Standard (European Committee for Standardization, 2001), which also lists the following materials as appropriate for those parts of the equipment that will be in contact with the odor sample: stainless steel, glass, polytetrafluoroethylene (PTFE), tetrafluoroethylene-hexafluoropropylene copolymer (FEP), and polyethyleneterephalate (PET, Nalophan). Polyvinylfluoride (PVF, Tedlar), FEP, and PET are appropriate materials for making sample containers. Tedlar bags (10-50 L) that are inflated in the field using portable wind tunnels or negatively pressurized canisters are commonly used.
Odor Concentration Measurements
Methods for measuring odor concentrations include sensory methods, analytical methods, and “electronic noses” for specific odorous gases. An electronic nose is an array of gas sensors that is combined with pattern recognition software to mimic human olfactory response (Lacey, 1998). Sensory methods include olfactometry, scaling, and rating, of which olfactometry is the most widely used. Olfactometry involves collecting and presenting odor samples (diluted or undiluted) to selected and screened panelists under controlled conditions using scentometers and dynamic olfactometers. Scentometers are portable field measurement instruments that can be used for direct sampling and measurement of ambient air and have been used as the basis for setting property line odor concentration standards by several states (e.g., Colorado, Missouri, Montana, North Dakota, and Kentucky) and various cities. Scentometers have also been used for field odor measurement at numerous livestock and poultry operations in the United States (Miner and Stroh, 1976; Sweeten et al., 1977, 1983, 1991) and in data collection for nuisance litigation (Sweeten and Miner, 1993). Dynamic Triangle Forced-Choice Olfactometers, which offer more accuracy in odor measure-
ment than scentometers, are the instrumentation of the choice for the ASTM (American Society for Testing and Materials) and European Standards and are widely used for odor research. Guidelines for the design, construction, calibration, and operation of olfactometers are given in the European Standard (European Committee for Standardization, 2001). Specific requirements for panel size and selection with respect to behavior, variability, and sensitivity of panel members are also provided. The minimum panel size in any measurement is four, but larger numbers are recommended to improve repeatability and accuracy. The scentometer may be more appropriate for ambient measurements (property line, downwind of source, etc.) than the olfactometer.
Instruments available to identify and measure the concentrations of specific odorants include gas chromatography coupled with mass spectrometry (GC-MS) for component identification. Some of these methods are sensitive in detecting compounds at very low concentrations. Peters and Blackwood (1977) reported difficulty in positively identifying compounds present in feedlot air samples using GC-FID. (Low peak values precluded the use of GC-MS for amines.) As a result of the low concentrations of many AFO odorants, their components may have to be concentrated prior to analysis using methods such as solvent desorption, thermal adsorption (Zahn et al., 1997), or solid-phase microextraction (SPME) (Zhang et al., 1994). It must be emphasized that chemical techniques should be buttressed by sensory methods to correlate instrumental results with human odor perception.
The relatively high cost per sample of odor panels has created the need for reproducible, inexpensive instruments (electronic noses) capable of making measurements that correlate with the human olfactory response (Lacey, 1998). Lacey (1998) and Mackay-Sim (1992) listed several electronic approaches to volatile gas (odor) detection, including metal oxide semiconductors, field-effect transistors, optical fibers, semiconducting polymers, and piezoelectric quartz crystal devices. These approaches raise the possibility of remote odor monitoring or surveillance networks for individual compounds or odorant mixtures. Piezoelectric crystals are sensitive to changes in surface mass caused by adsorption of gas molecules. As mass is added to the surface, the resonant frequency decreases and can be measured precisely. The crystal surface can be made to respond to single chemicals or groups of chemicals. Some sensors may be affected by water vapor, methane, and temperature (Lacey, 1998).
Electronic methods should be tested against olfactometry results to be validated against human sensory responses.
FINDING 5. Standardized methodology for odor measurement have not been adopted in the United States.
RECOMMENDATIONS:
-
Standardized methodology should be developed in the United States
-
for objective measurement techniques to correspond to subjective human response.
-
A standardized unit of measurement of odor concentration should be adopted in the United States.
MEASURING EMISSIONS
The method selected for measuring emissions will depend on the type of emission and whether it is from a point source (e.g., an exhaust vent from a mechanically ventilated building; Figure 4-2) or an area source (e.g., a waste lagoon; Figure 4-3).
The emission rates for low-level point sources (LLPSs; Figure 4-2) may be determined by measuring concentrations (mass per unit volume) and volumetric flow rates (volume per unit time) at the emitting points and multiplying the two measurements. The emission rates will be expressed as mass per unit time. An alternative procedure consists of measuring the ambient concentrations upwind and downwind (off-property) and back-calculating the emission rate using dispersion modeling. The Air Pollution Regulatory Process (APRP) addresses off-property impacts on the public. For criteria pollutants, EPA regulations stipulate that the 24-hour downwind concentration should not exceed the NAAQS at the property line or at the nearest occupied residence.
The emission rate for a ground-level area source (GLAS; Figure 4-3) may be determined using “flux chambers” or micrometeorological techniques or by measuring upwind and downwind concentrations and back-calculation of flux using dispersion modeling. The units of flux will be mass per unit area per unit time.
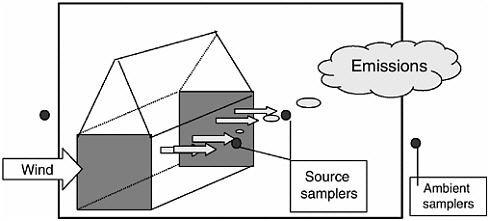
FIGURE 4-2 Schematic illustrating the essential elements associated with measurement of emissions from agricultural sources that can be characterized as low-level point sources such as cotton gins, feed mills, grain elevators, and oil mills.
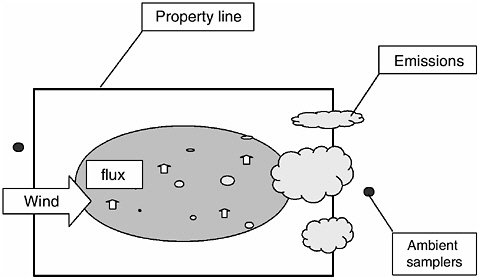
FIGURE 4-3 Schematic illustrating the essential elements associated with measurement of emissions from agricultural sources that can be characterized as ground-level area sources such as dairies, cattle feed yards, field operations, and agricultural burning.
Point Sources
In theory, measurement of the emission rates of gaseous substances from a mechanically ventilated animal facility requires only the concentration of the substance being emitted and the ventilation rate, but accurate measurement of these two factors is difficult in practice. Ventilation rate is affected by many factors including the length of time the fans operate, fan design, fan speed, fan maintenance, motor startup time, static pressure, outside wind speed, wind direction, and infiltration. In practice, measurement of the concentration of an emitted substance is often difficult because of frequently changing ventilation rates. For example, in negative-pressure ventilated facilities, fans do not usually operate continuously, but rather cycle on and off for short periods of time. These short bursts of ventilation (followed by little or no ventilation) are necessary to create sufficient negative pressure to bring in air through the inlets at a proper speed to promote air mixing. If fans operated continuously, animals might become chilled or excess fuel would have to be expended to warm the buildings. Concentration measurement often becomes more difficult at high ventilation rates because substances may be diluted and be present only in very low concentrations. Since ventilation rates can be very high during warm weather and/or with large animals that give off large quantities of heat, even small absolute errors in the measurement of the concentration of an emitted substance can result in significant errors
in emission rates. Errors of 25 to 100 percent in ammonia emission rates have been common in the past.
Mechanically Ventilated Buildings
Mechanically ventilated confined animal facilities (Figure 4-4) may be ventilated using positive-pressure, negative-pressure, or neutral ventilation systems. Positive-pressure systems are equipped with fans that force fresh air into the building and thus create a slight positive static pressure; fresh air is usually circulated within the building by mixing fans. Negative-pressure systems exhaust air from the building and thus create a negative pressure (typically between 0.05 and 0.10 inch of water column) within the building; fresh air enters the building and is mixed through carefully placed air inlets. Neutral-pressure ventilation systems match fans forcing air into the house to fans exhausting air out. Pressure differentials in these types of facilities are essentially zero.
Mechanically ventilated facilities are engineered to provide specific air exchange rates related to the needs of the animal (low air exchange rates for young animals in cold weather, high rates for large animals in hot weather). In the case of poultry, typical ventilation rates range from 0.1 to 10 cubic feet per minute
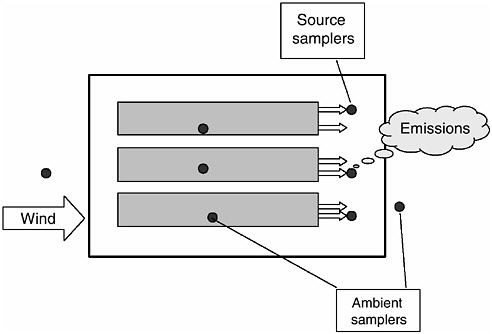
FIGURE 4-4 Schematic illustrating the essential elements associated with the regulation of emissions from agricultural sources that can be characterized as low-level point sources such as tunnel-ventilated AFOs.
(cfm) of air exchange per animal (MWPS, 1990; Lacy and Czarick, 1992). For swine, these rates range from 2 to 300 cfm per animal. Recommended air exchange rates for dairy cows in confined housing range from 50 to 1000 cfm per animal (MWPS, 1990). Ventilation rates in mechanically ventilated facilities depend on the number of fans and the length of time they operate. Relatively precise control is provided by timers, thermostats, and in many cases, computer equipment. Ventilation rates differ and/or change depending upon house design, animal density, animal age, climate, season, feeding program, and so forth. Again, very low ventilation rates are typical when animals are young and heat production by the animals is minimal; high rates are necessary for older animals when heat produced by the animals becomes a concern and must be removed. Measurement of low ventilation rates (e.g., during cold weather) is difficult and prone to error.
Naturally Ventilated Buildings
Naturally ventilated facilities (Figure 4-5) rely on wind currents to provide fresh air needs to the animals and to remove excess moisture, ammonia, CO2, et cetera. In most cases, air enters these naturally ventilated facilities through openings in the sidewalls. These openings are typically fitted with adjustable curtains or panels that provide rudimentary environmental control (MWPS, 1989).
Ventilation rates in naturally ventilated houses depend on wind velocities and adjustment of the curtain openings. Measuring ventilation rates accurately in naturally ventilated houses is extremely difficult due to the dynamics of outside weather and wind conditions.
The emission rate for an LLPS (Figure 4.4 and 4-5) will be expressed as mass per unit time. The APRP could include measurements of “ambient” concentrations using TSP, PM10, or PM2.5 samplers upwind and downwind from the source off-property. Emission measurements could also include source sampling emission rates at the point source or inside the house using the assumption that the concentrations of pollutants emitted are equal to the measured concentrations of the indoor environment. The APRP addresses off-property impacts on the public.
Area Sources
To determine emissions from area sources, it is necessary to take into account the local meteorology and the wind field. Gases and aerosols are exchanged between the earth’s surface and the atmosphere through turbulent processes that take place near the surface. Dispersion by atmospheric turbulence is orders of magnitude greater than molecular diffusion, and tracer gases often provide a useful measure of wind diffusion. Vertical emissions through a horizontal plane par-
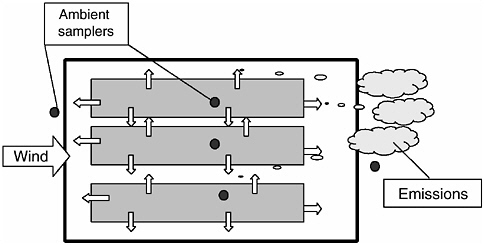
FIGURE 4-5 Schematic illustrating the essential elements associated with the regulation of emissions from agricultural sources that can be characterized as low-level point sources such as naturally ventilated AFOs.
allel to the ground result from vertical turbulent diffusion processes (Lamb et al., 1985).
Emissions of gases or aerosols from area sources are often expressed in terms of fluxes, or mass emission rates per unit area perpendicular to the direction of the flux. Fluxes are measured at a variety of scales, including small, surface-layer, and mixed-layer scales (for a discussion of small and surface-layer scales, see Fowler [1999]). In all of the measurement methods there exist considerable uncertainties, as well as advantages and disadvantages. At the small scale (e.g., in a tent on a field or a chamber over a water surface), the environment is enclosed and thus the surface being studied is altered. At the surface- and mixed-layer scales, fluxes are determined by measuring the vertical turbulent transport. The height of the measurement dictates the area of the surface over which the measurement is averaged and, thus, the scale of the measurement.
Small Scale (10−1 to 102 m2)
A number of enclosure techniques exist to estimate fluxes at the small scale; some involve chambers and wind tunnels. In an enclosed-chamber experiment, a chamber is placed either on or around the source. The experiment can be operated in a flow-through manner, in which the airflow rate is known and the concentrations into and out of the chamber are measured. It is also possible to conduct an enclosure experiment in a dynamic, nonflow manner, in which the change in the chamber concentration of the substance of interest in the chamber is monitored over time. Conceptually, the enclosure experiment is relatively straightforward.
Its advantages include the ability to conduct process-level or sensitivity studies of the factors that control emissions. Significantly less infrastructure may be needed than that required for the micrometeorological techniques used in larger-scale studies. The major drawback of enclosure techniques is that they alter the environment of the emission source and thus could bias the measured emission rate. They also give a measurement in a very limited region of space, so that it is difficult to both capture the spatial variability of the emission rate and to integrate over larger areas. For example, if there are a few “hot spots” where the surface of a lagoon is disturbed, measurement at the hot spots will be too high, measurements elsewhere will be too low, and neither will give an accurate picture of average emission rates. If the trace species of interest is highly reactive or water soluble, losses to equipment walls may complicate the experiment. Nevertheless, enclosure techniques have been used to study trace gas fluxes from soils, lagoons, and vegetation. They can be especially useful in determining the relative emission rates of gases.
Surface-Layer Scale (102 to 106 m2)
At the surface-layer scale, micrometeorological techniques or mass balance methods can be used to measure area source fluxes. Micrometeorological methods include eddy correlation, eddy accumulation and other conditional sampling techniques, and gradient and difference methods. These techniques are typically implemented by installing instrumentation on tower platforms, thus requiring substantial experimental infrastructure. Disjunct eddy covariance is a new technique (Rinne et al., 2001) that allows measurement of trace gas fluxes with relatively long time intervals between quick gas samples, rather than continuous sampling.
A basic requirement for all of the micrometeorological methods to be successful is a horizontally homogeneous surface (long, uniform fetch). One must also contend with flow distortion caused by the tower itself, as well as by sensors installed on the tower. Micrometeorological methods have been widely used to measure CO2, water vapor, and biogenic hydrocarbon emissions from forest or agricultural canopies. The requirements of uniformity of the canopy and fetch would likely not be easily met for animal confinement operations, but may be applicable for measuring emissions from some land applications or over slurry lagoons. Some, but not all of the techniques require fast-response chemical sensors. These techniques also require determination of micrometeorological parameters including eddy diffusivities for momentum, heat, or water vapor; latent and sensible heat fluxes; and atmospheric stability correction factors. Limitations in micrometeorological sensors are also of concern (Lapitan et al., 1999). Spatial variability due to hills, trees, buildings, varying soil fertility, and biomass density complicates the use of micrometeorological methods for flux determinations.
Eddy Correlation or Eddy Covariance
This is the most direct micrometeorological method of determining vertical fluxes; however it is difficult to implement. In this technique, the flux is determined by measurement of the covariance of the fluctuation of the concentration of the species of interest with the fluctuation in the vertical wind speed. Thus, the method requires concurrent, contiguous measurements of the species concentration and the vertical component of the wind, both sampled at high frequency (>1-10 Hz). In addition, it is important to obtain good vertical alignment of the vertical wind component sensor, and flow distortion around other sensors or the sampling tower itself can cause problems. Because of the fast sensor requirements, eddy correlation has been used to measure fluxes of carbon monoxide (CO), CO2, water vapor, O3, NOx, N2O, SO2, and CH4, but not many other trace gas species (Guenther and Hills, 1998).
Eddy Accumulation
This method is a variation of the eddy correlation technique which relaxes the requirement for fast chemical sensors by “conditional sampling,” in which samples are collected in two or more containers based on the vertical wind velocity component. The sample collection rate is proportional to the vertical wind speed. In this way, samples can be collected and analyzed later. The trade-off is that the method requires fast, accurate flow control with a good dynamic range, rather than fast chemical sensors. In eddy accumulation, the concentrations in the sample reservoirs are typically not very different, so detecting statistically significant differences between the reservoirs may be difficult. Also, any mean off-set in the vertical component of the wind must be removed in real time.
Relaxed Eddy Accumulation (REA)
This is another conditional sampling technique that involves sampling into two reservoirs based on the direction of the vertical wind velocity component. In REA, the requirement for proportional sampling is relaxed, permitting constant sampling rates and thus greatly simplifying the technique. The disjunct eddy accumulation technique further simplifies the operation. REA includes an empirical constant b, which must be known a priori (Gao, 1995). The value of b has been determined experimentally to be approximately 0.6. Like the eddy accumulation method, REA depends on the precision of the measurement method in order to measure a statistically significant difference between two samples.
Flux Gradient and Difference Methods
These commonly used methods do not require fast-response sensors. The flux is estimated from concentration differences between two or more levels and from the wind speed profile. The “constant” of proportionality (eddy diffusivity) must be characterized, either by measuring the energy balance, by measuring the vertical wind profile, or by measuring the concentration gradient along with the
flux using the eddy correlation method for another trace gas. Uncertainty in the determination of eddy diffusivity is a major source of uncertainty in the flux gradient methods (Lapitan et al., 1999). Like other micrometeorological methods, flux gradient techniques are subject to uncertainties associated with spatial and temporal heterogeneities.
Bowen Ratio
This is an indirect technique that is based upon the surface energy budget. The Bowen ratio is the ratio of the sensible heat to the latent heat. This method does not require eddy flux measurements or stability corrections. It does require measurement of the incoming net radiation at the earth’s surface and the soil heat flux, as well as the concentration difference for the species of interest, along with concurrent flux and difference measurements of temperature, humidity, or other trace species. The Bowen ratio method fails under conditions of low energy availability such as during the night or during periods of precipitation. Like all of the micrometeorological methods, the Bowen ratio technique is subject to errors associated with the chemical and micrometeorological sensors and the spatial and temporal variability of fluxes within the source area of interest.
The Box Model
As opposed to the above micrometeorological techniques, the box model method works over smaller areas of fetch and so may be more applicable for some AFOs than the micrometeorological techniques discussed above. The method is a direct technique requiring no empirical relationships. In it, an imaginary box is constructed around some measurement volume so that the transfer of mass into and out of the walls of the box is measured (Shaw et al., 1998). In the most common configuration for flux measurements, the vertical profile of both the horizontal wind speed and the species concentration must be sampled through the entire downwind plume. The height of the plume, and thus the height to which sampling must be conducted, will depend on the atmospheric stability. The mass balance method assumes steady-state conditions, homogeneous horizontal winds, no other internal sources or sinks of the species of interest, and zero or known background concentrations. The box method is not suitable for highly reactive gases such as ammonia that may be rapidly deposited on surfaces. Other problems include disturbing the soil or vegetation to be measured (such as increasing the temperature) and thereby perturbing the rate of emissions. Also where turbulence or fast photochemistry strongly influence emissions or ambient concentrations, box methods must be used with caution.
Dispersion Modeling
In this method, upwind and downwind concentration measurements are made, and the emission rate is back-calculated from a dispersion simulation, usually based on a Gaussian dispersion algorithm, making assumptions regarding the
characterization of the atmospheric stability and dispersion. This method can be applied to area, line, and point sources and would be applicable to a number of animal feeding operations. Due to the many assumptions required, Gaussian dispersion models can be assumed to be good to no better than 50 percent, with sources of uncertainly also introduced by chemical sensors, as well as stability classification.
Atmospheric Tracers
Atmospheric tracers, such as sulfur hexafluoride (SF6), can be used either to measure emission rates “directly” or to improve the dispersion characterization in a dispersion model, thus decreasing the uncertainty in that technique. Under certain conditions, direct flux measurements can be made if the tracer release can adequately simulate the emission source (e.g., point releases to mimic a smoke-stack emission; line source releases to mimic a heavily traveled road) and it can be shown that the tracer disperses in the same manner as the emitted species. In this case, the emission rate can be calculated from the known emission rate of the tracer, multiplied by the ratio of the gradients of the emitted species and the tracer gas. Another application of an atmospheric tracer relevant for AFOs is in the determination of air exchange rates inside enclosures (Lapitan et al., 1999) such as buildings.
Mixed-Layer Scale (1 to 1000 km2)
At the mixed-layer scale, micrometeorological and mass balance techniques can be utilized, with the sample platform now installed on an aircraft or balloon. This allows for spatial averaging over larger areas but introduces additional expense and infrastructure requirements, along with new difficulties, some associated with inlet design for aerosol samplers or sensors, and others with inhomogeneities in surface fluxes at the scale of the flight lengths utilized.
FINDING 6. The complexities of various kinds of air emissions and the temporal and spatial scales of their distribution make direct measurement at the individual farm level impractical other than in a research setting. Research into the application of advanced three-dimensional modeling techniques accounting for transport over complex terrain under thermodynamically stable and unstable planetary boundary layer (PBL) conditions offers good possibilities for improving emissions estimates from AFOs.
RECOMMENDATION: EPA should develop and carry out one or more intensive field campaigns to evaluate the extent to which ambient atmospheric concentrations of the various species of interest are consistent with estimated emissions and to understand how transport and
chemical dynamics shape the local and regional distribution of these species.
AIR QUALITY MONITORING
Air quality monitoring involves measuring concentrations in the ambient air. Currently, almost all monitoring is carried out in cities; little is done in rural areas where AFOs are found. Considerations involved in establishing a monitoring program include the purposes of monitoring; the emissions of interest; analysis methods, and the precision and accuracy needed; the use of mobile versus stationary monitors; the number and locations of sampling sites; sampling frequency and averaging times; the intrusiveness of monitors; and costs.
For example, to assess the magnitude of potential health and environmental impacts of emissions from AFOs, it would be helpful to have much more data on ambient concentrations than are now available, starting perhaps with mobile monitors for substances expected to have the greatest health and environmental effects, in areas with high concentrations of livestock, and at times when emissions are expected to be greatest and meteorological conditions are not conducive to rapid vertical or horizontal dispersion (a stable atmosphere and low wind speeds).
FINDING 7. Scientifically sound and practical protocols for measuring air concentrations, emission rates, and fates are needed for the various elements (nitrogen, carbon, sulfur), compounds (e.g., NH3, CH4, H2S), and particulate matter.
RECOMMENDATIONS:
-
Reliable and accurate calibration standards should be developed, particularly for ammonia.
-
Standardized sampling and compositional analysis techniques should be provided for PM, odor, and their individual components.
-
The accuracy and precision of analytical techniques for ammonia and odor should be determined, including intercomparisons on controlled (i.e., synthetic) and ambient air.
SUMMARY
Assessment of the health and environmental effects associated with air emissions from animal feeding operations requires a substantial increase in both the accuracy of estimates of emissions of substances of interest and the accuracy of measurements of their concentrations. Concentrations are important for the determination of exposure and emission rates.
Concentration measurement requirements include real-time capability, adequate precision and accuracy, and the availability of suitable calibration standards. Not all of the air emissions of concern from AFOs can be measured by techniques that currently meet these requirements; for example, methods for measuring PM suffer from lack of good calibration standards.
Although measurements of air emission rates have been reported for numerous substances and from a variety of source types (point, line, and area), there are relatively few reports of emission measurements from operations within AFOs, for a variety of reasons. The paucity of emission measurements from AFOs is likely due at least in part to a lack of resources available for this research area. The availability of concentration measurement methods is a prerequisite for emission rate determination. Many of the emission rate methods used for other sources could be adapted to determine emission rates of substances from AFOs. Given the variability of AFOs in such matters as configurations, animal populations, climate, and management practices, the variability of emission rates is expected to be great temporally, spatially, and from one AFO to another.


