
Appendix A
Executive Summary From SL-5641
ES-1 Purpose and Scope
Sargent & Lundy LLC was contracted by the Department of Energy through the National Renewable Energy Laboratory to conduct an analysis of parabolic trough and power tower solar technology cost and performance forecasts. The results of the Sargent & Lundy analysis will be reviewed by the National Research Council Committee on ‘Review of a Technology Assessment on Concentrating Solar Power Energy Systems.’ The projections for electrical power consumption in the United States and worldwide vary depending on the study, but there will be a significant increase in installed capacity due to increased demand through 2020. Trough and tower solar power plants will compete with technologies that provide bulk power to the electric utility transmission and distribution systems. The following market entry barriers are the most significant to overcome:
-
Market expansion of trough and tower technology will require incentives to reach market acceptance (competitiveness). Both tower and trough technology currently produce electricity that is more expensive than conventional fossil-fueled technology. Analysis of incentives required to reach market acceptance is not within the scope of the report.
-
Significant cost reductions will be required to reach market acceptance (competitiveness). This report focuses on the potential of cost reductions with the assumption that incentives will occur to support deployment through market expansion.
Sargent & Lundy’s analysis of the cost-reduction potential of CSP technology over the next 10–20 years included the following:
-
Examination of the current trough and tower baseline technologies that are examples of the next plants to be built, including a detailed assessment of the cost and performance basis for these plants.
-
Analysis of the industry projections for technology improvement and plant scale-up out to 2020, including a detailed assessment of the cost and performance projections for future trough and tower plants based on factors such as technology R&D progress, economies of scale, economies of learning resulting from increased deployment, and experience related O&M cost reductions resulting from deployments.
-
Assessment of the level of cost reductions and performance improvements that, based on Sargent & Lundy’s experience, are most likely to be achieved, and a financial analysis of the cost of electricity from such future solar trough and tower plants.
ES-2 SARGENT & LUNDY’S CONCLUSIONS
Based on this analysis it is our opinion that CSP technology is a proven technology for energy production, there is a potential market for CSP technology and that significant cost reductions are achievable assuming reasonable deployment of CSP technologies occurs. The SunLab projections are considered the best-case analysis in which the technology is optimized and a relatively high deployment rate is achieved. Sargent & Lundy independently projected capital and O&M costs, from which the levelized energy costs were derived, based on a more conservative approach whereby the technology improvements are limited to current demonstrated or tested improvements and with a
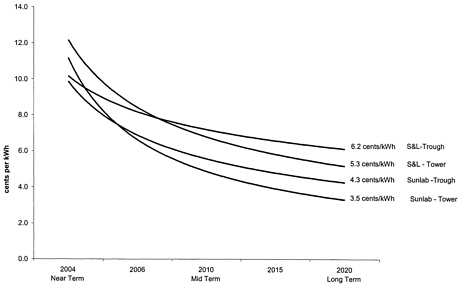
lower rate of deployment than used in the SunLab model. The two sets of estimates, by SunLab and Sargent & Lundy, provide a band within which the costs can be expected to fall. Figure ES-1 highlights these results, with initial electricity costs in the range of 10 to 12.6 ¢/kWh and eventually achieving costs in the range of 3.5 to 6.2¢/kWh. The specific values will depend on total capacity of various technologies deployed and the extent of R&D program success.
Figure ES-1 -Levelized Energy Cost Summary
Sargent & Lundy allocated cost reduction into the following categories: volume production (learning and improvements in manufacturing), plant scale-up (increasing size), and technology advances (RD&D). The table below highlights highlights our assessment of where trough and tower cost reduction occurs for the long-term (2020) case assuming the SunLab technology and deployment scenarios.
|
Cost Reduction Category |
Troughs |
Towers |
|
Volume Production |
26% |
8% |
|
Plant Scale-up |
20% |
48% |
|
Technology Advances |
54% |
24% |
However it should be noted that the study does not provide for a direct comparison between tower and trough technology. The two technologies are not at the same stage of commercial development and no effort was made to compare these technologies on a fully consistent basis.
ES-3 Trough Technical Summary
The cost, performance, and risk of parabolic trough technology are fairly well established by the experience of the existing operating parabolic trough plants. Based on the data available to Sargent & Lundy, the analysis bounds the future potential cost of parabolic trough electricity.
-
Assuming the technology improvements are limited to current demonstrated or tested improvements and a deployment of 2.8 Gwe of installed capacity by the year 2020 and successful development of a thermal storage system, trough costs should be able to drop to approximately 6.2¢/kWh
-
Assuming the projected technical improvements are achieved by an active R&D program and deployment of 4.9 Gwe, trough costs approaching 4¢/kWh are feasible.
Key Trough Technology Conclusions
A number of key technology advances will cause near-term trough plants to be a significant improvement over the SEGS units. These include:
-
Development of the new Solel UVAC receiver, improving collector field thermal performance by 20%.
-
Development of a near-term thermal storage option for troughs by Nexant and SunLab. The design is likely to be demonstrated at the first trough plant to be built in Spain.
-
Replacement of flex hoses with ball joint assemblies in the collector field, significantly reducing HTF pumping parasitics and increasing the potential size of future parabolic trough solar fields.
The development of longer-term more advanced thermal storage technologies is critical. This path offers the largest cost reduction potential, as follows.
-
Integral with advanced thermal storage is the implementation of a higher temperature heat transfer fluid in the 450–500°C range. (SunLab and international R&D groups have significant efforts underway).
-
However, increasing trough-operating temperature to 500°C appears to have minimal impact on the eventual LEC compared to 450°C. This is contrary to earlier conclusions, necessitating a more detailed assessment in the near future.
Significant cost reductions appear reachable in all three key trough components—structure, receiver, and reflectors—though brought about by different cost reduction mechanisms.
-
Concentrator cost reduction will depend largely on size scale-up, production volume and increased competition. (Significant industrial efforts are currently in progress by Duke Solar & EuroTrough).
-
Alternative reflector (mirror) options and production volume are projected to drop costs significantly.
-
Achieving an operating temperature of 450°C with current receiver technology appears feasible. However, the development of a higher performing and more reliable receiver is very important to achieve SunLab long-term cost and performance goals (labs and industry are addressing this).
O&M procedures are expected to continue downward with scale-up, increasing field experience and technology improvements in reliability.
ES-4 Tower Technical Summary
Because no commercial power tower plants have been built there is more uncertainty in the cost, performance, and technical risk of this technology. Consequently, Sargent & Lundy cost estimates include a 10–20% risk premium. Based on the data available to Sargent & Lundy, the analysis bounds the future potential cost of power tower electricity.
-
Assuming the technology improvements are limited to current demonstrated or tested improvements and a deployment of 1.4 Gwe of installed capacity by the year 2020, tower costs should be able to drop to approxiametely 5.3¢/kWh
-
Assuming the projected technical improvements are achieved by an active R&D program and deployment of 8.7 Gwe, tower costs approaching 3.5¢/kWh are feasible.
-
The high temperature capabilities of tower technology has future application potential with gas turbines and combined cycles as well as for the thermo-chemical production of hydrogen and syngas. These advanced applications were not evaluated by Sargent & Lundy
Key Tower Technology Conclusions
Solar plant and power plant scale-up provide the largest cost reduction opportunity for power tower technologies.
-
Scale-up of the tower solar plant requires a total redesign and re-optimization of the field, tower, and receiver. This greatly reduces capital and O&M costs, but has only a small effect on efficiency. R&D support in the design, development, and testing of larger receivers, larger heliostats, and larger heliostat fields will reduce scale-up risk.
-
Scale-up of the steam turbine increases efficiency, and reduces capital and O&M costs. Probability of success here is very high, as existing proven technology is available.
Key technical advances include: increasing receiver solar flux levels, development of new heliostat designs with significantly lower costs, and the use of new highly efficient steam turbines.
-
Increased receiver flux levels have been demonstrated at the prototype scale and require improved heliostat field flux monitoring/management systems and design optimization for use at large plants.
-
Revolutionary heliostat designs with significantly lower cost have been proposed that use flexible, durable thin mirrors in a lower-weight ‘stretched-membrane’ design appropriate for manufacturing. Other novel designs like inflatable/rolling heliostats are also possible. Cost reductions up to 20% as compared to current designs are possible with these approaches.
-
Large high efficiency supercritical steam turbines are now being demonstrated that operate at temperatures compatible with current tower technology or at temperatures that require increasing the operating temperature of the tower technology to 600–650°C.
The major volume manufacturing benefit evaluated for tower technology was related to heliostats.
Heliostat cost reduction will occur when they are produced in volume. Sargent & Lundy’s evaluation of the current heliostat design and cost indicated that cost should decrease 3% with each doubling of cumulative capacity. This would reduce the cost of a field of 148 m2 heliostats from $146/m2 to $91/m2.


