
B
Geographic Differences in Uninsured Rates
The marked variation in uninsured rates among states and localities allows for comparisons to detect the impacts that uninsurance may have on community health services, social institutions, economic bases, and population health. Because covariates of uninsured rates, for example, per capita income, also contribute to potential community effects, the discussion that follows describes the economic, social, and demographic characteristics of states and localities that underpin differences related to health care services, economic resources, and insurance coverage. Following a discussion of the Census Bureau’s March Supplement to the Current Population Survey (CPS), the basis for most of the uninsured rate estimates referred to in this report, a brief overview of uninsured rates across the country is presented, with attention to differences among regions, states, cities, and counties and to disparities among urban, suburban, and rural areas.
Individual-level measurements of insurance status, aggregated to the community level of interest (e.g., metropolitan statistical area [MSA], state, ethnic or racial minority group) are a simple and concise way to characterize uninsurance within a community.1 The CPS is the basis for annual estimates of insurance coverage by
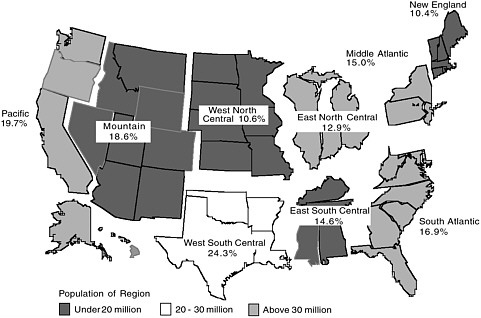
FIGURE B.1 Probability of being uninsured for population under age 65, by census region, 2001.
SOURCE: Fronstin, 2002, estimates based on March 2001 Current Population Survey.
type of coverage and of persons uninsured for the previous calendar year since the late 1970s (Levit et al., 1992). During 2001, there were an estimated 41 million civilian, noninstitutionalized uninsured persons in the United States, approximately 16.5 percent of the population under age 65 (Mills, 2002). There is considerable geographic variation in the distribution of uninsured persons regionally and from state to state; see Figures B.1 and B.2 and Tables C.1, C.2, and C.3 in Appendix C.
Using CPS-derived estimates of uninsured rates to compare geographically defined communities involves acknowledging some important methodological limitations related to the sample sizes of the CPS survey and the period of time over which coverage status is measured. For example, while the Committee’s focus would ideally be on communities no larger than a city or rural county, and perhaps an even smaller area, and on comparisons among areas on a yearly basis, the relatively small sample sizes of the CPS survey mean that the smallest type of community for which uninsured rates are estimated is the MSA of more than 500,000 population. To attain sufficient statistical reliability, these MSA-level estimates are based on a three-year average.
In addition, uninsured rates differ according to the length of time (denominator) over which the number of uninsured persons (numerator) is measured because of transitions into and out of coverage. For example, the 2001 California Health Interview Survey includes three sets of estimates for uninsured rates in the state,
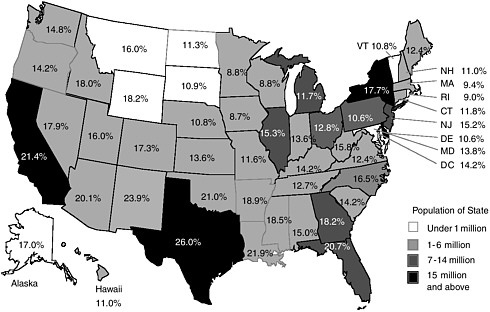
FIGURE B.2 Probability of being uninsured for population under age 65, by state, 2001.
SOURCE: Fronstin, 2002, estimates based on March 2001 Current Population Survey.
each of which gives a different picture of uninsurance: persons who report being uninsured at the time of the survey, or a point estimate (average 15 percent uninsured rate for persons under age 65, or about 4.5 million people); persons reporting uninsured status at any time in the previous 12 months (average 21 percent uninsured rate, 6.2 million people); and persons uninsured for the entire 12 months preceding the survey interview (12 percent, or 3.6 million people) (Brown et al., 2002). Many more people experience being uninsured for relatively short times than are captured in the point estimates made on the basis of data from the Census Bureau’s annual CPS (IOM, 2001a; Short, 2001). The median duration of an uninsured spell is between five and six months (Bennefield, 1998). Both the length and the frequency of uninsured periods vary with the source of coverage and among different populations. For example, persons covered under individual policies are more likely to experience an uninsured period compared to persons with employment-based coverage, and persons experiencing long periods of uninsurance are more likely to be lower income (earning less than 200 percent of the federal poverty level [FPL]) (IOM, 2001a).
SOURCES OF GEOGRAPHIC VARIATION IN UNINSURED RATES
Estimates of uninsured rates are available for regions or counties within most states. These estimates have been developed using a few different approaches. This
work has been facilitated by the State Health Access Data Assistance Center (SHADAC) at the University of Minnesota, to respond to federal interest in devising more accurate estimates for the purposes of allocating State Children’s Health Insurance Program (SCHIP) funds. Unlike CPS estimates of uninsured rates, these approaches yield estimates that are not directly comparable from state to state but rather are useful to illustrate the diversity of situations that exist within and among states. Much of the information that follows comes from states’ own health-related surveys, generated as part of their Health Resources and Services Administration State Planning Grant projects. These surveys may poll a sample of state residents directly, use a proxy measure such as the number of self-pay hospital discharges to estimate the size of an uninsured population, or create an analytic model to predict an area’s uninsured rate, based on data from variables such as unemployment rate that are known to be closely related to uninsured rate (SHADAC, 2002). Some of the larger states may have chosen to rely on CPS samples if they are considered large enough to give reliable estimates for regions, particularly metropolitan areas, within the state.
There is much variation in the dispersion and concentration of uninsured populations across regions, states, counties, and cities, and across rural, suburban, and urban areas. Regional, state, and within-state differences in uninsured rates reflect diversity in rates of employment-based coverage and the extent to which public programs and the individual health insurance markets cover persons who are not eligible for or do not participate in employment-based plans.2 These rates also vary in keeping with other socioeconomic and demographic characteristics of local populations.
Regional differences in economic base set the stage for differences in uninsured rates (Diehr et al., 1991; Holahan, 2002). In parts of Appalachia and along the southwestern border of the United States, for example, higher uninsured rates reflect the lower average incomes and higher number of employers that tend not to offer employment-based coverage to their workers.
-
Appalachia: Ohio’s southeastern counties are home to about one-fifth of the state’s uninsured population but have the highest uninsured rates in the state, 14.2 percent uninsured on average, compared to the state’s 11 percent average uninsured rate (figures for 1998; Dorsky, 2000). Both unemployment rates and average weekly income are strong predictors of uninsured rates in Ohio.
-
Southwestern border: For Texas, federal CPS data give the highest uninsured rate estimates for the border counties, although 75 percent of uninsured persons
-
live in nonborder parts of the state and are more likely to live in urban areas (State of Texas, 2002).
One of the few studies that has looked specifically at the role of the local economic base examines the experiences of adults under age 65 in 29 larger Wisconsin counties (Marsteller et al., 1998). Modeling each county’s uninsured rate as a function of the local economy, population demographic characteristics, and characteristics of the health services market, the authors find that the local unemployment rate is a key predictor of a county’s uninsured rate, tempered by relative economic fortunes (e.g., whether in a recession or an upturn in the business cycle) (Marsteller et al., 1998).
Differences in state public policies—specifically the Medicaid program, state insurance regulations, and to a lesser extent state, high-risk insurance pools (where they exist)—contribute to differences in uninsured rates (Cunningham and Kemper, 1998; Marsteller et al., 1998; Brown et al., 2000; Trenholme and Kung, 2000). For Medicaid, the breadth and generosity of benefits, eligibility rules, administrative difficulties in enrolling and maintaining enrollment, and extent of crowd-out of private coverage differ from state to state; each of these considerations influences a state’s uninsured rate. The proportion of a state’s population that is eligible for Medicaid also depends on the relative size of its low-income population or how income is distributed within the state (Holahan, 2002).
One way to measure the relative influence of state and local funding on uninsured rates is to compare the need for public coverage, or the proportion of persons without employment-based coverage, with the proportion of this need met through public coverage (e.g., Medicaid, SCHIP) (Holahan, 2002). A regression analysis of 50 states using three-year moving averages of uninsured rates (1997–1999) finds that differences among the states in their proportion of residents without employment-based coverage contribute to differences in state uninsured rates. For low-income populations (persons in families earning less than 200 percent of FPL), differences among the states in their proportion of low-income residents with public coverage also contribute to differences in state uninsured rates (Holahan, 2002). In 13 states during the same time period, states varied fourfold in their level of spending per low-income person (Holahan, 2002).
A state’s fiscal effort can make a difference in its uninsured rate. In two states with comparable proportions of residents lacking employment-based coverage (22 percent for Colorado and 18 percent for Minnesota), a greater fiscal effort by the State of Minnesota (45 percent of persons without employment-based coverage enrolled in public insurance) compared to Colorado (19 percent of persons without employment-based coverage enrolled in public coverage) resulted in an uninsured rate of 10 percent for Minnesota, compared with 17 percent for Colorado (Holahan, 2002).
Geographic differences in coverage rates also reflect the distinctive social, economic, and demographic profiles of communities and how these profiles intersect with the likelihood that members of constituent population groups (e.g.,
young adults, foreign-born residents, lower-waged workers) will be offered or will be able to afford to purchase private or public coverage. For example, in Florida, rural, ethnically diverse counties with smaller populations have the highest uninsured rates, as does urban Dade county, while the lowest uninsured rates are in counties with smaller cities and suburban populations and relatively low proportions of African American and Hispanic residents (Lazarus et al., 2000).
Within a locality or health services market, the presence of a diversity of culturally or linguistically defined communities also has implications for health, health services delivery, and community effects. Recent immigrants, members of racial and ethnic minority groups (e.g., Cuban, Filipino, African American, American Indian, and Alaska Native), and language minorities may have special service needs and patterns of utilization and insurance coverage, either for the group as a whole or for populations within the group. For example, across a low-income (less than $15,000 annually) cohort of 77 Spanish-speaking, Mexican American residents of El Paso, care-seeking patterns appear to be influenced both by insurance status (more than 60 percent report being uninsured) and by the accessibility of the local health care system, where there is a shortage of primary care providers (Parchman, 2002).
Finally, uninsured rates reflect differences in population density (Ormond et al., 2000b; IOM, 2001a; Rowley, 2002). Although uninsured rates nationally are about the same for rural and urban areas on average, and greater numbers of uninsured persons live in urban areas (given their greater population size overall), there is a diversity of patterns within states. Suburbs often have lower uninsured rates than the central urban neighborhoods of the major cities that they adjoin as well as lower rates than neighboring rural counties.
-
In some states, uninsured persons are relatively uniformly dispersed, so that the uninsured rates for different counties or regions do not differ appreciably from the average uninsured rate for the state. For example, Vermont’s 14 counties have uninsured rates similar to the state’s overall rate of 8.4 percent (State of Vermont, 2001). In contrast, Florida’s 67 counties range from 12 percent uninsured to 30 percent uninsured, with many significantly different from the state’s overall rate of 16.8 percent uninsured (Lazarus et al., 2000; 1999 data).
-
For many states, rural areas have fewer numbers of uninsured persons but higher uninsured rates, compared with more urban regions. In Oregon, urban Clackamus, Multnomah, and Washington Counties are home to almost 40 percent of the state’s uninsured population, but the highest uninsured rates are in the rural Gorge and Southwest regions (State of Oregon, 2001).
-
Where a state’s urban areas have higher uninsured rates than rural areas, the cities tend to be large and ethnically diverse and to have higher uninsured rates in their central cores compared to MSAs or suburban jurisdictions alone. For example, in Minnesota, the seven counties that comprise the Twin Cities MSA have a 5.3 percent uninsured rate similar to the state’s 5.4 percent uninsured rate overall. Excluding the populations of the central cities Minneapolis and St. Paul
-
(with uninsured rates of 11.0 and 9.5 percent, respectively) substantially lowers the uninsured rate for the rest of the MSA, to 3.9 percent uninsured (Gildemeister et al., 2002).
NATIONAL COMPARISONS
Two national studies use different data sets to compare uninsured rates among sites around the nation. The first uses estimates from the CPS in a survey of the 85 largest metropolitan areas in the United States (1998), finding a range of uninsured rates for 1998 between 7 percent (Akron, Ohio; Harrisburg, Pennsylvania) and 37 percent (El Paso, Texas) (Brown et al., 2000). Brown and colleagues use the MSA-level uninsured rates as an explanatory factor in a cross-sectional study of access to health care within communities. The second study compares 60 large, small, and nonmetropolitan areas (1996–1997) and finds a similarly broad range of uninsured rates, from 4.7 percent (Rochester, New York) to 28.9 percent (Miami, Florida), with the mean uninsured rate for the 12 sites with the highest rates (23.2 percent) almost three times the average for the 12 sites with the lowest rates, 8.6 percent (Cunningham and Ginsburg, 2001) (see Figure B.3 which depicts uninsured rates at a sample of these sites). The 12 sites with the lowest uninsured rates
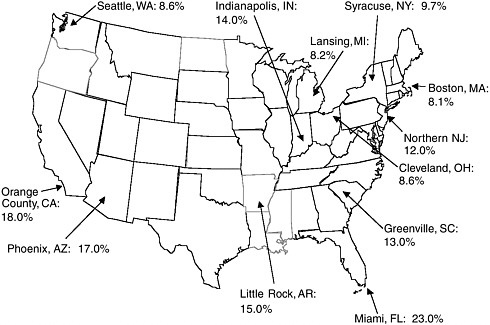
FIGURE B.3 Uninsured rates for persons under 65 years in selected urban areas, 2000– 2001.
SOURCE: Estimates from the Community Tracking Study, Center for Studying Health System Change.
are all either northeastern or midwestern metropolitan areas of more than 200,000 population, while the sites with high uninsured rates tend to be more heterogeneous and scattered across the South and West. In this analysis, differences among the sites are most strongly related to differences in the characteristics of individual residents (33 percent of the variation, mostly reflecting differences in racial or ethnic makeup, income level, and level of educational attainment), with differences related to job characteristics (e.g., number of workers in a family, whether full or part time work) accounting for 26 percent of the variation and differences in state policies regarding public insurance and social services of lesser influence (about 13 percent of the variation) (Cunningham and Ginsburg, 2001). Additional data about regional differences in employer characteristics, for example, the proportion of low-waged jobs or smaller-sized firms, both of which are associated with lower offer rates for employment-based coverage, might clarify the relative importance of these factors in shaping regional differences in uninsured rates.
Comparisons among states and regions are difficult to make using CPS estimates because the factors that covary with uninsured rates may be markedly different in different states and regions. In the Committee’s first report, Coverage Matters, a multivariate analysis allows for these comparisons through the use of “equalized” estimates. Differences among states’ uninsured rates diminish considerably if variations in the socioeconomic, demographic, and health status characteristics of each state’s residents are taken into account (IOM, 2001a).
The Committee’s analysis in Coverage Matters is a type of thought experiment that estimates what states’ uninsured rates would be if every state had the same socioeconomic, demographic, and health characteristics. Given the limits of any statistical model, one would not expect the differences among the states to disappear entirely with these adjustments, and indeed they do not. The remaining variation in uninsured rates—from 8.3 percentage points lower than the national average of 17.5 percent (for Hawaii) to 7.4 percentage points higher than the average (for New Mexico)—appears to exist independently of, and cannot be accounted for by, these measured characteristics.
Making this adjusted comparison nonetheless substantially revises estimates for some regions. For example, the four southwestern border states, all with uninsured rates 5 to 12 percentage points above the national average of 17.5 percent, would have much lower uninsured rates if the measured characteristics of their states’ populations matched those of the nation overall. New Mexico and Texas would have uninsured rates about 40 percent lower than those they actually do, and California would have an uninsured rate slightly below the nation’s average rate rather than one almost 5 percentage points higher (IOM, 2001a). For seven states, this analysis yields a higher adjusted uninsured rate estimate, with increases ranging from 37 percent (for West Virginia) to more than twice as high (for Washington).
In the “equalized” analysis described above, the factors that are analytically taken into account (e.g., race and ethnicity, income, educational attainment, immigrant status) contribute to the distinctiveness of each state’s circumstances.


