
3
Nature of the Problem: Sources and Limitations of METOC Knowledge
|
This chapter points out:
|
The discussion in the preceding chapter identified a large number of environmental parameters of interest to U.S. Naval Forces. These parameters affect, among other things, visibility, ocean acoustics, and the propagation of electromagnetic waves. If some determination of required environmental parameters can be made for any particular mission, the next question is “Can the values of the required parameters be determined at the particular time and place of the mission and to the requisite accuracy?” This question has no simple answer because, for any particular parameter, the answer is a convolution of many factors. These include:
-
The importance of the parameter to the specific concerns of a given naval mission, such as intelligence gathering, use of certain weapons systems, and aircraft operations. Some of the parameters may be mission critical; others may be of much less importance.
-
The accuracy and precision to which the parameter value must be known. In many cases, the parameter may have a critical threshold for making a go/no go decision. It may be sufficient to know the value with only modest accuracy when the value is far from the threshold but necessary to know it to high accuracy near the threshold.
-
The spatial and temporal variability of the parameter. In some cases, an average value over relatively large areas and long times may be sufficient; in other cases, pinpoint accuracy at specific times and places may be required.
-
The relative uncertainty of the predicted value. In practice, the decision to proceed with a particular naval mission depends on many factors, one of which is the environment. The role of the environmental factor in the ultimate decision process is determined in part by the certainty of knowledge of particular key parameters. The more certain the value, the more probable its use in decisionmaking.
One approach to dissecting this problem into manageable components is to sort and organize parameters by spatial and temporal scales and associated predictability. The following section discusses the relationship of mission time lines to physical knowledge. The next section focuses on predictability and model scale. The final section outlines data availability and its relevance to mission timescales.
IMPRINT OF PHYSICS ON MISSION TIME LINE
Figure 3-1 presents a schematic space-time diagram illustrating the spatial and temporal scales of variability of many environmental systems. Of particular importance in evaluating this diagram is development of an objective method for understanding present and future capabilities for predicting environmental conditions across different spatial and temporal scales. For example, at the largest spatial (global) and temporal scale (decadal), climatological data can be treated statistically to arrive at estimates of the state of the global environmental system for any interval of the present year. These statistics are largely probabilistic functions defining the likelihood that the system will be found to lie within defined bounds. At this scale of observation, present-day predictive skill is reasonably well developed. However, as the spatial and temporal scales of processes become smaller, the influence of nonlinearities in each environmental system becomes larger, resulting in greater uncertainty in the ability to predict the state of the environmental system. At the smallest time- and space scales, nonlinearities result in environmental processes that are dominated by stochastic processes such that
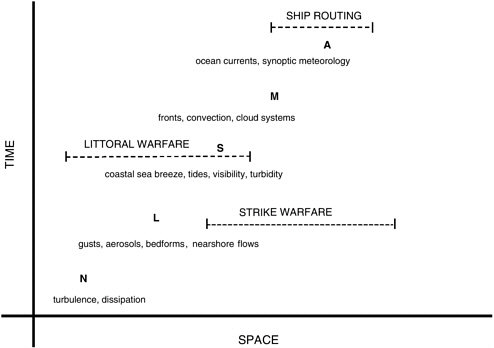
FIGURE 3-1 Schematic diagram showing the dominant spatial and temporal scales of physical motion in the ocean and atmosphere. The letters above the group of motions indicate the predictive skill associated with each: N—none, L—low, S—some, M— moderate, and A—acceptable. The overlap of some naval mission areas with specific ranges of time- and space-scales is shown. The range of model types used to simulate, forecast, and predict the various motions is shown along the bottom of the figure.
prediction is futile, and present-day capabilities rely on observation rather than modeling to describe the system.
The primary issue related to these scaling prediction phenomena concerns identifying the thresholds where reduced predictive power should be replaced with observational descriptions. A significant component of naval research into these areas would be beneficial because not only would it help establish additional constraints on understanding environmental information but it would also help shape assessment of the need for sensors and sensor arrays.
The range of physical processes in the ocean and atmosphere and the interactions between them are fundamental in determining the physical structure that is encountered at any time and location. Space-time diagrams (e.g., Stommel, 1963) provide a useful way to view the possible time- and space scales over which oceanographic and atmospheric processes operate. These scales typically cover many orders of magnitude and range from dissipative processes, which
operate over short time- and space scales, to scales associated with large-scale ocean currents and atmospheric systems.
The various time- and space scales associated with physical processes are not, however, independent of each other. Rather, these scales form a cascade through which information is transferred from large to small scales and vice versa. Consequently, perturbations introduced at one scale can potentially affect processes at a large number of smaller and larger scales.
The nonlinear interactions that occur between processes at different scales make predicting future states of the ocean and atmosphere a challenge. Atmospheric and oceanic numerical circulation models are constructed to include the specific dynamics that are related to particular ranges of time- and space scales. Global models treat processes at the largest scales but are forced by limitations in computer resources to parameterize all processes at the intermediate to small scale. Regional-scale models introduce processes that occur at larger scales via boundary conditions, such as the effect of large-scale ocean currents on regional flows, but still include the smaller-scale processes via parameterizations, such as turbulence closure terms in circulation models. High-resolution models include explicit representations of many small-scale processes but are often of limited value in a predictive sense because there are insufficient data to initialize the model accurately.
Due to the broad range of interacting time- and space scales, oceanic and atmospheric circulation models inherently provide a filter to the range of dynamics being simulated in any particular model. This characteristic (and limitation) has several important consequences. First, the predictive capability of any model is related to multiple factors, among them the scales that are being resolved in the model, the persistence of those scales in the ocean or atmosphere, and the quality of the initial and boundary condition data. Second, because of the nature of the cascade process and limits in our understanding of physical processes, predictive skill is generally better at larger spatial scales and the associated timescales. Third, the urgent need for initial and boundary condition information provides a strong rationale for developing data assimilative modeling efforts and acquiring data for input to these models. Without such efforts it is unrealistic to expect oceanic and atmospheric circulation models to have good predictive skill over a wide range of time- and space scales.
Areas of Acceptable Predictive Skill
Because of the wide range of oceanic and atmospheric scales of interest for various applications and the equally broad range of predictive skills, it is useful to introduce the concept of acceptable predictive skill. This concept is an attempt to merge our understanding of the predictive skill of a particular model with the needs of a particular application. For example, consider the problem of predicting hurricane landfall along the Atlantic coast. Currently, atmospheric models
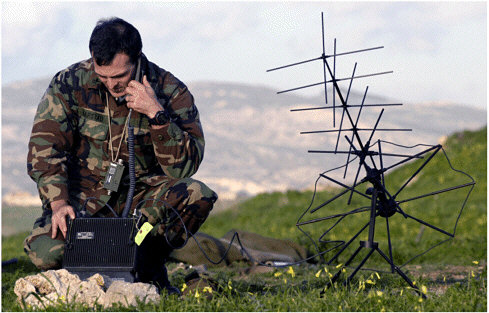
Radio communication with warfighters deployed inland can be adversely affected by local meteorological conditions. Phenomena such as electromagnetic ducting may allow signals to carry too far, allowing detection by opposing forces, or can disrupt signals sufficiently to pose tactical problems (Photo courtesy of the U.S. Navy).
exhibit considerable predictive skill on the 24- to 48-hour timescale but are much less skillful on timescales greater than 72 hours. If landfall predictions on the order of 24 to 48 hours are supporting decisions regarding when to put the fleet to sea, the current situation represents acceptable predictive skill for the Navy and no additional effort is required. If a longer warning time is needed, the Navy must consider what research, data, and financial resources are needed to make forecasts reliable on that timescale.
Some ranges of time- and space scales can be simulated with acceptable predictive skill for Navy applications. For oceanic systems these include the large-scale ocean current structure and long-term climate variability. For example, considerable progress has been made on forecasting the El Niño-Southern Oscillation (ENSO) in the tropical Pacific Ocean with lead times of 6 to 12 months. Intercomparisons of the models used for ENSO predictions show that the forecasts are considerably better than those obtained by simply using persistence of features to determine future conditions (Latif et al., 1998). Although the ENSO models have proven predictive skill, they still need improvement and development, especially in regard to specification of forcing fields, model initialization, and data assimilation capability (Stockdale et al., 1998).
Similarly, simulation of large-scale ocean currents, such as those obtained from the Ocean Circulation and Climate Advanced Modeling project (Saunders et al., 1999; Webb et al., 1998), show good agreement with observations. A recent test and intercomparison of simulations of the North Atlantic obtained from five numerical circulation models showed that all were able to simulate the large-scale current structure with a fair degree of realism (Chassignet et al., 2000; Haidvogel et al., 2000).
Global weather forecasts have shown substantial improvement over the past two decades, which has been quantitatively demonstrated by a variety of studies of model skill scores. The evolution of weather patterns can be predicted with skill on timescales of five to seven days, depending to some extent on season and latitude zone. Forecasts of severe weather events have shown a corresponding increase in skill. The use of satellite data in data assimilation models has brought significant improvement to ocean weather forecasts, particularly in the tropics and southern hemisphere where conventional meteorological data are sparse. These global models typically provide reliable information on the scale of 100 km and greater.
Areas of Moderate Predictive Skill
During the past decade much effort has gone into the development of oceanic numerical circulation models for simulation and prediction of regional-scale flows (e.g., Haidvogel and Beckmann, 1998). For some areas, regional circulation models have undergone testing in terms of their ability to forecast such features as ocean fronts (e.g., Robinson et al., 1996).
Most forecasting centers employ regional atmospheric models to provide higher-resolution forecasts over regions of interest. These models run nested into a global model (i.e., the global model provides the boundary conditions at the lateral edges of the nested regional model). Because of problems associated with the propagation of information from the boundary, these regional models typically provide skillful predictions on the order of 48 hours at resolutions of 20 to 40 km. The higher resolution captures mesoscale effects such as terrain variability and lake effects with greater fidelity than can be achieved with the global models. As computer capability increases, the tendency is to replace these regional models with global models of the equivalent resolution.
Areas of Some Predictive Skill
Because of the stochastic nature of small-scale atmospheric motions and the spatial scale of cloud processes, atmospheric models are limited in their ability to forecast the strength and timing of many severe weather events. A regional forecast model may be quite capable of predicting the conditions conducive to severe thunderstorm development and associated weather, such as hail or tornados, but

An Explosive Ordnance Disposal Technician, assigned to Explosive Ordnance Disposal Mobile Unit Five (EOD MU-5), leaps from a CH-46 “Sea Knight” helicopter during a static line water parachute jump over Apra Harbor, Guam. Atmospheric and oceanographic conditions are an important factor in ensuring the safety of personnel involved in such operations (Photo courtesy of the U.S. Navy).
cannot predict the actual location or timing of these events with great certainty. Sea breezes, which depend critically on relatively small-scale thermal gradients and near-shore terrain, are another phenomenon that can be predicted by models in a broad sense but can have significant errors in locally predicted values. In many cases, experienced forecasters who are familiar with the performance of the typical forecasting models can correct these model errors based on their own knowledge.
Similarly, because of the scale and variability of surface-atmosphere interactions, boundary layer development and modification are predicted less well than free tropospheric properties. This affects model predictions of a variety of smaller-scale processes, including boundary layer cloud, radiation fog, and local precipitation. Aerosol production at the sea surface and aerosol lofting and transport are also affected negatively by this problem.
Areas of Low or No Predictive Skill
A variety of high-resolution atmospheric models are used to study cloud development and boundary layer structure. These models typically incorporate very detailed representations of both dynamics and cloud processes. Their output, however, is largely statistical in nature and not predictive in a deterministic sense. This arises from two principal causes. First, there are no observation grids that supply data with sufficient temporal and spatial resolution to reliably initialize and force the model. Second, turbulence and convection are inherently stochastic processes that introduce randomness into any simulation. Thus, it is unlikely that we will ever be able to predict the exact nature of boundary layer structure and cloud formation on small time- and space scales.
DATA ACQUISITION
Environmental data used by the Navy for various purposes can come from many sources. The Naval Oceanographic Office (NAVOCEANO) operates a fleet of oceanographic survey ships to collect information from the seafloor, ocean surface, and water column. The TAGS50 and TAGS60 class ships provide multipurpose oceanographic capabilities in coastal and deep ocean areas, including physical, chemical, and biological oceanography; multidisciplinary environmental investigations; ocean engineering and marine acoustics; marine geology and geophysics; and bathymetric, gravimetric, and magnetometric surveying. Much of the data collected by this fleet are permanently archived in databases maintained by NAVOCEANO. Many of these data are compiled and written to CD-ROM on an as-needed basis to accompany OA1 officers as they embark on tours of duty. Typical archival datasets carried onboard fleet assets in this way might be regional tide/lunar tables covering the operating area, archival bathymetric data, digital nautical charts and digital terrain models of coastal regions or islands, and ocean/ water column and atmospheric climatologies.
Data systems that are being developed for the METOC community are focused on access to meteorological and oceanographic data and products generated by the Navy and/or passed through naval [and in some cases other Department of Defense (DOD)] data centers. There is little to no consideration in the development of these systems for direct access to data that are generated and held outside DOD despite the use of such data sources via standard Web browsers by METOC personnel in recent naval operations. Historically, this focus has made sense in that access to near real-time data and/or data products has been provided by a small number of government data centers, greatly facilitating the task of providing access to these data via a single system. There is, however, a clear
trend toward increased development of and open access to real-time data and data products in the commercial and non-DOD research sectors (this is explored more fully in Chapter 4).
A large area of the world surface and ocean environment, however, remains sparsely instrumented, so in situ data needed to initialize and run regional models may not be available. Strategies to develop sensors or sensor arrays for collecting data in these regions will need to be developed. The U.S. Navy’s remote sensing program focuses on tactically significant information in the littoral regions. Environmental sensors on existing satellites are being exploited to the greatest extent possible, and new capabilities, such as those offered by WinSat and hyperspectral imagers, are under development. Environmental sensors on airbreathers, surface ships, and undersea systems appear to be underutilized, as are environmental data that can be extracted from sensors being deployed for other-than-environmental missions.
IMPEDANCE MISMATCH FROM DATA SOURCE TO WEAPONS SYSTEM: AN EXAMPLE FROM UNDERSEA WARFARE
Environmental information for undersea warfare primarily concerns understanding how the ocean impacts acoustic propagation and the design and performance of Navy sonar systems. Sonars are usually divided into passive, which exploits radiated sound from a source, or active, which uses echoes to resolve the range and Doppler shift of a source. Support for both passive and active antisubmarine warfare (ASW) missions dominated funding for environmental characterization during the Cold War. It still does, but with the emphasis now on littoral waters instead of the historic focus on deep water. Moreover, the shift of Navy missions toward the littoral has placed increased emphasis on mine countermeasure (MCM) systems as well as torpedoes.
There are many different platforms and missions, so an overview is useful for organizing the discussion. The platforms specifically relevant to undersea warfare can be divided as follows: submarines, surface ships, aircraft, and surveillance systems. Furthermore, the missions of each can be listed: for submarines, self-defense, ASW, antisurface warfare, ISR (intelligence, surveillance, and reconnaissance), CVBG (carrier battle group escort), Naval Special Warfare and deployments, clearing contested areas and commercial shipping routes, and forward strike (cruise missile launching). The undersea warfare for surface ships, typically cruisers and destroyers, concerns self-defense, ASW, and CVBG escort. Aircraft, both maritime patrol aircraft and helicopters, are almost solely concerned with ASW operations. Similarly, the Integrated Undersea Surveillance System, including fixed assets such as the remnants of the SOSUS system, the ADS advanced deployable system, the fixed deployable system, and SURTASS (Surveillance Towed Array System) are concerned with both ASW and commercial ship surveillance.
The emphasis in this section is on environmental support for ASW-related operations; nevertheless, MCM and weapons systems are also important Navy missions. In comparison to ASW, these sonar systems do not use a lot of environmental information with the exception of seabed characterizations for reverberation predictions. The complexities of the littoral will require more environmental support to improve the performance of these systems.
Scales for Environmental Characterization
Spatial and temporal scales are very important aspects of environmental data needed in undersea warfare. High-resolution geoacoustic data acquired over large areas are costly and time consuming. GDEM products represent a long-term NAVOCEANO effort for seafloor characterization. Uncertainties about the seafloor are a dominant issue in transmission loss calculations. The water column and sea surface are dynamic processes whose prediction has also been a long-term objective of NAVOCEANO. The MODAS effort fuses archival databases, satellite altimetric data, circulation models, and in situ data for these predictions. The needed scales for accurate predictions are fundamental and still very much of a research issue. The often-stated assertion is that lack of high-resolution environmental data is the major deficiency for predicting the performance of a sonar. While this overstates the current capability in acoustic modeling, the statement misses an important point. One really wants to identify the spatial and temporal scales where robust predictions are possible.
Another important aspect of the use of environmental information is the time and spatial scales for predictions. Atlases, databases, and climatology are important for general assessments, mission profiles, and the regional environment. Tactical needs are much more specific, but they can exploit real-time in situ measurements such as sound speed profiles, ambient noise distribution, and areas generating significant backscatter or acoustic reverberations. This context is the one that stresses current prediction tools. Finally, postanalysis and evaluation of new algorithms use all available data. Without the urgency of real-time decisionmaking, tradeoffs involving environmental uncertainties can be done.
Environmental Components of Undersea Warfare
The requirements for shallow-water (i.e., bottom-limited) acoustic predictions transcend predicting propagation loss and reverberations; the data must be presented to the operators in a usable manner. Since today’s sonars have sufficient power to be able to project sound well beyond the first bottom interaction, multiple zones of potentially useful ensonification occur with each ping. The challenge is to present that to the operator in a way that enhances exploitation.
The concept presented in this chapter of the stochastic nature of the environment and its characterization in models, is especially valid when it comes to
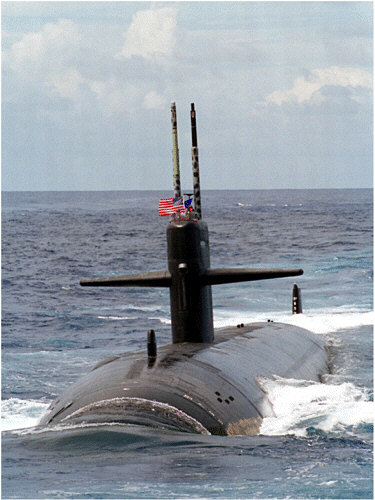
The nuclear-powered Los Angeles class submarine USS Key West (SSN 722) conducts surface operations. The boat is part of the aircraft carrier USS Constellation (CV 64) battle group en route to the Arabian Gulf to enforce no-fly zones and monitor shipping to and from the region. Understanding how ocean and seafloor conditions affect acoustic properties can provide important tactical advantages to U.S. Navy submarines engaged in protecting surface vessels or other assets threatened by enemy submarines (Photo courtesy of the U.S. Navy).
acoustic propagation and prediction. Ping-to-ping variations are well documented and render all conversional prediction systems, which use signal excess as a measure of probability of detection, invalid. Note: The ASW world is already used to dealing with predictions stochastically since it is “probability of detection” and not “certainty of detection” that is dealt with. It is entirely possible that this nuance is lost on many operators who take terms such as “range of the day” literally. The same is true in weather forecasting, where such terms as “strike probability” and “chance of rain” are often misunderstood. Since these types of uncertainties are the norm in natural systems, emphasis should be on understanding and exploiting this characteristic.
The components of the sonar equation provide a useful guide to the way environmental information is used in undersea warfare. For passive systems:
SE = SL − TL − NL + AG + SPg − RD
where SE is the signal excess, SL the source level, TL the transmission loss, NL the ambient noise level, AG the spatial array gain, SPg the signal processing gain, and RD the recognition differential. For active systems in a reverberation-limited environment:
SE = SL − 2*TL + TS − RL + AG + SPg − RD
where SL is now the power of the active source, TS the target strength, and RL the reverberation level. The environmental components are TL, NL, and RL and to a lesser extent AG and SPg.
Prediction of the effects of the environment on transmission loss has long been a goal for Navy systems. In its simplest context this led to the “range of day” figure of merit. The problem now, especially in shallow water, is recognized to be more complex than just a single number. A number of propagation codes exploiting Navy databases such as SFMPL and PCIMAT are now available and can be run onboard. Most of these use a parabolic equation method that is a narrow-band, range-dependent code. The water column, surface, and bottom can impact TL, so the problem can be quite complex. One of the important goals of NAVOCEANO is to provide the environmental databases and prediction tools for accurate predictions of TL. The claim is an accuracy of ±2 dB when in situ sound speed is well known and good bottom models are available. Operationally, such performance is not routinely achieved.
Predictions of TL for deep-water RR (refracted/refracted) and RSR (refracted/surface reflected) are easier because the bottom is not involved. These paths were very important for long-range submarine detection during the Cold War. Significant problems appear when there is a significant number of bottom interacting paths (i.e., not enough excess depth). For deep water and short ranges there are usually two dominant paths between a target and a submarine array—
direct paths refracted and/or reflected from the surface and bottom bounce paths. Direct paths are relatively easy to model for TL. The bottom bounce paths are very difficult to model and the uncertainty is very high. This leads to problems for predicting the performance of an active bottom bounce sonar. For a submarine, changes in bottom loss manifest themselves as the part of the TL plot versus range where there is cylindrical spreading. Large changes in range lead to relatively small changes in TL, so there is a lot of uncertainty about counterdetection ranges. Currently, TL predictions when there are bottom interacting paths are not considered very reliable.
Reliable TL predictions are not available for littoral shallow waters. There are many examples where the differences among model predictions and calibrated experimental data differ more than 10 dB. Shallow-water environments are currently the dominant regions for naval operations; therefore, this is a significant problem. Horizontal propagation in shallow water is dominated by the seafloor. Steep paths, or high-order modes, above the critical angle are rapidly attenuated. The near grazing paths, or low-order modes, propagate with a complicated dependence on the bottom. Separating the effects of attenuation due to absorption, scattering, and shear conversion losses is difficult. The parabolic equation approach does not account for variability due to oceanographic processes and the seabed. Including variability in prediction models is an ongoing research issue for TL. Overall, implementing the correct geoacoustic model of the seabed in shallow water for TL still has many unresolved problems.
The current NAVOCEANO approach uses broadband measurements on a line with increasing separation between source and receiver. Stratigraphic models are based on reflection/refraction profiles. Genetic algorithms are then used to tune the layer parameters of a geoacoustic model such that there is less than ±2 dB frequency averaged difference between the parabolic equation and 1/3 octaves of the broadband data. The fundamental issue is how robust this approach is and how detailed must the databases be to lead to accurate TL predictions.
Ambient Noise
Beyond TL the ambient noise environment is the second major factor in ASW performance. Ambient noise can be divided into two major components— the diffuse ambient background and strong discrete interference from shipping. The diffuse component represents unresolvable distant shipping and wind/wave surface-generated noise. “Discretes” are signals from high shipping noise, geophysical seismic exploration, and biological sources. (Vocalizations from whales and seismics can be the major contributor to ambient noise in some regions depending on the season.) The often-termed “clutter” leads to “stripes” on bearing time displays since they are typically at long ranges and have small bearing rates. Because of their high levels, these sources do interfere with detections, especially if a target also has a low bearing rate. Ambient noise databases are
maintained (e.g., the HITS database for commercial shipping is often used for modeling discrete shipping noise, while the ANDES [Ambient Noise Directionality Estimation System] and DANES [Directional Ambient Noise Estimation System] models are used for the deep-water diffuse noise levels).
Ambient noise in the littoral is a much more complicated issue. The ranges are typically shorter, so fishing fleet and other coastal traffic become strong contributors. While there are seasonal trends for fishing, databases comparable to HITS are not available. Moreover, the complexities of littoral acoustic propagation lead to modeling problems for prediction models.
Ambient noise is important for several aspects in sonar performance predictions. First, one obviously wants to understand regional levels, so as not to operate where a target is in the same sector as high levels of ambient noise—quiet beam sectors are important. Next, in deep water ambient noise often has a vertical distribution with a noise notch at near grazing angles that can be exploited. At any time there are many discrete clutter lines whose exact bearings cannot be predicted; nevertheless, prediction of their distribution is important. Finally, many of the advanced beamformers such as those used for the evolving ARCI [Acoustic Rapid COTS (commercial-of-the-shelf) Insertion] systems are based on noise cancellation algorithms whose performance strongly depends on the distribution of the discrete components of the ambient noise field to improve the array gain term in the sonar equation.
Ambient noise levels enter the sonar equation just as TL does; however, models and databases especially for the littoral have not kept pace and have not received a comparable level of effort.
Reverberation
Active sonar systems usually operate in a reverberation-limited environment. Increasing the power in such an environment not only increases the echo return from a target but also the level of interfering reflectors such as the seabed, sea surface, and fish. The only way to improve performance in a reverberation-limited environment is by signal design. Reverberation from the bottom is by far the most important in most Navy sonars.
Reverberation is characterized in terms of the scattering strength or rms level per unit area. The scattering strengths as a function of frequency and angle of incidence of many regions have been measured. Data from many important operational areas, however, are not available. The SABLE [Sonar Active Bottom Loss Estimate] program addresses reverberation characterization by making “through the sonar” measurements with operational sonars.
Reverberation in active systems is the equivalent of ambient noise for passive ones. Scattering strength is a very simple description that misses many of the important issues in predicting performance. Discrete reverberation appears as “highlights” and possible false detects. There is also significant local variability
within a geological province. At low frequencies and low sediment cover, detailed bathymetry enables good predictions. At higher frequencies and sedimented areas typical of littoral operations, however, this becomes more problematic since the wavelengths are shorter and geoacoustic models are not available. Moreover, the acoustics of some of these models are often in doubt because of buried features.
An important question in ASW concerns the limits of passive systems leaving active systems as the alternative. While reverberation has received significant attention throughout the development of the SQS-53, LFA (Low-Frequency Acoustic), and LFAA (Low-Frequency Active Adjunct) systems, existing databases are not adequate for good predictions and much remains in understanding the geologic control on seafloor acoustics.
Platform-Specific Issues
Submarines
The undersea environment dominates the operation of a submarine. Characterizing the in situ sound speed profile and local bathymetry is crucial for predicting the performance of a submarine sonar and the ability to fulfill the self-
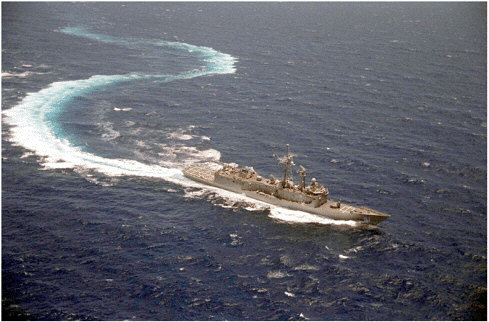
The guided-missile frigate USS McClusky (FFG 41) conducts a tight navigational drill. Frigates fulfill a “Protection of Shipping” mission as anti-submarine warfare combatants for amphibious expeditionary forces, underway replenishment groups, and merchant convoys (Photo courtesy of the U.S. Navy).
defense, ASW, and CVBG escort roles and for clearing contested areas and shipping lanes. A submarine uses several passive arrays for detection and tracking. These include the sphere (BQQ-5) operating from 1.5 to 7.5 kHz, conformal (hull) arrays, several towed arrays (TB-16, TB-23, and TB-29) operating below 1 kHz, and on some boats the WAA (wide aperture array) for wide-aperture ranging.
Detection ranges for undersea warfare have decreased significantly to the order of tens of kilometers because of adversary stealth and quieting plus the introduction of quiet diesels operating on batteries. (This problem becomes even worse with the introduction of air-independent propulsion systems.) No longer can tens to hundreds of kilometer ranges be maintained with lots of time to maneuver. With such short detection ranges many issues become more significant: (1) ship safety (avoid a collision); (2) counterdetection (crucial for self-defense); and (3) rapid and tight maneuvers to maintain tactical advantage, which severely degrades towed array performance. All these issues place a premium on accurate predictions of transmission loss and the uncertainty associated with them. It should be noted that the shorter ranges imply less reliance on long-range refracted-reflected and refracted-surface reflected paths and more on bottom-interacting paths. The important environmental issues concern the available databases and tactical decision aids (TDAs) to use them.
For other missions, such as intelligence, surveillance, and reconnaissance (ISR) operations, special forces insertions, and forward strike, environmental information is crucial for navigation, safety, and maintaining stealth.
Surface Ships
Surface ships employ both active and passive systems. A forward cylindrical array (SQS-53) operates in both the active and passive modes. Towed arrays (SQR-19) are used as well. Surface ships have most of the same missions as submarines. They have the advantage that stealth is not an issue; thus, active sonar can be used, although the absence of stealth is a disadvantage for self-defense. All the same issues for submarine passive sonar are present in surface ship passive sonars, so the need for databases and TDAs is much the same. The active systems must contend with reverberation that dominates system performance in littoral waters. Unfortunately, good databases and TDAs for reverberation predictions are not available in many operationally significant regions.
Air ASW
Air ASW involves deploying hydrophones or arrays of hydrophones from MAP or helicopters. Generally, they are short-range systems for localization. Over time these systems have evolved from single-hydrophone sonobuoys to directional sonobuoys (DIFARS) using gradient sensors, vertical line arrays (VLADS), and horizontal arrays (ADAR) for passive systems. Active systems
have evolved from single-sonobuoy sources and receivers to long-range systems integrated with surface and submarine sonars.
Surveillance
For many years the SOSUS (Sound Surveillance System) network of cabled horizontal arrays on the seafloor was the key component for long-range ASW. An extensive amount of environmental information was used to model the performance of these arrays. Most of our knowledge of long-range acoustic propagation is the result of support for SOSUS. Much of the SURTASS (Surveillance Towed Array System) system was abandoned at the end of the Cold War. Moreover, detection ranges from SOSUS decreased significantly as the result of quieting.
SOSUS has now been been supplemented by SURTASS, a system of large-aperture towed arrays. In addition, the FDS, a large network of fixed seafloor arrays, and ADS, a rapidly deployable network of seafloor arrays, have been deployed and/or tested. Recently, SURTASS has been augmented with an active component forming the LFAA (Low Frequency Active Adjunct) system. The important issue is that the same requirements for accurate predictions remain— that is, good TL estimates and robust ambient noise models.
The LFAA, and more generally the use of all operational active systems, recently added another dimension. The need to predict the impact on marine mammals has become an emotional public debate, so much so that the operation of an active system is called into question. Prediction levels received from an active source by a mammal and background ambient noise levels are major issues in the debate.
SUMMARY
The spatial and temporal scales of various environmental processes may have a profound effect on efforts to predict future states. Areas where inadequate predictive skill is of concern require greater numbers and more recent observations, to either support data assimilation or supplant predictions altogether. Determining what level of accuracy is needed in predicting future states of some environmental phenomena is severely limited by a clear understanding of the sensitivity of platforms and personnel to various environmental conditions. Thus, before rigorous efforts at setting data acquisition priorities can be completed, a fuller account of the impact of various processes on naval operations must be acquired. The General Requirements Database is a good first step, but greater and more clearly defendable establishment of critical thresholds, including compound effects from multiple environmental processes, is needed. With this information in hand, efforts to weigh the benefit of additional information against the cost of acquiring it could be undertaken.


