
2
Public Sector Applications of Remote Sensing Data
This chapter discusses some of the ways that state, local, and regional governments use remote sensing data and information. In a few cases, the use of satellite remote sensing data and information is becoming routine; in others, remote sensing applications are still experimental but are of growing interest to both technical staff and managers and decision makers in the public sector.
No one knows the information needs of state and local governments better than the people working in those governments. For this reason, the steering committee invited representatives of nonfederal jurisdictions to the workshop, where speakers discussed how remote sensing data and information are being introduced and integrated into their operations. Their accounts of the problems encountered and overcome in specific state and local governments can help other public officials better understand and envision ways that remote sensing might be of use in their own operations. In each case study, the steering committee examined how remote sensing data and information are used, the special advantages or characteristics of specific applications, and the problems encountered. The case studies are divided into three groups: local government applications, state government applications, and regional applications. Local government case studies are drawn from the experience of Baltimore, Maryland; Richland County, South Carolina; and Boulder County, Colorado. State case studies are from Missouri, North Carolina, and Washington. Regional studies are from Portland Metro in Oregon and the Red River Valley of North Dakota and Minnesota.
LOCAL GOVERNMENT USES OF REMOTE SENSING
Local government planning, management, and operations provide fertile ground for new applications of remote sensing data and information. Because they are responsible for geographically small areas that often have high population densities, city and county governments generally require high-resolution spatial data for a number of purposes such as cadastral or mapping applications, identification of changes in land use, and maintenance of the transportation infrastructure. Although local governments relied on aerial photography for high-resolution data in the past, some are finding that satellite remote sensing data are now available at similar levels of spatial resolution with broader spectral coverage. Many city and county governments already have in-house GIS capabilities; data from satellite remote sensing, like data from some forms of airborne remote sensing, can be used in conjunction with digital data available in existing GIS databases. The possibility of integrating remote sensing data into local GIS databases and using the databases in conjunction with locational GPS data has created opportunities for new types of information applications that were not possible using photographic remote sensing data alone.
Baltimore, Maryland: Introducing Remote Sensing to Urban Planning
The city of Baltimore initially looked to remote sensing to obtain urban data for a state map of forested areas in Maryland and to update the city’s planimetric maps.1 City planners had long depended on 19th- and early-20th-century maps for information on building and street locations in the city. In the 1980s and 1990s, as GIS software became easier to use, there were efforts in Baltimore to develop an integrated GIS, accessible to all agencies in Baltimore City, that would support planimetric map production and allow for GIS analysis. This effort was not initially successful. The early GIS products seemed crude next to the old-fashioned but artistically designed planimetric maps, and few people knew how to use GIS products for analysis. However, GIS offered the possibility of providing digital data for spatial analysis and decision making, as the static and inflexible planimetric maps, with their emphasis on fixed physical structures in the built environment, did not.
The city took its first steps into the world of remote sensing in order to obtain data for a map of vegetation cover. Maryland had acquired Landsat data to create a “greenprint” that identified the state’s larger forests. The state’s forest identification methodology, when combined with the resolution of the Landsat data, caused the urbanized areas of Baltimore City and Baltimore County to become blank spots on the state’s forest map. Because Baltimore had forested areas in its
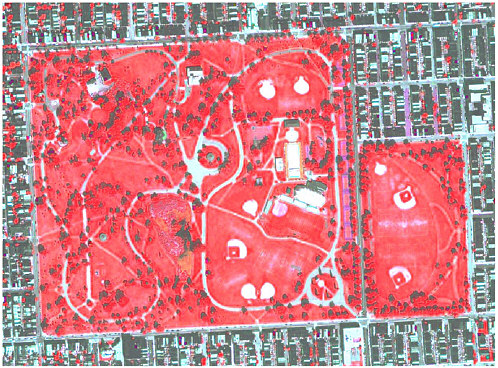
FIGURE 2.1 IKONOS 4-meter multispectral image of Patterson Park, Baltimore City, Md. Darkened background shows chlorophyll reflectance, which indicates areas of vegetation (e.g., grass and trees). SOURCE: Baltimore City Department of Planning.
parks, including small stands of original forest, city officials wanted urban forests to be mapped as well. With a grant from the Forest Service of the U.S. Department of Agriculture, Baltimore planning officials and the Maryland Department of Natural Resources (DNR) collaborated to obtain IKONOS imagery—high-resolution satellite images produced by the private sector that the city could use to map its forested areas (Figure 2.1).
Once the remote sensing data were in hand and DNR had extracted the vegetation from the image, Baltimore officials recognized that there were many other uses for the data, and today they are using them to create a land use map of the city for development, environmental, and social purposes and for updating the planimetric maps. The city is also planning for new applications in such areas as flood plain mapping, watershed planning, and identification of viewsheds.2
The city of Baltimore, like many older urban areas, by law cannot annex land, so it is under pressure to use its existing resources more efficiently. Urban planners in Baltimore recognize that better spatial information on the physical and social attributes of the city, which can be provided by remote sensing data used in conjunction with other types of urban data in a GIS framework, can help in policy making for economic development.
Advantages Enjoyed by Baltimore
Baltimore has realized a number of advantages by introducing remote sensing data and moving into more advanced spatial data management for planning. The mayor is a firm supporter of data-based decision making and is interested in improving the city’s spatial database and expanding the availability of maps and spatial data. This has been very helpful to urban planners trying to incorporate remote sensing data into decision making. Baltimore was also ultimately able to obtain support from the federal government for its initial acquisition of remote sensing data, so it did not have to make a cash outlay for a new type of data.
Issues Raised by the Baltimore Experience
Among the first issues Baltimore planners faced was how to finance the purchase of new remote sensing data and the construction of digital geospatial databases. The city had had no previous experience in purchasing this type of data. One major question was whether this should be a capital or an operating expense. Another was what agency or office should be responsible for the procurement. In the end, because of the difficulty in identifying funding sources, waste and wastewater funds in the city’s Department of Public Works were used to create a GIS database that incorporated panchromatic imagery. Funding the city’s data acquisition through a single agency raised a further problem, however—namely, the GIS was developed more for producing a planimetric map than for analysis and decision making. In part because of these issues, the Department of Public Works did not release the data to other potential users for 2 years.
Another problem was that Baltimore had limited technical experience in remote sensing and was unlikely to be able to increase its technical staff in the future. Many of Baltimore’s employees with geospatial knowledge had learned about GIS and remote sensing technologies on the job. For some purposes, the city has issued contracts for technical services to groups at the University of Maryland or to individuals and consulting firms outside the city government. Though this is not uncommon in state and local government, it means that the city has to ensure that it has people on staff with enough training to define the city’s data and information needs, manage external contracts effectively, and conduct quality control and assurance of the data.
Moreover, although the mayor of Baltimore supports mapping and the use of
GIS, the Baltimore experience suggests that it is also important to have a wide range of public sector managers and elected officials who are persuaded of the utility of digital spatial databases and remote sensing. These are the people who decide how to invest the city’s funds and who serve as gatekeepers for the adoption of new technologies like remote sensing. It takes time and experience for local officials to understand and use new types of spatial data and information. Reaching and persuading these people—the real end users of the information—of the utility of remote sensing is critically important in implementing such applications in local government. At this stage, Baltimore urban planners believe that they need to demonstrate to government officials that multiple information products can be obtained from a single remote sensing image. They believe they can persuade decision makers of the utility of the data by providing them with cost-effective products that improve management and decision making in the city.
Baltimore planners attending the workshop also emphasized the need for continuity in remote sensing data: If the city has only one remote sensing data set (data valid at only one point in time) and cannot obtain comparable data in the future, the utility of the remote sensing data and information for policy and decision making will be limited. Continuity of data sources is critical for local government applications.
Richland County, South Carolina: Expanding the Uses of Remote Sensing
Richland County, which includes Columbia, the capital of South Carolina, is a leader in the use of remote sensing data and combines remote sensing with a wide array of other geospatial technologies. It finds remote sensing data, including satellite remote sensing, digital orthophotography, and lidar, critical in monitoring urban sprawl for smart growth policies and creating “fly-through” presentations that allow city and county officials to see the impact of specific construction and development projects (Figure 2.2). The county also uses remote sensing for managing its data on county infrastructure and monitoring the condition of pavements, floodplains, and land cover. It uses remote sensing for floodplain analysis; identifying, monitoring, and delineating wetlands; hydrologic modeling; and disaster response and mitigation. These many uses of remote sensing data in Richland County are integrated into the county’s GIS system, and the resulting databases are enriched with digital photography and GPS.
Advantages Enjoyed by Richland County
Richland County has the people, the equipment, and the data in place to demonstrate the cost savings and superiority of remote sensing over other types of information in specific cases. For example, when a large telecommunications
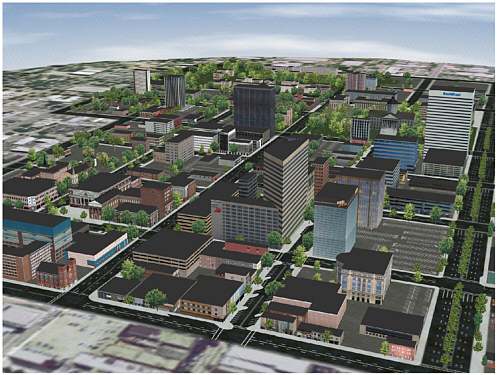
FIGURE 2.2 Urban three-dimensional model developed by Richland County, S.C., using advanced remote sensing/GIS techniques. Surface elevations, vegetation dimensions, and building outlines and heights were calculated using raw lidar points and high-resolution orthophotography. Building facade textures were added using oblique digital photography.
firm was exploring the possibility of constructing a plant in Richland County, it asked the county to supply surveyors for a rapid assessment of land contours in the area—a 45- to 90-day job. Instead, using lidar data, the county GIS office was able to supply the necessary contours overnight, demonstrating cost savings of $140,000 for the county and technological efficiency to the potential investor.
Another advantage of Richland County’s experience with remote sensing is that it assigned a county GIS office responsibility for the management of all geospatial data and information. This promotes the integration of multiple types of spatial data technologies and the creation of new data products for decision making. Equally important, it provides a visible point of contact for geospatial information within county government. The county GIS office is the institutional focus for budgeting, hiring technical personnel, and obtaining new data, equipment, software, and training in remote sensing and GIS.
Issues Raised by the Richland County Experience
If one of the strengths of the Richland County experience is having a single office to deal with all spatial data and technologies, including remote sensing, one of the issues that must be dealt with in the county is the division of labor among users of remote sensing data. County planners, public works engineers, economic development experts, and state officials who work with the county are all potential users of remote sensing data, but few of them have the background to understand when and where remote sensing can be applied in their own work. Without an understanding of the potential utility of remote sensing, they cannot know the potential benefits of the data for certain tasks or demonstrate them to others. Even remote sensing enthusiasts in local government admit there is a certain inertia in some sectors of their organizations such as permitting and land management. These sectors remain uninterested in remote sensing applications because traditional practices are effective and not easily replaced. In Richland County, the emphasis was on developing remote sensing applications for those areas where remote sensing could make an immediate contribution, not on serving all sectors of local government simultaneously.
For Richland County, as for many urban counties and cities, the valuable high-resolution data from commercial satellites are often too expensive for local governments to consider, particularly when the purchase of data is just one of the expenses associated with building a remote sensing and GIS capacity. Other expenses are for hardware, software, permanent staff, and training. In the past, local governments periodically spent large amounts for airborne data or surveying, which fitted into the experience of financial officers better than expenditures for a new technology that initially appears to be largely visual. The capacity to demonstrate financial and operational benefits—that is, savings of both money and time—was seen by workshop participants from Richland County and other local governments as essential to the successful introduction of remote sensing into local government. As state and local government revenues decline in the midst of a slow economic recovery on the national level, many workshop participants reported that public sector budgets are under strong pressures to constrain expenditures. As a result, cost savings will be a critical component of any new public sector remote sensing activities.
A related problem that arose in Richland County is how current commercial licensing practices can limit local government uses of commercial remote sensing data. Financial need leads many public sector agencies to seek ways of sharing the cost of new data across a number of agencies, so that the data are often used and reused for multiple purposes. This type of data sharing across agencies and government units can be limited by licensing restrictions if the data originate in the private sector, as do many of the high-resolution data sets for urban and suburban uses.
Another problem related to licensing came up in the discussion of the
Richland County experience—namely, that public agencies may be asked for their data by members of the public under the Freedom of Information Act (FOIA). Although disclosure is required by law, it is not clear whether the agencies must comply with such requests if the data are acquired under commercial remote sensing licensing restrictions.
Still other issues that arose in Richland County include the need for common standards across all counties so that the data in multiple jurisdictions can be compared and integrated into multijurisdictional databases; problems of data storage (Richland County already has one terabyte of data and is expanding its holdings); and legislation to limit the use of spatial technologies such as remote sensing and GIS in South Carolina.3,4
Boulder County, Colorado: Finding a Way
Boulder County began to use spatial data in 1987 to maintain and upgrade tax maps of parcels in the county.5 From what was a modest beginning, the county now uses spatial data for a broad range of purposes, from locating prairie dog colonies to identifying wetlands to tracing fence lines. The county uses various types of remote sensing data in conjunction with GIS data in applications in public health, land use, parks and open space, road maintenance, and even redrawing precinct boundaries as population distribution changes.
Boulder County obtains its remote sensing data from Landsat; the Système pour l’Observation de la Terre (SPOT), a French remote sensing satellite; the Indian Remote Sensing Satellite (IRS); and aerial photos. The Indian remote sensing data are marketed in the United States by Space Imaging, Inc., a private firm, and SPOT data by another commercial entity, Spot Image. The county also creates its own data on roads, streams, and parcels.
Advantages Enjoyed by Boulder County
In order to create a single county data interface for remote sensing and other spatial data applications in the public sector, Boulder County groups interested in spatial data organized BASIC (Boulder Area Spatial Information Cooperative). The cooperative has separate agreements with 30 to 40 public sector agencies, organizations, and jurisdictions in the region to provide unrestricted access to its data for BASIC member institutions. BASIC operates a distributed geospatial data and software capability for its members. Each participating agency or organization has its own GIS staff but draws on BASIC for software and some of its remote sensing data. When a public sector department or member jurisdiction does not have access to the common server or uses some form of dial-up access, BASIC may need to buy an extra copy of the data. In short, BASIC allows Boulder County to aggregate its members’ needs for data (other than commercial, licensed data) into a single purchase, saving all the member jurisdictions money, avoiding duplication of data purchases, and providing a central location for data access and sharing. An added advantage of BASIC for data providers is that it creates a single interface for negotiations. Instead of having to negotiate data sales and agreements with 30 to 40 organizations in the region, data providers can deal with a single organization that is experienced and knowledgeable.
Another advantage of BASIC is that it provides a means of pooling resources—financial and human—among the members to reduce costs for all. When BASIC was faced with a price tag of over $150,000 for aerial remote sensing data, for instance, the organization reduced the cost by asking members to supply people to identify and mark section corners on the ground and to locate records of section corners held at the county courthouse before the aerial data were collected.
Issues Raised by the Boulder County Experience
For Boulder County, as for many other public entities, the cost of remote sensing imagery is a major issue. The problem is not only finding sufficient financial support but also persuading financial officers to approve the purchase. Boulder officials, like those in Baltimore, faced the problem of whether to categorize remote sensing data as a capital or an operating expense.
Licensing is another issue that complicates the use of remote sensing. Boulder officials told workshop participants that each type of remote sensing data came with different licensing restrictions. Differentiating among the various types of licensing restrictions has created confusion in local government agencies and among technical personnel. Localities like Boulder County may choose not to use licensed data if they cannot sell or share them with other local governments as a way to recover or mitigate data costs. The uncertainties surrounding what is allowable
under the license, particularly when using multiple sources of data, some of which are licensed and some not, may constitute a disincentive to using the data.
STATE GOVERNMENT USES OF REMOTE SENSING
State governments also use remote sensing, although sometimes for purposes different from those of local governments. States are more apt to employ moderate-resolution Landsat data than high-resolution commercial data (whether from satellites or airborne sources) in their remote sensing applications, because they generally need data covering larger physical areas than cities and counties. Obtaining high-resolution data for large areas and preparing the data are too costly, and usually the phenomena in which states are interested can be observed with low- to moderate-resolution data.
Because state governments are also larger than local governments, with more employees and broader policy responsibilities, geospatial data activities can be isolated within agencies rather than shared across state agencies. As a result, there may be more duplication of effort from agency to agency or department to department in state than in local government. One state official told workshop participants that he had discovered that his state had purchased the same remote sensing image four times—each time by a different state agency unaware of the other purchases.
Finally, because sales taxes and income taxes are a major source of income in most states and local governments, their budgets are negatively affected by recessions and unemployment. State budgets, like local ones, are often subject to large changes from year to year, which may affect state capacity to purchase remote sensing data or launch new remote sensing programs.
Despite the differences between state and local governments in the use of remote sensing data, they have some patterns in common. For example, the critical need to persuade public sector managers of the importance and utility of remote sensing data and the value of being able to provide these data in a GIS framework were common to both state and local governments.
Missouri: The Value of Internal Data Coordination
The Missouri Department of Natural Resources (DNR) uses remote sensing data to monitor state wetlands. The state is now considering a broad array of other applications of this technology. New uses of remote sensing data being examined by Missouri include monitoring change in both urban and rural areas. In cities and on the urban fringe, the state is looking to remote sensing to identify development for taxation purposes. The Missouri Department of Economic Development estimates that the public sector loses approximately $10 million a year because it does not have information about when new homes are completed and when property taxes should be assessed. The use of remote sensing for detecting
change is also being considered to trace the spread of oak blight in rural areas in the southern part of the state. Other possible uses of remote sensing are in watershed modeling, the siting of animal feeding operations, and understanding the impact of urban growth on agricultural areas.
Missouri also sees uses for remote sensing data in responding to natural hazards and unexpected events and estimating damages. The state faces potentially serious economic impacts from tornados and other extreme weather in both forested areas and urban settlements with extensive civil infrastructure. The nature of the damage can be estimated only if imagery obtained before the event is available to measure change after the event.
Advantages Enjoyed by Missouri
The state has a close relationship with state universities and often issues contracts for remote sensing data processing and analysis to groups in state universities. The flexibility of the contracts and the quality of the work at university research centers is a strong inducement to this practice, and it gives state officials access to advanced understandings and technologies in the field. However, relying on university scientists for significant remote sensing work under contract, instead of doing the work in state agencies, does mean that remote sensing activities are less visible to state managers and are therefore less secure.
Missouri, like Baltimore, also had the advantage of securing federal funds for its initial foray into remote sensing applications rather than having to use state funds for what would have been, in the context, an experimental methodology. The Missouri DNR has had a series of grants from the U.S. Environmental Protection Agency to delineate its wetlands. Initially, the state used Landsat data, although its more recent activities have been based on a combination of government and commercial remote sensing data, allowing state officials to compare the utility of each type of data for the wetlands task.
Issues Raised by the Missouri Experience
The steering committee was told that in Missouri, as in many other states, the initial uses of remote sensing were for new projects. The adoption of remote sensing data in Missouri differs in this way from the adoption of GIS, which was commonly employed throughout the state for numerous broad-scale uses. One of the implications of introducing a new technology into the public sector with project-specific applications is that other uses of the technology are often slow to emerge. As a result, in the case of remote sensing, there may be little coordination in the purchase or use of remote sensing data and technologies outside specific projects or agencies within the state. For example, when Missouri officials began to inventory the remote sensing data purchased by the state, they found that the same image had been purchased several times by different state
agencies; to avoid a repetition of this situation, the state is now creating a regular process for cataloging its remote sensing data.
Missouri officials told workshop participants that cost, licensing, lack of understanding of remote sensing, and variable needs were major issues at the state level. They believe that flexibility in data sharing will be critical to the more widespread adoption of remote sensing in state agencies. The use of remote sensing data would be economically more attractive to public sector managers if state and local governments were able to coordinate data purchases and share remote sensing data across jurisdictions and agencies. Its cataloging initiative will make it easier for managers to locate data already purchased by the state.
The Missouri experience also emphasizes the value of having multiple data providers, federal and private, U.S. and foreign. Some state agencies are currently examining the use of SPOT remote sensing data because they perceive that Spot Image, the vendor, allows flexibility in public sector budgeting.
Missouri officials also emphasized the value of having state managers who understand and value remote sensing. Too often when remote sensing data are used in combination with GIS software, the remote sensing data lose their identity and are viewed simply as part of the GIS. State managers recognize the utility of GIS databases but often do not recognize that remote sensing data are part of the GIS. Similarly, when data processing and research are contracted out to state universities, public sector managers can lose sight of the importance of the activity to state operations.
Finally, Missouri officials suggest that states need more people trained in remote sensing. GIS training is now widespread, in part because training courses sponsored by GIS software firms are readily available. Remote sensing training is more difficult to obtain.
Washington: Remote Sensing for Federal Land Management
The Washington Department of Natural Resources (DNR) is beginning to use remote sensing to manage federal lands within the state. The DNR has responsibility for 5.6 million acres of trust land, 3.0 million of which were given by the federal government when Washington became a state. The land trusts include 2 million acres of timberland, about 1 million acres for agricultural grazing land, and about 2.6 million acres of coastal land on Puget Sound.
Unlike many agencies in state and local government that report to elected officials, in Washington the DNR is headed by an elected official, the Commissioner of Public Lands, who has responsibility for both managing trust lands and enforcing regulations throughout the state on lands that are in both public and private hands. Because the state receives income from sales of timber on trust lands, there is a growing emphasis on managing the trust lands using something closer to a business model. Stimulated by changes in budgets, requirements, and even management practices, the state is beginning to look to market signals for
timing its timber sales, responding to demand at its peak rather than harvesting timber on an inflexible state schedule. This requires that the state have access to remote sensing data to know quickly where the needed timber can be found to respond to volatile market demands.
Washington is planning to use Landsat 7 data for mapping, change detection, and obtaining information for the state’s fire protection program. It has commissioned development of a statewide mosaic of georeferenced, orthorectified Landsat 7 data from the EROS Data Center (EDC), a U.S. Geological Survey (USGS) facility in Sioux Falls, South Dakota. The dataset will be created from images obtained in 1999 and 2000. In addition, one county in Washington is using commercial 1-meter-resolution data—given to it by the data provider for demonstration purposes—to create a new vegetation map. The data are currently being used in a pocket GIS system planned for foresters in the field. If funds become available, the state is planning to explore the use of these data in a transportation corridor analysis pilot project to be done in collaboration with the State Department of Transportation.
Advantages Enjoyed by the State of Washington
One of the strengths of the Washington use of remote sensing data is the Washington State Geographic Information Council (WAGIC). This Landsat 7 consortium has been established by a number of state agencies, including the DNR, the Department of Transportation, the Department of Health, the Department of Fish and Wildlife, the Department of Assessor and Mapping, and the Department of Archeology and Historic Preservation, as well as several other state and county offices. The consortium creates a community of remote sensing data users in the state that draw from the same baseline data and pool their resources to cover the cost of the data. WAGIC is procuring a mosaic of remote sensing data to be used for multiple purposes throughout the entire state.
Another advantage is that Washington is able to draw on the most appropriate data for its work regardless of the data source. This means that it can use low-resolution Landsat data for statewide fire protection and high-resolution multispectral commercial data for projects within a single county. The budgetary stringencies that affect the state of Washington, like so many public sector remote sensing data users, are eased by institutional innovations and partnerships like WAGIC and by obtaining private data to demonstrate applications.
Issues Raised by the Washington Experience
Funding limitations that keep the state from taking full advantage of remote sensing technologies are a major problem in Washington. Planned pilot projects are being stripped to their essentials or postponed. The transition from manual black and white aerial photography to multispectral digital imagery can be difficult when there are funding limitations.
The state has experienced the common problem of a mismatch between the regulatory requirements and the data available to meet those requirements. The state elevation data obtained from USGS quad sheets can be as much as 50 years old and is of medium resolution (30 meters). GIS analysts often use these data in combination with high-resolution satellite imagery to create GIS products such as orthorectified products. However, merging older digital elevation models from the USGS quad sheets with high-resolution imagery can degrade the accuracy of the final data product, reducing the value of the remote sensing data.
North Carolina: Floodplain Mapping with a Purpose
North Carolina is subject to periodic hurricane damage that causes severe physical damage to the state and often has economic repercussions. Though many places on the East Coast suffered from Hurricane Floyd in 1999, in North Carolina Floyd was preceded by Hurricane Dennis and followed by Hurricane Irene, a combination that exacerbated the damage to property caused by Hurricane Floyd. The immediate damages in the state from Floyd were 51 deaths and a cost estimated to be $3.5 billion,6 but the hurricane had longer-term impacts as well. For instance, many people moved out of North Carolina because of the flooding and the physical damage, a loss in population that created fiscal problems in later years.
In assessing the impact of the hurricane, it became clear that changes in terrain due to development and even flood damage in recent years meant that the state’s flood insurance rate maps were badly out of date and that residents of North Carolina had often been using outdated and inaccurate information to insure their homes and property. In response to this situation, and to protect its residents and the state in future years, North Carolina decided to establish a flood mapping program to obtain, process, and disseminate accurate, current, and detailed data on elevation and flood hazards over the entire state and to provide these data in both digital and hard-copy formats. The state has committed itself to creating by 2006 digital terrain maps covering 48,700 square miles with a vertical accuracy of 20-25 centimeters.7 Under its commitment to create the new digital flood insurance rate maps (DFIRM), North Carolina has contracted with two firms that will obtain lidar data using airborne sensors. Initial mapping is determined by river basins rather than counties because flooding is a function of
rivers and river basins, not county boundaries. However, eventually the new maps will all be available by county. Once the initial data collection is finished, in 2006, the state plans to update the maps routinely thereafter.
The program is being done in partnership with the Federal Emergency Management Administration (FEMA), which has federal responsibility for flood insurance mapping. Under normal conditions, FEMA’s budget would permit remapping only one of North Carolina’s 100 counties each year; taking 100 years to map the entire state would create an untenable economic situation for a state that is subject to recurrent hurricane and flood damage. Under a new agreement, however, FEMA has assigned responsibility for flood mapping in North Carolina to the state, making it the first cooperating technical state under FEMA’s Cooperating Technical Community partnership program. FEMA has agreed to match state funding of the mapping program.8
Advantages Enjoyed by North Carolina
North Carolina is benefiting in many ways from its remote-sensing-based flood mapping program. The DFIRM maps will be available to the public on the Internet, along with flood forecasts and inundation projections, in a format that is fully comparable across county boundaries. Earlier flood maps stopped at the county boundaries. A statewide GIS group, the Center for Geographic Information and Analysis, is obtaining memoranda of understanding from counties to establish a basis for sharing data across counties and municipalities. This will permit the state to incorporate existing spatial information in DFIRM maps as needed.
The mapping program will save money for the state. The USGS did a cost-benefit analysis of the likely impact of the DFIRM program in North Carolina and concluded that the state would gain $3.35 for each dollar spent on mapping and would lose about $57 million each year that went by without the maps.9 These figures, together with the losses suffered as a result of Hurricane Floyd, helped state officials to recognize the financial costs of inaction and contributed to their willingness to move ahead with this program. But the North Carolina DFIRM maps will have other uses in the state as well. For example, flood maps can be overlayed with parcel tax maps, making it possible not only to model future flood impacts but also to use the DFIRM maps for community planning and development.
Another advantage of the North Carolina remote sensing mapping program is that it is based on a budgetary and institutional structure that anticipates mov
|
8 |
For additional background on the North Carolina Floodplain Mapping program, see <http://www.ncfloodmaps.com/>, accessed on June 28, 2002. |
|
9 |
John Dorman, 2002, “North Carolina Floodplain Mapping Program,” footnote 6. |
ing from a one-time to an operational mapping program. The one-time expense of the initial mapping is being covered with a combination of FEMA and state funds, but the state is also providing operating expenses for the program in future budgets, which will permit routine updating of the maps. Recognizing the need for a sizable one-time outlay and planning for ongoing operational expenses together ensure that the program will continue to deliver valuable information over time.
Issues Raised by the North Carolina Experience
DFIRM maps require significant digital storage space. North Carolina is purchasing 20 terabytes of data and will be using these in conjunction with data from other sources. There is a commitment to making the maps available to the public over the Internet through the North Carolina Floodplain Mapping Information System, but because of the storage constraints, some of the more detailed data will be archived at the USGS EROS Data Center in Sioux Falls, South Dakota, rather than being maintained online in North Carolina.
Since the maps are being developed by a state-federal partnership, another issue was whether to use meters or feet in the maps. (The federal government tends to use the metric system, and local governments tend to use the English system of feet and inches.) Still another issue to be addressed is differing practices among contractors related to the accuracy of the lidar-derived digital elevation information in terms of national mapping standards.
REGIONAL USES OF REMOTE SENSING
The number of issues related to population growth and the environment that must be discussed in a regional context is expanding. Moreover, natural disasters such as floods, hurricanes, and similar weather events do not affect discrete areas within county or municipal boundaries; they affect large regions that extend across and beyond political or administrative jurisdictions. Just as many governments cooperate in disaster response, they are also beginning to recognize the value of cooperating in the development of spatial data resources that can be used in disaster response and recovery across jurisdictions. Because of their capacity to provide comparable data over a large number of administrative units, remote sensing and GIS can be a valuable source of information for regional responses to growth and natural disasters, and for policy and decision making.
Portland Metro: Coordinating Land Use Data and Policies
The only elected regional government in the United States, Portland Metro is pioneering the use of remote sensing data in a regional spatial data framework in Oregon. Portland Metro, which encompasses 24 city governments, three coun-
ties, and several special-purpose management districts, is responsible for land use and transportation planning in the region. Because Portland set an urban growth boundary in 1979 that limits the physical expansion of the city, land use planning is a major policy focus in the region, and spatial data assume a critical role in policy discussions.
Metro maintains its spatial data in a regional GIS called the Regional Land Information System (RLIS), which contains information on land records and the built environment. Aerial photography has been used for about 10 years to inventory land use and natural resources within RLIS (Figure 2.3). This information has been supplemented with limited data on land cover from federal sources, principally FEMA and USGS. Satellite remote sensing data were first added to the RLIS in 1998, when Metro used Landsat imagery to obtain data on land cover in the region (Figure 2.4). The goal was to identify land that served as habitat for wildlife. Metro officials told workshop participants that their current goal is to
FIGURE 2.3 Annual vacant lots inventory of undeveloped land. The technique to produce the inventory uses visual interpretation of aerial photography to measure the land supply. SOURCE: Metro Data Resource Center.
FIGURE 2.4 Land cover classification. This remote sensing analysis using Landsat data allows planners to model more complex relationships in the urban landscape. SOURCE: Metro Data Resource Center.
obtain higher-resolution data from commercial sources and to make these an operational part of the region’s planning activities. At present, remote sensing data are used to inventory vacant lands within the urban growth boundary that can be used for industrial or residential purposes. They are also used to identify environmentally constrained lands, wetlands, and waterways.
Advantages Enjoyed by Portland Metro
One of the advantages enjoyed by Portland Metro is that the need for spatial data for urban growth planning led to the setting up of an operational budget for remote sensing data. The resolution of the data available to regional planners has improved each year, and Portland Metro has been able to assess the land supply more precisely because greater spatial detail is available from the higher resolution data.
Another advantage is that Portland Metro now has a common data infrastructure that is being maintained by the counties and municipalities that make up Metro. This collaboration has multiple advantages. It reduces the cost to local
government of obtaining and maintaining data and information for decision making, and it means that the local governments within Metro that are working on land use policy can concern themselves with specific issues rather than arguing about data sources or quality. One official said that in Portland Metro, data management is not a technical issue; it is about relationships.
Issues Raised by the Portland Metro Experience
The Portland Metro effort is complicated by the difficulties the local weather creates for obtaining remotely sensed images of the area. Because of frequent rainfall in the area, it is often difficult to obtain cloud-free remote sensing images. Moreover, aerial photography is generally obtained in July and August, when the trees are in full leaf, making it difficult to use the images to observe aspects of the built environment like the transportation infrastructure or utilities.
Cost was identified as the most significant constraint to using satellite remote sensing in the Portland metropolitan area. Metro officials would like to use high-resolution, multispectral commercial imagery because it gives significantly more information than aerial photography,10 but the satellite data are considerably more expensive. Metro officials hope that by pooling their resources and data needs across the region, it will be possible in the future to obtain the high-resolution data they need.
Red River Valley Flood: Remote Sensing and Disaster Response
In the spring of 1997, as the record snowfall of the winter of 1996-1997 began to melt and the waters ran north toward areas where the ice and snow were just beginning to melt, the Red River flooded its basin along the North Dakota-Minnesota boundary. The floods were the worst on record, inundating farms and communities in the Red River Valley and forcing over 100,000 people to evacuate their homes. The flood blocked regional transportation routes, disabled power systems, and disrupted water and sewage systems. After the floodwaters receded, estimates of damages were between $1 billion and $2 billion.11
Standard USGS topographic maps are used to forecast floods by providing estimates of crests on the rivers of the Red River Valley. Changes of only a few feet in the flat topography of the Great Plains can be significant in terms of flooding, but these changes cannot be discerned on USGS maps, which provide
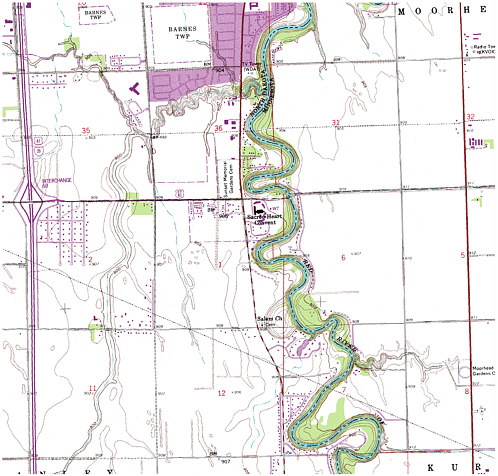
FIGURE 2.5 USGS contour map of Red River. SOURCE: North Dakota State Water Commission.
only 5-foot or 10-foot contour lines (see Figure 2.5). According to regional officials, difficulties in predicting the 1997 flooding demonstrated that maps with greater detail were needed to provide communities in the Red River Valley with better predictions of flood crests. Regional officials considered several different technologies that could be used in developing new maps, including GPS surveying, aerial photography, and lidar. In the end, two areas within the Red River Valley elected to create new contour maps using lidar—because of its speed, accuracy, and cost benefits—in combination with aerial photography. Lidar was also selected because it can provide data for digital elevation models with 1-foot contour intervals, which can be used to reevaluate flood plains in the Red River Valley (see Figure 2.6). Aerial photography was used to identify or verify objects sensed by lidar. For example, trucks, bales of hay, and tractors can be
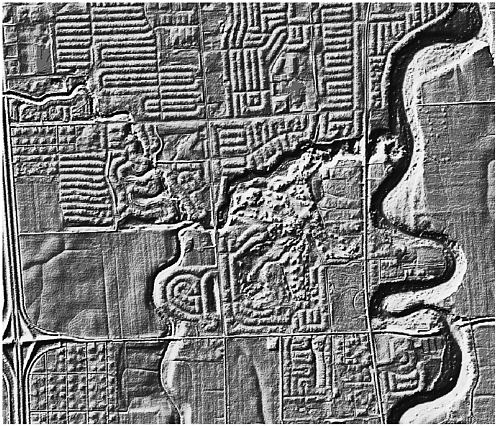
FIGURE 2.6 Lidar digital elevation model shaded relief map of the Red River Valley. SOURCE: North Dakota State Water Commission.
identified in aerial photographs so that when they appear in the lidar data they can be recognized. In addition, aerial photography was used to help define land surfaces surrounding bodies of water, because lidar does not reflect off the surface of water.
Advantages Enjoyed by the Red River Valley
Although the mapping projects were led by the two North Dakota cities of Wahpeton and Fargo, each city organized a regional bistate partnership to obtain broader financial support for the work. Wahpeton worked with the North Dakota State Water Commission, the Corps of Engineers, FEMA, the Minnesota DNR, and the city of Breckenridge, Minnesota; the Wahpeton mapping project covered 65 square miles. Fargo created a partnership with the North Dakota State Water Commission; the Minnesota DNR; the Buffalo-Red River Watershed District;
Cass County, North Dakota; and Clay County, Minnesota. The Fargo project involved obtaining data for 138 square miles and processing the data for 42 square miles. The participation of multiple regional partners in both projects lowered the cost to each partner of obtaining the data.
Issues Raised by the Red River Valley Experience
One of the issues raised by these two remote sensing projects is the need for large data storage capabilities. Collecting remote sensing data creates very large digital files that require advanced software and hardware systems. Without adequate software and hardware, an investment in the creation of a large remote sensing database could be wasted.
Another issue raised by the Red River Valley experience is data ownership. A number of local and state government entities were involved in creating the new contour maps and remote sensing databases, and it was important to be able to distribute the data among the sponsors. The Wahpeton mapping project began first, and participants were surprised to learn that the lidar data obtained for the project were copyrighted by the contractor that had provided the data. When the contract for the Fargo project was signed, it specified that the data were to be owned by the purchaser. Regional officials told workshop participants that based on their experience, issues of data access and distribution should be addressed prior to signing a contract.
A third issue arising out of the Red River Valley mapping project is related to the ability of the lidar data to discern very small differences in elevation. If these differences are subject to even minor changes over time, such as the creation of contour lines caused by the furrows left by a tractor, the lidar data may have to be obtained annually. Local officials believe using remotely sensed data to keep the contour maps current will be a continuing responsibility.


