


Comprehensive Everglades Restoration Plan
Monitoring and Assessment Plan
Table of Contents
The Comprehensive Everglades Restoration Plan (CERP) monitoring and assessment plan is a product of an interagency, interdisciplinary team known as Restoration Coordination and Verification (RECOVER). The Adaptive Assessment Team (AAT) of RECOVER has the lead responsibility for creating the monitoring and assessment plan, and for conducting an on-going review of how well it is working. In addition, the AAT has the responsibility to use the information that is provided by the monitoring program to assess system responses, as a basis for recommending improvements in the restoration plan where needed. Overall, the RECOVER Leadership Group holds accountability for the CERP monitoring and assessment program within RECOVER.
The primary purpose of this monitoring and assessment plan is to identify and describe the performance measures and parameters of the natural and human systems in south Florida that should be measured in order to determine the success of the CERP. The goal is to create a single, integrated, system-wide monitoring and assessment program that will be used and supported by all participating agencies as the means for tracking and measuring the success of the Comprehensive Plan. This document identifies the specific set of physical and biological performance measures that should be monitored, the geographic regions where these measures should be monitored, and the improvements in these measures that should occur during and following the implementation of the Comprehensive Plan. Collectively these measures will serve as indicators of the overall health of natural and human systems in south Florida, relative to the objectives of CERP. This monitoring and assessment program is required as a basis for determining whether CERP achieves these objectives (i.e., the recovery of healthy and sustainable ecosystems throughout south Florida and an improved environment for people), and to support an adaptive assessment process for refining and improving the design and operation of CERP throughout its implementation.
This is a system-wide monitoring and assessment program, designed solely for assessing how well CERP meets the system-wide objectives of ecosystem restoration and water supply. Each CERP project will develop a separate, local monitoring plan to assess the success of the individual project. To ensure that measures and targets selected by the project teams are consistent with system-wide measures, each project team should review this system-wide plan.
As a prerequisite to the implementation of the CERP monitoring and assessment plan, RECOVER is preparing four additional planning documents that will substantially expand upon the summaries provided below. These are:
-
an integrated and standardized system-wide sampling design and data management protocol for the monitoring plan (subsection 4);
-
an adaptive assessment strategy explaining how the AAT will use the monitoring data to conduct annual assessments of system-wide responses (subsection 6);
-
a detailed monitoring plan implementation strategy (subsection 7); and
-
a research needs document in support of the monitoring and assessment plan (Section IV).
In addition to these four planning documents, RECOVER prepares (and revises annually) a Program Management Plan. This management plan describes the tasks and responsibilities for all South Florida Water Management District and U.S. Army Corps of Engineers activities pertaining to RECOVER for a three-year planning period. The RECOVER management plan includes a budget for all monitoring and assessment tasks.
The CERP monitoring and assessment plan is organized into five sections. Section I, the Introduction and Background, provides a broad overview of the purpose of the monitoring plan, how it was created, and how it should be applied. Section II contains the narrative descriptions and flow diagrams for the set of nine conceptual ecological models that provide the technical foundation for most of the natural system performance measures that have been incorporated into the monitoring plan. Section III contains the technical documentation sheets for each of the CERP performance measures that make up the monitoring plan. This section includes a description of the process used to develop and screen the biologic, hydrologic, and water quality performance measures comprising the CERP monitoring and assessment plan. These documentation sheets identify the specific parameters of the natural and human systems that are to be monitored, the geographic region where each is to be monitored, and the restoration targets for each. Section IV is a summary of the uncertainties associated with the hypotheses in the ecological conceptual models and a recommendation for research needs in support of CERP. The research listing identifies studies needed to reduce uncertainties in the model hypotheses in order to improve the ability of RECOVER teams to predict and interpret system responses. Section V is a set of spreadsheets, to be revised annually, for purposes of tracking the status of each element in the monitoring plan.1 Additional information on the content of each section is provided in the introductory paragraphs for each of the subsequent sections. Specific monitoring protocols, i.e., how the elements should be monitored individually and collectively, will be determined through consultation with the agency(s) or organizations responsible for implementing the data management program and the elements of the monitoring plan as well as outside consultants.
The content and adequacy of the CERP monitoring and assessment plan will be regularly reviewed by the AAT and the full RECOVER team, by all participating agencies, and by independent reviewers. Changes in the monitoring and assessment plan will be approved by the AAT. During the initial reviews of the monitoring plan the number and focus of the performance measures may be revised, due to on-going efforts to maximize the efficiency and coverage of the monitoring effort, while at the same time attempting to settle on the smallest number of measures necessary to track system-wide responses to CERP. As part of this initial review, the AAT will continue to examine the biological performance measures that are contained in this draft. The objective of this continuing review is to insure that the biological measures have been carefully selected and designed to effectively track responses by the components of the key restoration hypotheses
contained in the conceptual ecological models. However, once the initial monitoring and assessment plan is reviewed and approved, it is not expected that large-scale changes will occur or would be desirable.
Monitoring and assessment are critical components in the CERP adaptive assessment protocol and as such, merit clear definitions. Monitoring is the systematic process of collecting and storing data related to particular natural and human systems at some specified locations and times. Assessment is the process whereby monitoring data are interpreted in the context of particular questions and issues, such as tracking progress towards certain restoration objectives. Assessment also includes the development of statistical relationships from the monitoring data, other model development and application, and cause-effect research linked directly to the objectives of the restoration program. Monitoring can be used to document the status and trends of elements within the ecosystem over a range of temporal and spatial scales, and provide feedback that can be used to assess whether the predicted results are being achieved. It also provides information that can be used to help refine or modify actions to ensure that the targets for the project are being met.
When applied to natural ecosystems where maintenance in their current condition is desired, monitoring can be used to evaluate whether there are aspects of the ecosystem that are varying beyond what would be expected under the influence of natural processes. When monitoring is applied to disturbed ecosystems that are being restored, monitoring can be used to evaluate whether the ecosystem is moving in the desired direction. Monitoring can also determine when the ecosystem has moved within the bounds of what is defined as the restored condition.
It is important to be aware that rates of change, and thus the time required to document them, are often very different depending on the element being measured. Site history, landscape setting, the kind, degree, and direction of change, the potential rates of change for each parameter, and the level of applied effort in restoration projects can all affect rates of change. Restoration of some disturbed ecosystems can only be considered in geologic time frames because of the degree of disturbance that has occurred on these sites. In addition, other aspects of the South Florida ecosystem, including both restoration and development activities, will inevitably be changing at the same time, further complicating the ability to assess the success of the individual restoration components. It is essential that these differences in rates of change be factored into the assessments of environmental responses.
In the context of RECOVER, monitoring has been defined in an adaptive assessment strategy (An Adaptive Assessment Strategy for the Comprehensive Everglades Restoration Plan; AAT, 2000) as having four objectives:
-
Establish base-line variability for each of the performance measures;
-
Determine the status and trends among the performance measures;
-
Detect unexpected responses for components or measures of the ecosystem that have not been specifically identified as CERP performance measures; and
-
Cause-and-effect scientific investigations designed to increase ecosystem understanding, particularly if restoration implementation yields unanticipated results.
Addressing these objectives will allow the determination of how CERP is affecting the physical, biological, and chemical components of the system, and to increase scientific understanding of how the system works. Knowledge of how the system is changing in response to CERP restoration actions combined with investigations of cause-and-effect relationships will contribute to the refinement of CERP projects to ensure that targets are being met. It is recognized that this monitoring plan does not include all of the measures necessary to document the long-term “restoration” of all systems in south Florida (e.g., some upland systems in undeveloped and developed landscapes), but it will provide a minimal set of measures for those systems directly affected by CERP.
In General
The main point of environmental monitoring is to detect change or lack of change over time, and to provide information sufficient to understand the causes of these patterns so that appropriate actions can be taken to manage the ecosystem for a desired condition. Part of the challenge in designing and sustaining a successful monitoring program is to select a limited set of parameters that adequately convey whether the ecosystem is or is not changing, in what direction it is changing, whether these changes are natural or a result of human actions, and if the latter, whether the changes improve or adversely affect the ecosystem in some significant way.
Prior to determining whether a change in condition or state has occurred, it is necessary to establish the initial or baseline conditions. Baseline information provides the benchmark against which the progress of the restoration plan can be measured, and to understand the ranges of natural variability necessary to confirm when change has actually occurred. While some regions of the Everglades ecosystem have well established monitoring programs, other areas have little or no baseline data. Plugging the gaps in baseline conditions is one of the critical components of the monitoring and assessment plan.
There are different approaches that can be used for selecting the best suite of monitoring parameters. One can select parameters that are considered to be the major stressors or processes that control the context within which an ecosystem operates. With this approach it is assumed that as long as the major processes are operating appropriately, the ecosystem is functioning appropriately.
Alternately, parameters such as individual species or groups of species that are considered to be indicators of the processes operating within the ecosystem can be selected. This approach assumes that unless all of the significant processes are operating appropriately, these indicators could not exist in this ecosystem at normal population levels.
This mix of constraints on the ability to detect either desirable change resulting from restoration or undesirable change in an ecosystem argues for monitoring a mix of both basic processes and integrators. This and the ever-present possibility of unanticipated ecosystem changes also argue for the use of as many monitoring parameters as are “feasible” from as broad a spectrum of ecosystem parameters as possible. In practical terms, “feasible” means that there are good assurances that the parameters can be measured and understood over sufficient time periods to determine the long-term affects of management or a restoration program.
The performance measures in this monitoring plan are planning and assessment tools that were approved (and in most cases also developed) by the CERP planning teams to identify the objectives for the restoration plan. Each performance measure identifies one or more components of the natural and human systems in south Florida that CERP has been designed to improve. The performance measures may be used in evaluation of proposed changes (primarily where simulation models exist) and as field indicators that the appropriate change has occurred.
These performance measures have, for the most part, been selected through two CERP planning processes; 1) the C&SF Project Comprehensive Review Study’s (Restudy) Alternative Evaluation Team (AET) and 2) the RECOVER Regional Evaluation, Adaptive Assessment, and Water Quality teams.
Restudy/AET process
Between 1996 – 1999, during the Restudy feasibility phase of CERP, an interdisciplinary, interagency team of biologists, ecologists, and other resource specialists (AET) developed a set of performance measures as the basis for designing and evaluating alternative restoration plans. Each performance measure was implicitly linked to one or more planning objectives, and consisted of a measurable indicator and target. Because a key tenet of south Florida ecosystem restoration is that hydrologic restoration is a necessary starting point for ecological restoration, the performance measures created by the AET were largely indicators of hydrologic characteristics, consistent with what is known or hypothesized about the optimum hydrologic patterns for a number of characteristic plant and animal communities in the historic Everglades.
These performance measures described hydrological parameters, data format and hydrological targets originally used by the AET to evaluate hydrologic simulation of alternative plans. Refined versions of these hydrologic performance measures are included in this monitoring plan for their value in setting hydrological targets for CERP,
and for evaluating how well CERP implementation corrects the hydrological problems in the natural and human systems.
Conceptual Model process
The Restudy included an Applied Science Strategy that will now be used to link science and management during all phases of CERP. An essential step in this strategy has been the creation and refinement of a set of nine conceptual ecological models, each for a different physiographic region of south Florida. The models link stressors on the ecosystem to ecological attributes that are considered to be indicators of ecosystem health. Each of these linkages represents a working hypothesis based upon current knowledge of the ecosystem.
The overall Restudy strategy was to use the conceptual models as a basis for reducing the total number of performance measures from an almost infinite number of potential measures in the natural and human systems of south Florida to a manageable number of major key indicators of environmental conditions. The models allowed for the selection of a parsimonious set of performance measures directly based on the stressors and attributes in each model. These measures collectively describe the physical and biological conditions that will be used to define a successfully restored natural system.
The rationale for having performance measures and targets for each stressor is that the stressors are known or hypothesized to be the immediate sources of the ecological problems in each landscape. A successful restoration program must eliminate the unnatural stresssors acting on the natural systems. A performance measure describes the stressor and how that stressor should be measured, and how that stressor must change in order to neutralize its adverse effects. The hydrological performance measures for the natural system that were developed by the AET were for the most part derived from the hydrological stressors in these models.
Performance measures have also been developed for each attribute in the conceptual models. The attributes have been identified as the biological or ecological elements that are the best indicators of responses in the natural systems to the adverse effects of the stressors. The hypotheses used to construct the conceptual models link each attribute to the stressor(s) that are most responsible for change in that attribute. If the hypotheses are correct, neutralizing the adverse affects of the stressor will result in a predictable positive response by the attribute. The performance measure developed for each attribute identifies the element(s) of that attribute that should respond, how the element(s) should be measured, and how the element(s) should change once the effects of the stressor are removed.
The conceptual models also were used to identify uncertainties in knowledge in the linkages among the stressors and attributes. These uncertainties identify where additional research is needed to ensure the success of CERP and is discussed in Section IV.
Development of Water Quality Performance Measures
A number of the performance measures developed during the Restudy/AET process specifically focused on water quality. Water quality is identified as a stressor in several of the conceptual models. The linkages between water quality, hydrology and biology are complex and led to the decision to create a team that focuses on water quality as part of the RECOVER process. Refinement of water quality performance measures for RECOVER were conducted through the application of water quality and landscape models, empirical analyses, and results of on-going research.
Selection of performance measures for this plan
Over 900 performance measures and indicators resulted from the above processes. The monitoring and assessment plan must be sustainable for perhaps five decades or longer if it is to be successful in guiding CERP throughout its implementation and subsequent operation. The high cost of monitoring a large number of parameters over a large area and a long period of time is a major reason that many monitoring plans in support of adaptive assessment and management have failed to be sustainable. Therefore, it is crucial to identify a minimum set of performance measures that will indicate whether CERP is achieving ecological recovery of the greater Everglades ecosystem and is meeting its water supply and flood protection objectives.
Determining this minimum set of parameters from the many performance measures that were proposed was one of the tasks of the AAT’s Editorial Team. This task was accomplished by organizing the submitted performance measures into broad categories, and reviewing the performance measures in each category to determine where overlapping measures could be combined. Measures were combined when two or more had similar locations, parameters or targets (see Section III for details). The result is a list of ~150 performance measures (~60 biological and soils, ~20 hydrological and ~70 water quality) with identification of the information they provide to assess system-wide CERP performance.
The refinement of the performance measures is an on-going process. It is essential that the monitoring and assessment plan address the key restoration hypotheses, and that it focus on a sustainable number of performance measures. Long-term monitoring and assessment efforts fail if they are too large, too complicated, too expensive, or if the results can not be interpreted within the context of the key hypotheses. The next steps in the evolution of this monitoring and assessment plan is for the Adaptive Assessment team to re-exam the current set of recommended measures in the context of their linkages as outlined in the conceptual models. As part of this review, the measures will be grouped into logical, hypothesis-based packages as a basis for designing a more efficient system-wide monitoring protocol. The selection of these key hypotheses provides the focus for the monitoring and assessment program and for setting hypothesis-driven priorities in on-going and future natural systems research. The ultimate success of the CERP adaptive assessment program will depend on the acquisition of new information from an integrated program of modeling, monitoring and hypothesis-driven research. The general
framework for this approach is further outlined in Section III of this monitoring and assessment plan.
Along with the identification of essential parameters to monitor, a monitoring network must be logistically economical, provide quantitative data, apply a standardized monitoring and data management protocol, and ensure that data analysis is done in ways insure that trends can be correctly recognized and tracked over time with confidence. There are a number of different approaches that can be taken in the design of a monitoring network that meets these design objectives. Although decisions regarding the details of the design protocol have yet to be determined, certain guiding considerations are provided here.
Field monitoring and laboratory methods must be standardized. All participating investigators in the monitoring and assessment program must use agreed-upon methods for collecting and managing monitoring data. Any changes in methods during the implementation of the monitoring and assessment plan will be documented.
A spatial framework for the monitoring network and its component performance measures needs to be defined. Selection of performance measures can best be done within this framework because: 1) the spatial scale of sampling will financially constrain the number of parameters that can be measured; 2) consideration of spatial domains that are consistent with the conceptual models will promote consideration of the interactions of performance measures and the need for grouping measures, rather than assessing measures independently; and 3) consideration of gradients will add realism to the conceptual model approach – the habitats included in the conceptual models are not isolated entities, but rather exist as part of a continuum across the landscape. Common performance measures of several habitats and how they change temporally across habitat ecotones needs to be assessed.
RECOVER should consider documenting changes across three important gradients that will be changed during the restoration: hydrologic, nutrient, and salinity gradients.
-
Hydrologic gradients – restoration will change the spatial distribution of hydropatterns and associated plant and animal communities. Gradients from uplands through deeply inundated wetlands may shift over substantial distances.
-
Nutrient gradients – must be able to detect effectiveness of water quality improvements in and near impacted zones, which generally are gradients oriented by discharge sources. Indirect hydrological effects on natural nutrient gradients must also be assessed (e.g. within mangrove zone).
-
Salinity gradients – changing water quantity, distribution, and timing will cause changes in the location of salinity gradients and the salinity patterns along those gradients. This will yield biological responses that can best be assessed by sampling along these gradients.
Several monitoring design options are available. These options are not mutually exclusive, but each should be carefully assessed as to their advantages and disadvantages prior to selecting a design. Transects are an excellent approach toward assessing changes along gradients. These gradients are the most likely locations where ecological change will occur; transects maximize the ability to detect this change. A randomized design (like the EPA EMAP) or stratified randomized design is capable of spatially integrating broad-scale changes for the entire landscape area . This design is desirable if a broad spatial integration is the highest priority. A network of fixed stations that are based on existing monitoring networks can provide a larger data time series for comparison with post-restoration conditions (e.g. hydrological and water quality). Sites of special interest will provide information relative to unique species or communities and how they are affected by restoration (e.g. within selected reference or indicator areas).
If a transect design is chosen, sampling along gradients can either be completely randomized or stratified random sampling (depending on steepness of gradient or on habitat type); sample sites can be fixed for some parameters (with randomized initial selection) such as for ground water wells or individual trees. Likewise, if the focus is on indicator regions, sampling within these regions can be randomized or transect based (assuming these regions span recognizable gradients). See Appendix A for Indicator region maps.
Existing monitoring networks or sites (especially hydrologic and water quality sites) may be incorporated into the CERP monitoring program, to the maximum extent possible and consistent with the purposes of the existing programs. While there is a need to utilize historical data to assess long-term change, the CERP network should not be based on the existing network if this design is not appropriate for future needs.
A network of “indicator regions” created by the AET, and refined by the RECOVER Regional Evaluation Team, should be considered in the spatial design of the monitoring plan. Indicator regions are select groupings of cells (2-mile x 2-mile grid) within the Natural System Model and the South Florida Water Management Model. Each of the indicator regions was chosen on the basis of having relatively uniform hydrologic and vegetation characteristics. The indicator regions were used in simulation modeling to average model output over multiple similar cells as a way of reducing analytical uncertainties associated with single cell comparisons. The current set of indicator regions may provide preferred locations for a network of monitoring stations throughout the CERP restoration area. See Appendix A for indicator region maps.
Monitoring and research spatial design should be integrated. It is not efficient to have separate designs for hydrologic, water quality, and biological networks – these should be part of an integrated monitoring system to the extent possible. Because of the importance of this integration, it may be necessary to change the existing hydrologic and water quality network or the indicator region selections. Large-scale integration should be explored using aerial photography and remote sensing.
The scientific and technical information generated from the system-wide monitoring and assessment program must be organized and analyzed in such a fashion to allow RECOVER to effectively evaluate CERP performance and system responses and to produce an annual assessment report describing and interpreting the responses. Development of appropriate database systems, data analysis protocols and outputs, and a data driven web interface are key to the successful implementation of the adaptive assessment process.
The design of the CERP monitoring data management and analysis system will be based on knowledge gained from the successful data management systems currently being used in several on-going regional monitoring programs in south Florida, including the Kissimmee River restoration program and the Lake Okeechobee ecological data-bases.
The data management and analysis system used to organize and archive data and reports generated from the system-wide monitoring program will be part of a centralized CERP shared data and information network infrastructure. This system will be designed and developed so that it integrates with other database components of the infrastructure. With guidance and direction from the AAT, the monitoring data management system will be evaluated, designed, developed, tested and implemented within the CERP Data Management Program. Additionally, appropriate user web-based interface tools to display and analyze the monitoring data will be designed and developed.
A separate program-level management and analysis plan for all CERP-related data will include the information technology necessary to collect, store and retrieve and analyze the data. The data management plan will describe the scope, schedule and costs associated with design, procurement, installation and configuration of the hardware, software, network, security and data communication lines that comprise the shared data and information network. The appropriate protocol and procedures for tracking and storing all documents, data and records needs to be established in the plan as well.
The data management and analysis system will be designed to facilitate electronic storage and retrieval of environmental data and reports as well as provide access to other information (modeling, socio-economic, costs and schedules, etc.) that may be needed to assess CERP performance. The system will be equally accessible to the SFWMD, the USACE and other participating agencies, and will consist of database servers and a web site that will allow a multitude of data types and relevant documents to be easily accessed and shared. The infrastructure and software will be designed to eliminate the potential for security and firewall breaches that could threaten the integrity of the system and the information it contains. The web site will also be used to post information and data for review by other agencies, stakeholder groups and the public.
The monitoring program database will contain all environmental (hydrologic, water quality, and biological) monitoring spatial and time series data tables that will be used to assess the effects of implementing CERP. The database will store documents, imagery
and other tables (such as those that describe methods, conceptual models, performance measures, costs, etc.) that are needed to interpret or enhance understanding of the environmental data. Development of the database hinges on continued evolution of the conceptual models and listing of associated performance measures and monitoring needs to guide the process.
System development will also require acquisition/capture from multiple sources (CERP projects, external agencies, SFWMD, etc.) and inventory of all existing (and future) data that may be relevant to the performance measures. Types of data to be captured and archived in the system include: metadata, geospatial, time series, operations, engineering/construction designs, and technical reports/relevant research. Geospatial data includes, but is not limited to, surveys, maps, aerial photography, aerial imagery, and modeling coverages (biological, water quality and hydrological). There is a considerable amount of time series data generated from a number of on-going monitoring and research programs that will also need to be incorporated into the system.
To effectively manage these data and ensure that they can be easily stored, accessed and retrieved, and transferred by all authorized users, a set of standards, processes, procedures and tools will be established. The standards and procedures will address such topics as geospatial metadata, data projections, horizontal/vertical datums, file formats, compression techniques, file coding and file naming conventions for all data to be stored on the shared data and information network. A document management and control system/process will be developed and implemented to assist with organizing and tracking program documents and reports.
A quality assessment/quality control (QA/QC) process will be established to ensure that data generated from the monitoring program are checked for the proper integrity before being archived into the shared database.
The database system will be maintained, updated, quality assured and expanded to meet the needs of the adaptive assessment process, as necessary, and to accommodate continuous acquisition, storage, analysis and publishing of data. The system will require periodic hardware and software upgrades, along with possible purchase of additional disk space and memory.
A key component in a successful data management system is data analysis. The management system must produce data reports that present the monitoring data in formats that clearly support the Adaptive Assessment team in its task of interpreting system responses in the context of restoration targets. For this to happen, the raw monitoring data for each of the performance measures must be analyzed according to a protocol that is consistent with the guiding hypotheses and the restoration targets. The Adaptive Assessment team will have a lead role in determining the requirements for the design for data analysis for each of the performance measures, and for determining the required formats for the data reports.
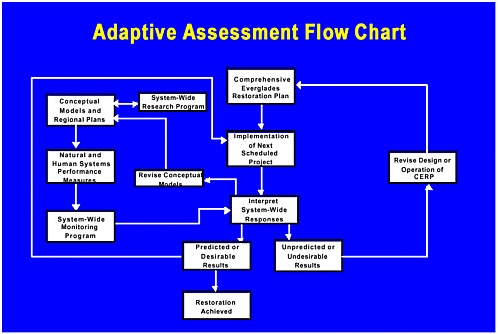
The monitoring data will be analyzed, and used to support an adaptive assessment protocol that has been established in CERP as a means for tracking the results of CERP, and for improving its design and operation whenever unexpected and/or undesirable responses occur. The assessment will follow the protocol developed by the AAT (AAT 2000; Figure X). The actual responses that occur in the natural and human systems during and following the implementation of CERP will be compared to the trends and targets that have been established for each performance measure. These comparisons will serve as a basis for determining how successfully the CERP projects, individually and collectively, are moving these systems towards the plan’s overall goals. It will be the combined responses from the full set of performance measures that will determine the overall success of CERP.
The CERP monitoring program is designed to track the responses by each of the restoration plan’s performance measures. Empirical data from the monitoring program is fed into the CERP data management system. This data management system will convert the field data into formats that can be used by the RECOVER teams to interpret system responses to the CERP projects. Data management will include synthesis and analysis of the monitoring data, in order to create the data reports that will best support the assessment process.
Data analysis is an essential prerequisite to the task of interpreting system responses. Raw monitoring data must be converted into formats and reports that reveal the status and trends, patterns of variability, and probable responses to the effects of CERP, for each of the performance measures.
The AAT has the lead responsibility for reviewing and interpreting the analyzed outputs from the monitoring data, and for integrating new knowledge of the natural systems into the assessment process, as a basis for tracking the success of CERP. A protocol will be developed that not only examines monitoring data for each of the individual performance measures, but also integrates these into an overall assessment of system health/integrity. The AAT will issue annually a report on the performance of CERP. These reports will identify where ecosystem responses to CERP are on track to meet the goals of the plan, and/or where undesirable responses are being detected. Where undesirable responses occur, or may be anticipated based on initial interpretations of monitoring and research data, the annual reports will suggest whether the causes of these responses are due to some structural or operational component of the restoration plan or are external to the plan. The Comprehensive Plan Refinement Team of RECOVER will use these AAT reports as a basis for coordinating efforts to recommend solutions to any problems in CERP’s performance.
The CERP Monitoring and Assessment Plan will be the tool by which the RECOVER team will assess the performance of CERP. By necessity, the development of such an important plan is an iterative process. This is to ensure the technical soundness of the plan, the concurrence of the SFWMD and USACE, and the full participation of the other state, federal, and local partners, as well as the non-governmental organizations (NGOs) that are critical to the success of CERP.
The primary consideration of the Monitoring and Assessment Plan is the selection of key indicators that will describe the response of the ecosystem, as well as water supply and flood control, as CERP is implemented. The ecosystem performance measures were derived from a number of sources, including numeric hydrological and landscape models, and ecological conceptual models. Concerted efforts were made, and continue to be made, to include the best scientific and technical expertise in the development of the plan.
Another factor to consider in the development of the Monitoring and Assessment Plan is to ensure that it is sustainable over the life of CERP. This takes into consideration the complexity of the ecosystem, as well as the resource and funding needs, to carry forward a program over the next 20 to 30 years. Therefore, the Adaptive Assessment Team will continue to refine the plan during the first few years of implementation.
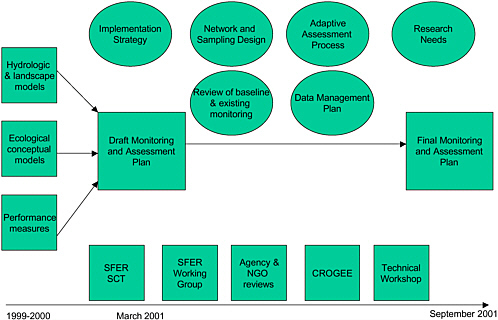
The March 20th draft Monitoring and Assessment Plan includes the revised ecological conceptual models, the proposed suite of performance measures, a preliminary outline of critical research areas, and the performance measure documentation sheets. Additional supporting documents are required to complete this plan. These include the implementation strategy, the monitoring network and sampling design, the adaptive assessment process, and the supporting research requirements. In addition, the AAT is conducting a review of current and baseline monitoring efforts as they pertain to the performance measures, and a review of other large-scale ecological restoration programs
to learn how they developed and implemented their own monitoring and assessment process.
Over the next six months, the supporting documents will be developed and incorporated into the Plan (Fig 1). During this time, the Plan is also being distributed to a number of groups and agencies to solicit review comments. A technical workshop will also be held to present the final Plan and address any remaining issues. It is anticipated that the final Monitoring and Assessment Plan will be available by September 2000, with initial implementation of the plan occurring immediately thereafter.
Implementation of the monitoring and assessment activities is envisioned to be a phased effort, with the initial focus on filling the gaps in essential baseline data. The first year will also focus on optimizing the monitoring network and sampling design with the goal of incorporating those existing monitoring efforts that are consistent with the intent of the Plan. The final schedule will consider the time necessary for equipment purchase and installation, database development and set up, and quality assurance/quality control procedures. Initiation of monitoring at specific sites or regions will be coordinated with implementation of the various CERP components.
The CERP monitoring program consists of approximately 150 different biological, hydrological and water quality parameters. No single agency can or should have responsibility for conducting the full suite of monitoring tasks. Although lead responsibility for funding and implementing this monitoring program is held by the USACE and the SFWMD, the success of this program will depend on a long-term participation by a number of different south Florida resource agencies. Following are suggested guidelines for some of the tactical steps required to implement the CERP monitoring program. Some of these steps are, by necessity, sequential but many may be conducted simultaneously.
Selection of Performance Measures
-
Determine the parameters of the natural and human systems in south Florida to be monitored, those which will best measure the success of CERP.
Peer Review of Plan
-
Conduct an internal review of the monitoring plan within the SFWMD and USACE.
-
Provide for external peer review of the monitoring plan (SCT, CROGEE).
-
Introduce the monitoring plan to the south Florida agencies through the agency representatives on RECOVER, and through the South Florida Ecosystem Restoration Working Group.
-
Facilitate agency reviews of the monitoring plan.
Monitoring Network Spatial and Temporal Design
-
Review and evaluate regional monitoring programs for other large restoration efforts for their extent, operational protocols, data management processes, and funding basis relative to long-term needs of CERP (LTR program, EMAP, Kissimmee River, etc.).
-
Bring in experts on monitoring network development and design methods, as well as on evaluating and determining monitoring methods and protocols for each performance measure.
-
Identify the elements of the CERP monitoring program that are currently being monitored by one or more agencies, and incorporate, to the extent practical, these existing monitoring networks and infrastructure to achieve the objectives of adaptive assessment, while still meeting individual agency needs.
-
Lay out and optimize the network at spatial scales and over time periods that are consistent with the scales of the implementation schedule for CERP and the expected system responses.
Monitoring Network Implementation Flexibility
-
Design and implement the monitoring program with monitoring stations being phased in over the next one to three years.
-
Where appropriate, refine and redirect existing environmental monitoring to better focus on needs of CERP.
-
Identify monitoring gaps.
-
Create a monitoring schedule, based on a prioritization process that focuses first on integrating existing monitoring programs and on new baselines (where none exist) that need to be established prior to implementation of the restoration program.
Capture and Inventory Historical Data for Performance Measures
-
Conduct an inventory/analysis of existing historical performance measure data and determine a process for acquiring the data, evaluating its quality and organizing it for archival in the CERP data management system.
Assign Monitoring Responsibilities
-
Assess the type and extent of external agency involvement in the implementation of monitoring tasks and determine which agency will be responsible for monitoring what performance measures and where.
-
Assign to an appropriate entity, the responsibility for general oversight of the day-to-day operations and maintenance of the overall system.
Establish Standard Operating Procedures
-
Develop protocols and standard operation procedures for data collection (i.e. sampling methods for each performance measure), instrumentation, data processing, lab analysis, quality control and assurance, flow and load calculation methods, and reporting format/schedule.
-
Work with CERP Data Management Program team to establish a set of standards, process procedures and tools to effectively quality assure/quality control data and ensure it can be easily stored, accessed and retrieved, and transferred. Such standards and procedures include those for data validation and formatting criteria, station naming conventions, and metadata requirements (e.g., site registration, GPS coordinates, vertical datum, etc.) for the performance measures.
Integrate Program with Research and Projects
-
Integrate RECOVER monitoring and assessment program with other research and modeling efforts and develop linkages between the RECOVER monitoring and project-specific monitoring.
Procurement Strategy
-
Develop a SFWMD/USACE procurement strategy for monitoring services and resources that includes identification of outsourcing opportunities and possible M/WBE vendors and contractors
-
Pre-qualify expertise of contractors.
-
Develop standard scopes of work for MOUs, MOAs, contracts etc. with agencies and laboratories that will be collecting and analyzing data for the system-wide monitoring network.
-
Outline a prioritization schedule for procuring required monitoring system instrumentation (telemetry, CR10s, autosamplers, etc.) and other capital needs as each phase of monitoring is implemented.
Review and Assess Effectiveness of Monitoring Program
-
Conduct annual reviews of the monitoring program to determine the effectiveness of the program for measuring system responses and supporting an adaptive assessment process. The plan will be periodically fine tuned on a scientifically informed basis,
including refining and enhancing performance measures to optimize the network, as needed.
-
The AAT will prepare an annual adaptive assessment report on system responses, and will identify where CERP refinement may be needed.
In the development and selection of performance measures and the resultant monitoring and assessment plan, there are varying degrees of certainty regarding the expected system response as we construct and operate the various CERP projects. Performance measures derived from predictive models that have been calibrated and verified with empirical data, or through cause-and-effect experimentation, provide the most certainty as to their accuracy. However, this type of in-depth analysis and documentation of ecological processes is not routine or uniform across the ecosystem. Many of the performance measures are based on indirect, correlative approaches or best professional judgement. Therefore, it is anticipated that unexpected or “negative” responses may occur as we move through the CERP program.
To illustrate, each conceptual model for CERP links ecosystem stressors to attributes via a series of causal pathways. The linkages between stressors and attributes are the basis for predicted responses of the attributes to changes in the stressors. The linkages represent the present state of scientific knowledge of the ecosystem regarding causal effects of the hydrologic and water quality stressors on the attributes. The level of certainty in each linkage may vary from published causal relationships and models, to ongoing research and unpublished data, to research in comparable ecosystems, to field observations, to best professional judgement. Because large, complex ecosystems such as the Everglades may never be wholly understood or predictable based on research and modeling, the causal linkages represent working hypotheses with varying levels of certainty.
The levels of certainty in the conceptual ecological model linkages affect our ability to interpret ecological changes that are detected through the monitoring and assessment plan. Interpreting an ecosystem change during the implementation of CERP requires an understanding of the causal relationships of the ecological indicators to hydrology, water quality and other stressors that may be outside the influence of CERP. This will be particularly true when unexpected ecological responses occur. Understanding why unexpected responses occur will be fundamental to the role of adaptive assessment in guiding CERP throughout its implementation.
Assessment of the varying levels of certainty in the conceptual model linkages indicates strengths and weaknesses in the restoration expectations of CERP and in our ability to interpret ecological changes toward, or away from, those expectations. Low levels of certainty in the linkages identify highest-priority areas of research necessary to support and supplement the monitoring and assessment plan. Thus the conceptual models, and the levels of certainty in their linkages, yield a strategy for prioritized research and modeling, described in Section IV, that is driven by the adaptive assessment process.
The implementation of the monitoring and assessment plan will, over time, additionally help to raise the levels of certainties of CERP-related effects on the south Florida ecosystem.
This section does not attempt to specifically answer the question of what is successful restoration. Rather it raises several key issues and identifies the key discussions that must occur on a continuing basis during the implementation of CERP, if a broad consensus regarding a collective vision of a successful restoration program is to be maintained and strengthened. To a large extent, the question of “what is successful restoration?” should strongly influence the decisions of “what should be monitored?”.
The question of what is, or is not, successful restoration, is a complex issue, one that continues to be discussed by both scientists and the broader public. It is acknowledged that there currently is a range of definitions of “success” for CERP. The range of views on this question simply illustrates that there are many legitimate criteria that have been proposed for use in characterizing healthy, "restored" natural and human systems. Depending on which criteria are preferred, and there are different views on how the priorities should be set, there are different elements of these systems that can serve as indicators of successful restoration. Continuing discussion of these questions will result in the addition of new performance measures and in improvements to the existing set of measures.
CERP contains both natural system and human system goals. The performance measures and monitoring plan address an array of system-wide biological, ecological, water quality, water distribution, and depth and flow, water supply and flood protection objectives. Broadly stated, the success of CERP will have been achieved when the objectives described by the full suite of performance measures have been reached.
In the natural system, it is widely acknowledged that ultimate success should be determined through measures of ecological and biological responses. Hydrological and water quality objectives are essential precursors to the realization of the overall natural system restoration goals. How closely CERP must achieve these precursor objectives in order to meet its ecological objectives remains uncertain, in a system that is so greatly altered spatially, and where pre-drainage hydrological and ecological linkages are incompletely known.
A more pragmatic question is to ask how many, and which, of the total number of performance measures must be achieved before the plan is considered successful? And how closely to the desired objective that have been established for each measure does the plan’s performance need to come? These questions over time will become more easily answered as understandings and agreements of what actually constitutes a healthy, “restored” natural system improve. The combined effects of continuing research coupled with improvements in public understandings of the natural systems of south Florida will inevitably lead to a growing consensus regarding the qualities of healthy
natural and human environments. The current Comprehensive Everglades Restoration Plan, according to modeling, is predicted to return the natural system to a hydrological and ecological condition that is well within the boundaries of a “restored system” as defined by the performance measures used during the Central and Southern Florida Restudy. CERP is predicted also to largely meet its water supply objectives. The role of the monitoring plan and the adaptive assessment process are to increase the chances that these predictions are correct, while at the same time “raising the bar” for the overall objectives of CERP.
The following people served as members of the ad hoc editorial team that drafted the CERP system-wide monitoring and assessment plan. For additional information on the monitoring and assessment plan, contact either of the AAT co-chairs, Laura Brandt (laura_brandt@fws.gov) or Susan Gray (sgray@sfwmd.gov), or the SFWMD’s RECOVER Program Manager, John Ogden (jogden@sfwmd.gov).
Tomma Barnes, South Florida Water Management District
Laura Brandt, U.S. Fish & Wildlife Service
Cheryl Buckingham, U.S. Army Corps of Engineers
Steve Davis, South Florida Water Management District
Juan Diaz-Carreras, South Florida Water Management District
Mike Duever, South Florida Water Management District
Susan Gray, South Florida Water Management District
Eric Hughes, U.S. Environmental Protection Agency
Linda Lindstrom, South Florida Water Management District
Agnes McLean, South Florida Water Management District
Brenda Mills, South Florida Water Management District
John Ogden, South Florida Water Management District
Joe Walsh, Florida Fish & Wildlife Conservation Commission
This section provides the recommended set of performance measures that form the foundation for the RECOVER monitoring and assessment program. It presents a technical documentation sheet for each recommended performance measure and identifies the categories of information that can be gained by monitoring each parameter. Each documentation sheet describes the parameter of the natural or human systems to be measured, in what geographic regions it is to be measured, and the restoration target. The details of how each parameter is to be measured, how the overall monitoring plan will be designed, (including further review of all of the performance measures to identify the most efficient, informative and cost-effective set of measures to support this regional monitoring program), and how the results of the monitoring will be evaluated will be developed by the AAT over the next few months from the general guidelines outlined in the Introduction
The current list of 156 CERP performance measures was developed from three categories of measures (Biological and Soils; Hydrologic; Water Quality) through a series of steps conducted by the AET and, more recently, by several teams of RECOVER. These steps were:
-
AET created a set of approximately 900 hydrological and water quality performance measures (with restoration targets) and performance indicators (without targets) used to evaluate alternative plans during the C&SF Restudy process.
-
AAT created additional biological performance measures based on the biological attributes in the nine conceptual ecological models.
-
RET removed all performance measures/indicators from the original AET list that lacked restoration targets (all indictors) or were not used by the AET during the Restudy plan evaluations.
-
The RET then organized the resulting set of hydrological performance measures into categories, screened and synthesized them within each category to create a new set of performance measures.
-
WQT developed a revised set of water quality performance for each region.
-
A technical documentation sheet for each performance measure was submitted to the AAT, RET or WQT.
-
AAT organized the biological and soil performance measures into broad categories, screened, and synthesized the measures within each category to create a list of 56 biological and 5 soil CERP performance measures.
-
WQT organized the water quality performance measures, screened and synthesized the measures to create a list of approximately 73 water quality CERP performance measures.
-
AAT and WQT teams categorized all performance measures according to the kinds of information that the monitoring data from each will provide to the assessment process.
-
The measures created by the AAT, RET and WQT were combined into a “final” list of approximately 156 CERP performance measures. Additional information on the screening and categorization criteria are provided below.
Most monitoring plans fail because they try to do too much, exceed their resources, and in the end, fail to do enough. It was recognized that, even though the list of potential ecological performance measures had been limited to only a few hundred as compared to the almost infinite list of possible measures, it would still be impossible to monitor all of them everywhere. Therefore, a screening procedure was developed to review the submitted performance measures for the information that could be gained from them and their value to the monitoring plan.
The submitted performance measures were organized into the broad categories of:
-
Biological-Animal including endangered species, keystone species, exotics, communities, and productivity, which were evaluated by the AAT.
-
Biological-Plants including communities, invasive exotic and native species, and productivity, which were evaluated by the AAT.
-
Soils, which were evaluated by the AAT.
-
Water Quality, which were evaluated by the WQT
-
Hydrologic including water supply, flood control, and natural system regimes, which were evaluated by the RET.
Once the biological and soil performance measures were appropriately grouped, they were further evaluated to determine if any could be combined where the same performance measure was listed from multiple conceptual models, or where two or more were measuring the same components of the system, or could be monitored using similar procedures. This process helped to reduce the number of performance measures and provided a group of consolidated performance measures that could be evaluated for inclusion in the monitoring and assessment plan.
This grouping process condensed the number of biological and soils performance measures to a number still too large for a long term, sustainable monitoring plan. Therefore, a series of screening criteria were used to determine if the consolidated performance measures were suitable for inclusion in the CERP monitoring and assessment plan. In developing the criteria the AAT Editorial Team relied heavily on the list of general criteria developed by The National Research Council for ecological
indicators for the nation (National Research Council 2000, Ecological Indicators For The Nation. National Academy Press, Washington, DC). In that document, they state, in part that “the challenge is deciding which rates of change to watch, and to determine which of the changes observed represent significant departures from expected natural variability.” The AAT Editorial Team derived from the NRC list seven areas that should be considered in evaluating CERP performance measures. These fall generally into the four phases (Conceptual Relevance; Feasibility of Implementation; Response Variability; Interpretation and Utility) for indicator evaluation developed by the Environmental Protection Agency to assist with their Environmental Monitoring and Assessment Program (Jackson, Laura E., Janis C. Kurtz, William S. Fisher. 2000. Evaluation Guidelines for Ecological Indicators. U.S. Environmental Protection Agency Office of Research and Development, Research Triangle Park, NC).
Conceptual Relevance
Conceptual Model Basis. Is a performance measure based on one or more of the CERP conceptual models? (This criterion does not apply to performance measures for agricultural and urban water supply, flood control, and water quality which are not based on conceptual models at this time.)
General Importance. Does a performance measure provide information about one or more of the following: multiple ecological attributes, multiple conceptual models, important ecological processes, and major environmental changes?
Avoidance of duplication. Do two or more performance measures indicate the same environmental change or ecological response?
Interpretation and Utility
Well-defined Targets. Is the restoration target for the performance measure clearly identified in the conceptual model(s) as an expected response to changes in hydrology and/or water quality due to the implementation of CERP?
Response Variability
Temporal and Spatial Scales. COMMENT: I’m not sure what the previous sentence means. Seems like the next two sentences cover the ground adequately. “Can the performance measure detect changes at appropriate temporal and spatial scales without being overwhelmed by variability?” Does the suite of selected performance measures cover a wide range of appropriate temporal and spatial scales?
Reliability. Has the successful previous use of a performance measure demonstrated its reliability as an indicator of environmental changes that are relevant to CERP? Regarding statistical properties, has the performance measure been shown to serve its intended purpose? “Is the indicator sensitive enough to
detect important changes but not so sensitive that signals are masked by natural variability?” A new performance measure that is needed to track an ecological response, but that has yet to be fully developed and tested, may be identified as a research priority in support of the monitoring plan.
Feasibility of Implementation
Cost-effectiveness. The above criteria determine the value of the information yielded by a performance measure, without regard to cost-effectiveness. If that information is found to be essential, can it be obtained for less cost in another way?
Evaluations to date have focused primarily on the assessment of Conceptual Relevance and Interpretation and Utility. Each performance measure was subjected to a screening process using the following criteria:
-
Is the performance measure expected to change DIRECTLY in relation to CERP (is there a clear linkage between the performance measure and the predicted changes from implementing CERP).
-
Is the performance measure in a conceptual model (applicable to biological and soil performance measures only)
-
Does the performance measure have a clearly defined target?
Any performance measure not meeting all of the above criteria was not considered for inclusion in the monitoring plan. The remaining biological and soils performance measures were then evaluated for their ability to provide information on the following:
-
Is it an indicator of an important ecological process? (Processes were considered things such as food webs, energy transfer, etc.).
-
Is it an indicator of important ecological structure? (Including being an indicator for things such as fragmentation, compartmentalization, succession, disturbance)
-
Is it a clear indicator of major environmental change? (Hydrology, Fire, Water Quality, Exotics).
Animal performance measures were further reviewed using:
-
Is the indicator a State or Federally listed Threatened or Endangered Species?
-
Does it have high aesthetic value, high public appreciation/ symbol of the Everglades?
-
Does it have important recreational value (fishing, boating, bird-watching, etc.)?
-
Does it have important commercial value (fisheries)?
The result of this process are presented in TableIII-1
Table III-1 - Biological Performance Measures
|
Category |
Unique ID |
Performance Measure |
Conceptual Models that contain the Attribute |
Ecological Process |
Ecological Structure |
Environmental Change |
Temporal Scale |
Threatened, Endangered, or SSC |
High Aesthetic value |
Important recreational Value |
Important Commercial Value |
|
Soil |
S01 |
accretion - negative shoreline organic berm LOK |
Lake Okeechobee |
|
X |
X |
|
|
|
|
|
|
Soil |
S02 |
shoreline habitat - Indian River Lagoon |
St Lucie Estuary |
X |
X |
X |
|
X |
|
X |
X |
|
Soil |
S03 |
Wetland soil accretion in greater Everglades |
Ridge/Slough, Mangrove Estuarine Transition, Marl Prairie, Big Cypress |
X |
|
X |
|
|
|
|
|
|
Soil |
S04 |
St Lucie Estuary Muck Removal |
St Lucie Estuary |
X |
X |
X |
|
|
|
|
X |
|
Soil |
S05 |
MTZ Soil Nutrient Dynamics |
Mangrove Transition Zone |
X |
|
X |
|
|
|
|
|
|
Animal |
A01 |
Snail Kite Nesting |
Lake Okeechobee |
|
|
|
M |
X |
|
|
|
|
Animal |
A02 |
Wading Bird Nesting |
Florida Bay, Lake Okeechobee, Mangrove Estuarine Transition, Big Cypress, Ridge & Slough |
X |
X |
X |
M |
X |
X |
X |
|
|
Animal |
A03 |
Wintering Waterfowl population estimates |
Mangrove Estuarine Transition |
|
X |
X |
M |
|
X |
|
|
|
Animal |
A04 |
Juvenile crocodile growth, survival, and condition |
Biscayne Bay, Mangrove Estuarine Transition |
|
X |
X |
M |
X |
|
|
|
|
Animal |
A05 |
Deer numbers and distribution |
Big Cypress |
|
X |
X |
M |
|
X |
X |
|
|
Animal |
A06 |
Crocodile distribution and relative abundance |
Biscayne Bay, Mangrove Estuarine Transition |
|
X |
X |
M |
X |
X |
|
|
|
Animal |
A08 |
Manatee Number and distribution |
Caloosahatchee and Biscayne Bay |
|
X |
X |
L |
X |
X |
X |
|
|
Animal |
A09 |
Manatee Mortality |
Caloosahatchee and Biscayne Bay |
|
|
|
L |
|
X |
|
|
|
Animal |
A10 |
Alligator Abundance, distribution, and size classes |
Marl Prairie, Big Cypress, Lake Okeechobee, Mangrove Estuarine Transition, Ridge & Slough |
X |
X |
X |
M |
|
X |
X |
X |
|
Animal |
A11 |
Alligator nesting effort and success |
Marl Prairie, Big Cypress, Lake Okeechobee, Mangrove Estuarine Transition, Ridge & Slough |
X |
X |
X |
L |
|
|
|
X |
|
Animal |
A12 |
Alligator condition |
Marl Prairie, Big Cypress, Lake Okeechobee, Mangrove Estuarine Transition, Ridge & Slough |
X |
|
X |
M |
|
|
|
|
|
Animal |
A13 |
Alligator hole distribution and occupancy |
Marl Prairie, Ridge & Slough |
X |
X |
X |
M |
|
|
|
|
|
Animal |
A14 |
Wading bird feeding aggregations |
Lake Okeechobee, Marl Prairie |
X |
|
X |
M |
|
X |
|
|
|
Animal |
A15 |
Dolphin Health Profile ??? |
Biscayne Bay |
X |
|
|
L |
|
X |
X |
|
|
Animal |
A16 |
Juvenile Pink Shrimp Density |
Florida Bay, Biscayne Bay |
|
|
X |
M |
|
|
|
|
|
Animal |
A17 |
Pink Shrimp Catch Rates |
Florida Bay, Biscayne Bay |
|
|
X |
M |
|
|
X |
X |
|
Animal |
A18 |
Abnormal Fish Prevalence |
Biscayne Bay, Florida Bay?? |
|
|
|
|
|
|
|
|
|
Animal |
A19 |
Estuarine Aquatic Fauna; Macroinvertibrates |
Florida Bay, Biscayne Bay, Caloosahatchee Estuary, St. Lucie Estuary |
X |
X |
X |
M |
|
|
|
|
|
Animal |
A20 |
Estuarine Fish Community |
Florida Bay, Mangrove Estuarine Transition, Biscayne Bay, Caloosahatchee Estuary, St. Lucie Estuary |
X |
X |
X |
M |
|
|
X |
|
|
Animal |
A21 |
Wetland Aquatic Fauna |
Ridge & Sough, Marl Prairie, Mangrove Estuarine Transition, Big Cypress, Lake Okeechobee |
X |
X |
X |
S |
|
|
X |
X |
|
Animal |
A22 |
Lake Okeechobee Fisheries Monitoring |
Lake Okeechobee |
X |
X |
X |
M |
|
|
X |
X |
|
Animal |
A24 |
Cape Sable Seaside Sparrow |
Marl Prairie |
|
X |
X |
M |
X |
|
|
|
|
Animal |
A25 |
Oyster Distribution, Abundance and Condition |
St Lucie Estuary, Caloosahatchee |
|
X |
X |
M |
|
|
X |
X |
|
|
|
|
|
|
|
|
|
NOT APPLICABLE for PLANTS |
|||
|
Plants |
P01 |
Cattail extent |
Ridge and Slough |
X |
|
X |
L |
|
|
|
|
|
Plants |
P02 |
Coastal Lakes and Basins Submerged Aquatic Vegetation |
Mangrove Estuary Model |
|
|
|
M |
|
|
|
|
|
Plants |
P03 |
Community composition of cypress forests |
Big Cypress |
X |
X |
X |
M |
|
|
|
|
|
Plants |
P04 |
Community composition of hammocks |
Big Cypress |
X |
X |
X |
M |
|
|
|
|
|
Plants |
P05 |
Community composition of herbaceous wetlands |
Big Cypress |
X |
X |
X |
M |
|
|
|
|
|
Plants |
P06 |
Community composition of mesic pineland |
Big Cypress |
X |
X |
X |
M |
|
|
|
|
|
Plants |
P07 |
Diverse littoral zone native plant community |
Lake Okeechobee |
|
X |
X |
L |
|
|
|
|
|
Plants |
P08 |
Forested Wetland Plant Communities |
Big Cypress |
X |
X |
X |
M |
|
|
|
|
|
Plants |
P09 |
Manatee Habitat |
Caloosahatchee Estuary and Biscayne Bay |
|
X |
X |
M |
|
|
|
|
|
Plants |
P10 |
Mangrove presence, distribution, health, relative abundance |
Caloosahatchee Estuary |
X |
X |
X |
M |
|
|
|
|
|
Plants |
P11 |
Marl Prairie Vegetation Mosaic |
Marl Prairie |
X |
X |
X |
M |
|
|
|
|
|
Plants |
P12 |
Panther habitat |
Big Cypress |
|
X |
X |
M |
|
|
|
|
|
Plants |
P13 |
Periphyton |
Ridge & Slough |
X |
X |
X |
M |
|
|
|
|
|
Plants |
P14 |
Periphyton mat cover, organic-inorganic production, and marl accretion |
Marl Prairie |
X |
X |
X |
M |
|
|
|
|
|
Plants |
P15 |
Phytoplankton primary productivity in Lake Okeechobee |
Lake Okeechobee |
X |
X |
X |
L |
|
|
|
|
|
Plants |
P16 |
Plant community gradients |
Big Cypress |
X |
X |
X |
M |
|
|
|
|
|
Plants |
P17 |
Plant community mosaic |
Big Cypress |
X |
X |
X |
M |
|
|
|
|
|
Plants |
P18 |
Plant vegetation dynamics |
Mangrove Estuarine Transition |
X |
X |
X |
L |
|
|
|
|
|
Plants |
P19 |
Sawgrass and slough spatial coverage and orientation |
Ridge and Slough |
X |
X |
X |
L |
|
|
|
|
|
Plants |
P20 |
Sea Grasses Abundance - Caloosahatchee |
Caloosahatchee Estuary |
X |
X |
X |
M |
|
|
|
|
|
Plants |
P21 |
Seagrasses Biscayne Bay |
Biscayne Bay |
|
|
|
M |
|
|
|
|
|
Plants |
P22 |
Seagrasses Florida Bay |
Florida Bay |
X |
X |
X |
M |
|
|
|
|
|
Plants |
P23 |
Spatial extent of continuous bulrush stands |
Lake Okeechobee |
|
X |
X |
L |
|
|
|
|
|
Plants |
P24 |
Spatial extent of invasive exotic plants in Lake Okeechobee |
Lake Okeechobee |
|
X |
|
L |
|
|
|
|
|
Plants |
P25 |
Submerged aquatic vegetation St Lucie Estuary |
St. Lucie Estuary |
X |
X |
X |
M |
|
|
|
|
|
Plants |
P26 |
Submerged Aquatic Vegetation Coastal Lake |
Mangrove Estuarine Transition |
X |
|
X |
M |
|
|
|
|
|
Plants |
P27 |
Submerged Aquatic Vegetation Lake Okeechobee |
Lake Okeechobee |
X |
X |
X |
M |
|
|
|
|
|
Plants |
P28 |
Tree island structure and function |
Ridge and Slough |
X |
X |
X |
M |
|
|
|
|
|
Plants |
P29 |
Upland/Wetland Mosaic for Indian River Lagoon |
St Lucie Estuary |
X |
X |
X |
M |
|
|
|
|
|
Plants |
P30 |
Wetland community composition |
Big Cypress |
X |
X |
X |
M |
|
|
|
|
|
Plants |
P31 |
Oyster Habitat |
St Lucie Estuary |
|
X |
X |
M |
|
|
|
|
The second broad category of performance measures are specific to the hydrology of the natural and human systems in south Florida. For the natural system two categories of hydrological performance measures have been created by the RET. One set is based on pre-drainage hydrological patterns predicted by the Natural System Model. This set uses these pre-drainage hydropatterns as targets for restoration. A key tenet of south Florida ecosystem restoration is that hydrologic restoration is a necessary starting point for ecological restoration. The second category of hydrological performance measures are those that define desirable characteristics of wetland systems, which differ from pre-drainage conditions. The measures in this second category are influenced by regional management constraints (e.g., Lake Okeechobee lake levels) or reflect more modern views of desirable ecosystem conditions (e.g., estuarine salinty patterns that may differ from pre-drainage conditions). COMMENT: I thought non-NSM targets were always a result of management constraints (e.g., Biscayne Bay, Caloosahatchee River, WCAs and Lake Okeechobee).
Both categories of natural system hydrological measures are derived from the hydrological stressors contained in the conceptual ecological models. Originally these stressor-based performance measures were developed by the AET to set a number of hydrologic targets for restoration that could be simulated by computer models as a basis for evaluating alternative plans during the Restudy. A highly modified set of hydrological performance measures is finding application in the CERP monitoring plan. The hydrologic performance measures are included in this monitoring plan for their value in setting hydrological restoration and water supply targets for CERP, which when compared to actual field measurements will allow us to assess how well CERP corrects the hydrologic problems in the natural and human systems.
The hydrologic performance measures listed in Table III-2 represent the current set of performance measures necessary to assess changes in the stressors resulting from CERP actions. They define hydropatterns for the different Everglades ecosystems, e.g., ridge and slough, marl prairie, the range of water flows to sustain estuaries and bays, and the ability to meet the water supply and flood protection needs of the human systems. Because all of the proposed hydrological performance measures have their origin either as stressors in the conceptual ecological models or are based on water supply policy or law, no screening or ranking of these measures by the RET was necessary. All are included in the monitoring plan because CERP is designed to correct the problems caused by all of the hydrological stressors
Table III-2 Hydrologic Performance Measures
|
Category |
Unique ID |
Performance Measure |
|
Hydrologic |
H1 |
Lake Okeechobee Extremes in Low Lake Stages |
|
Hydrologic |
H2 |
Lake Okeechobee Extremes in High Lake Stages |
|
Hydrologic |
H3 |
Spring Recession for Lake Okeechobee |
|
Hydrologic |
H4 |
St. Lucie Estuary Salinity Envelope |
|
Hydrologic |
H5 |
Lake Worth Salinity Envelope |
|
Hydrologic |
H6 |
Salinity Envelope for Caloosahatchee Estuary |
|
Hydrologic |
H7 |
Average Inundation Duration for Greater Everglades |
|
Hydrologic |
H8 |
Number of Dry Events in Greater Everglades |
|
Hydrologic |
H9 |
Duration of Water Level Deviation from NSM in Greater Everglades |
|
Hydrologic |
H10 |
Extreme Low Water Levels in Ridge and Slough Ecosystems |
|
Hydrologic |
H11 |
Extreme High Water Levels in Ridge and Slough Ecosystems |
|
Hydrologic |
H12 |
Seasonal Amplitude and Interannual Variability of Water Levels in Greater Everglades |
|
Hydrologic |
H13 |
Seasonal and Annual Overland Flow Volume in Greater Everglades |
|
Hydrologic |
H14 |
Tree Island Hydrologic Impacts |
|
Hydrologic |
H15 |
Model Lands/C-111 Hydrologic Performance Measure Suite |
|
Hydrologic |
H16 |
Surface Water Discharges to Biscayne Bay |
|
Hydrologic |
H17 |
Florida Bay - Surface Water Flows |
|
Hydrologic |
H18 |
Lake Okeechobee Service Area - Frequency of Water Restrictions |
|
Hydrologic |
H19 |
Frequency of Water Restrictions for the Lower East Coast Service Area |
|
Hydrologic |
H20 |
Potential for High Water Levels in South Miami-Dade Agricultural Area |
|
Hydrologic |
H21 |
Prevent Salt Water Intrusion of the Biscayne Aquifer: Meet Minimum Flow and Level criteria for Biscayne Aquifer |
|
Hydrologic |
H22 |
Prevent Salt Water Intrusion of Biscayne Aquifer in South Miami-Dade County |
|
Hydrologic |
H23 |
Continuity: Water Surface Elevations across Barriers |
|
Hydrologic |
H24 |
Sheetflow: Volume of Water Across Transects in the WCAs and Everglades National Park |
For the water quality component of the monitoring and assessment plan, the list of AET performance measures was expanded to over 70 performance measures by members of the RECOVER WQT. Measures were developed on a region-by-region basis to capture the unique conditions of each of the main physiographic regions in South Florida. As a consequence, there are multiple performance measures for what appears to be the same water quality parameter; however, each one has a restoration target unique to a specific region. The WQT discussed, agreed upon and went through an evaluation process to assess and better understand the informational quality/applicability of each of the water quality performance measures. However, this process was somewhat different from that conducted for the biological performance measures, in that the evaluations were made based upon a unique set of criteria that the WQT felt was more applicable to water quality. Each measure was initially screened as to whether it:
-
Would likely change in response to the implementation of CERP components.
-
Would be a regional indicator of CERP performance (vs. a project-level measure).
-
Had a clearly defined restoration target.
If the performance measure did not meet all three criteria, it was not considered for inclusion in the monitoring plan. The set of water quality performance measures remaining for each of the geographical regions from this initial screening underwent further evaluation by the team using the following criteria:
-
Is the proposed performance measure a strong indicator of the health of the ecosystem or a major stress?
-
Does the performance measure have a strong regulatory basis?
-
Is the performance measure easy to use or implement?
-
Does the performance measure provide information not provided by other performance measures being recommended for the geographical region?
-
Does the performance measure have a relatively strong degree of predictability (i.e. can you easily distinguish changes resulting from CERP from those contributed by other factors, and is there a mechanism available to predict future performance of the performance measure?)
-
Does the performance measure have a relatively low measurement uncertainty?
The results of this evaluation are displayed in Table III-3.
Table III-3 Water Quality Performance Measures
|
|
|
|
|
EVALUATION CRITERIA |
|||||
|
Category |
Unique ID |
Performance Measures by Region (North to South) |
Conceptual Model |
Stong Indicator of Ecosystem Health or a Major Stress |
Strong Regulatory Basis |
Easy to use or implement |
Not duplicative of other performance measures |
Relatively strong degree of predictability |
Relatively low measurement uncertainty |
|
|
|
Lower Kissimmee River Basin |
|
|
|
|
|
|
|
|
Water Quality |
WQ1 |
TP Load Reduction at and downstream from S-65D |
|
X |
X |
X |
X |
X |
X |
|
Water Quality |
WQ2 |
Trace Metals (Mercury) at Highway 78 bridge |
|
X |
|
X |
X |
|
X |
|
|
|
Lake Okeechobee |
|
|
|
|
|
|
|
|
Water Quality |
WQ3 |
Phosphorus Loads |
Lake Okeechobee |
X |
X |
X |
X |
|
X |
|
Water Quality |
WQ4 |
Pelagic zone total phosphorus |
Lake Okeechobee |
X |
X |
X |
X |
X |
X |
|
Water Quality |
WQ5 |
Net P assimilative capacity |
Lake Okeechobee |
X |
X |
X |
X |
|
X |
|
Water Quality |
WQ6 |
Water Clarity |
Lake Okeechobee |
X |
X |
X |
X |
X |
X |
|
Water Quality |
WQ7 |
Pelagic zone algal bloom frequency based on chlorophyll a concentrations |
Lake Okeechobee |
X |
X |
X |
X |
X |
X |
|
Water Quality |
WQ8 |
Pelagic zone TN to TP ratio |
Lake Okeechobee |
X |
|
X |
X |
X |
X |
|
Water Quality |
WQ9 |
Sediment Porewater Phosphorus (P) |
|
X |
|
|
X |
X |
X |
|
Water Quality |
WQ10 |
Pelagic Zone Diatom; Cyanobacteria ratio |
|
X |
|
X |
X |
|
X |
|
Water Quality |
WQ11 |
Pelagic zone nutrient limitation status |
|
|
|
X |
|
|
|
|
|
|
Lake Okeechobee ASR |
|
|
|
|
|
|
|
|
Water Quality |
WQ12 |
Increase in Methly Mercury in surface waters in response to ASR activity related to increase in Sulfur |
|
X |
X |
X |
X |
|
|
|
Water Quality |
WQ13 |
Increase in Cl and salinity in L.O. in response to ASR Activity |
|
X |
X |
X |
X |
|
X |
|
|
|
Everglades Agric. Area/STAs |
|
|
|
|
|
|
|
|
Water Quality |
WQ14 |
WCA Inflow Phosphorus Concentrations |
|
X |
X |
X |
X |
X |
X |
|
Water Quality |
WQ15 |
WCA Inflow Phosphorus Loads |
|
X |
X |
X |
X |
X |
X |
|
Water Quality |
WQ16 |
STA Bypass Loads |
|
|
X |
X |
X |
X |
X |
|
Water Quality |
WQ17 |
Total Load Reductions in STAs & Reservoirs |
|
X |
X |
X |
X |
X |
X |
|
Water Quality |
WQ2 |
Trace Metals (Mercury) |
|
X |
X |
X |
X |
|
X |
|
|
|
Caloosahatchee River and Estuary |
|
|
|
|
|
|
|
|
Water Quality |
WQ18 |
Biochemical Oxygen Demand |
Caloosahatchee Estuary |
X |
X |
X |
X |
X |
X |
|
Water Quality |
WQ19 |
Total Phosphorus |
Caloosahatchee Estuary |
X |
X |
X |
X |
X |
X |
|
Water Quality |
WQ20 |
Dissolved Oxygen |
Caloosahatchee Estuary |
X |
X |
X |
X |
X |
X |
|
Water Quality |
WQ21 |
Chlorophyl a |
Caloosahatchee Estuary |
X |
X |
X |
X |
|
X |
|
Water Quality |
WQ22 |
Total Nitrogen |
Caloosahatchee Estuary |
X |
|
X |
X |
|
X |
|
Water Quality |
WQ23 |
Toxicity-Heavy Metals |
Caloosahatchee Estuary |
|
|
X |
|
|
|
|
Water Quality |
WQ24 |
Total and fecal coliforms |
Caloosahatchee Estuary |
|
X |
X |
X |
|
|
|
Water Quality |
WQ25 |
Organics (Pesticides) |
Caloosahatchee Estuary |
X |
X |
X |
X |
X |
X |
|
|
|
Caloosahatchee Basin/ASR |
|
|
|
|
|
|
|
|
Water Quality |
WQ12 |
Increase in Methlyl Mercury in in surface waters in response to ASR activity related to increase in Sulfate |
|
X |
X |
X |
X |
|
|
|
Water Quality |
WQ13 |
Increase in Cl and salinity in river in response to ASR activity |
|
X |
X |
X |
X |
|
X |
|
|
|
St. Lucie Estuary and Indian River Lagoon |
|
|
|
|
|
|
|
|
Water Quality |
WQ25 |
Organcis (Pesticides) |
SLE&IRL |
X |
X |
X |
X |
X |
X |
|
Water Quality |
WQ26 |
(TN Loads) - Reduce N Loads to estuary |
SLE&IRL |
X |
|
X |
X |
X |
X |
|
Water Quality |
WQ27 |
(TP Loads) -Reduce P Loads to estuary |
SLE&IRL |
X |
|
X |
X |
X |
X |
|
Water Quality |
WQ28 |
P Load to the IRL from C-25 and C-1 canals |
SLE&IRL |
X |
|
X |
X |
|
X |
|
Water Quality |
WQ29 |
N Load to the IRL from C-25 and C-1 canals |
SLE&IRL |
X |
X |
X |
X |
|
X |
|
Water Quality |
WQ30 |
Phytoplankton/Chlorophyll a |
SLE&IRL |
X |
|
X |
|
|
X |
|
Water Quality |
WQ31 |
Flow and TP loads to Lake Okeechobee |
|
X |
X |
X |
X |
|
X |
|
|
|
Lake Worth Lagoon |
|
|
|
|
|
|
|
|
Water Quality |
WQ32 |
TSS Loads |
|
X |
|
X |
X |
|
X |
|
Water Quality |
WQ33 |
P Loads |
|
X |
|
X |
X |
|
X |
|
Water Quality |
WQ34 |
N Loads |
|
X |
|
X |
X |
|
X |
|
|
|
Lower East Coast (North of Biscayne Bay) |
|
|
|
|
|
|
|
|
Water Quality |
WQ35 |
N Loads and Concentrations in waters delivered to tide through G56 (Hillsboro Basin) |
|
X |
X |
X |
X |
X |
X |
|
Water Quality |
WQ36 |
P Loads and Concentrations in waters delivered to tide through G56 (Hillsboro Basin) |
|
X |
X |
X |
X |
X |
X |
|
Water Quality |
WQ37 |
P Loads and Concentrations in waters delivered to Loxahatchee Refuge (WCA-1) |
|
X |
X |
X |
X |
X |
X |
|
Water Quality |
WQ38 |
P Loads and Concentrations in waters delivered to WCA3 from C11 Basin |
|
X |
X |
X |
X |
X |
X |
|
|
|
Lower East Coast ASR |
|
|
|
|
|
|
|
|
Water Quality |
WQ12 |
Increase in Methlyl Mercury in in surface waters in response to ASR activity related to increase in Sulfate |
|
X |
X |
X |
X |
|
|
|
Water Quality |
WQ13 |
Increase in Cl and salinity in river in response to ASR activity |
|
X |
X |
X |
X |
|
X |
|
|
|
Greater Everglades - WCAs, ENP, eastern Big Cypress, Holey Land, Rotenberger, Model Lands/C-111 Basin |
|
|
|
|
|
|
|
|
Water Quality |
WQ25 |
Organics (Pesticides) |
ER&S |
X |
X |
X |
X |
|
X |
|
Water Quality |
WQ2 |
Trace Metals (Mercury) |
ER&S |
X |
X |
X |
X |
|
X |
|
Water Quality |
WQ39 |
Wetland Soil Phosphorus concentration |
ER&S |
X |
X |
X |
X |
X |
X |
|
Water Quality |
WQ40 |
Wetland Surface Water Phosphorus Mass/Area Loading |
ER&S |
X |
X |
X |
X |
X |
X |
|
Water Quality |
WQ41 |
Wetland Surface Water Phosphorus Concentration (includes WCA 3) |
ER&S |
X |
X |
X |
X |
X |
X |
|
Water Quality |
WQ42 |
Wetland Surface Water Phosphorus Mass Loading (includes WCA 3) |
ER&S |
X |
X |
X |
X |
X |
X |
|
Water Quality |
WQ43 |
Sulfate - surface water; sulfide/sulfate-porewater |
|
X |
X |
X |
X |
|
X |
|
Water Quality |
WQ44 |
Conductivity |
|
X |
X |
X |
X |
X |
X |
|
Water Quality |
WQ45 |
Total Organic Carbaon |
|
X |
|
X |
X |
|
X |
|
|
|
Miccosukee Reservation |
|
|
|
|
|
|
|
|
Water Quality |
WQ46 |
Total Phosphorus Concentration |
|
X |
X |
X |
X |
X |
X |
|
Water Quality |
WQ47 |
Total Phosphorus Load |
|
X |
X |
X |
X |
X |
X |
|
|
|
Big Cypress Seminole Reservation |
|
|
|
|
|
|
|
|
Water Quality |
WQ48 |
Quality of surface water entering reservation |
|
X |
X |
X |
X |
X |
X |
|
Water Quality |
WQ49 |
Quality of surface water leaving reservation |
|
X |
X |
X |
X |
X |
X |
|
|
|
Lower West Coast-Lake Trafford |
|
|
|
|
|
|
|
|
Water Quality |
WQ50 |
Dissolved Oxygen |
|
X |
X |
X |
X |
X |
X |
|
Water Quality |
WQ51 |
Trophic State Index |
|
X |
|
X |
X |
|
X |
|
|
|
Lower West Coast-Southern Golden Gates Estates |
|
|
|
|
|
|
|
|
Water Quality |
WQ52 |
Hardness Concentration |
|
X |
|
X |
X |
X |
X |
|
Water Quality |
WQ53 |
Phosphorus Concentrations |
|
X |
X |
X |
X |
X |
X |
|
|
|
Big Cypress Basin |
|
|
|
|
|
|
|
|
Water Quality |
WQ54 |
Mean wet season phosphorus concentration in SE and NE Big Cypress relative to 10 year POR |
Big Cypress Regional |
X |
X |
X |
X |
|
X |
|
Water Quality |
WQ2 |
Trace Metals (Mercury) |
Big Cypress Regional |
X |
|
X |
X |
|
X |
|
Water Quality |
WQ25 |
Organics (Pesticides) |
Big Cypress Regional |
X |
|
X |
X |
|
X |
|
|
|
Everglades National Park |
|
|
|
|
|
|
|
|
Water Quality |
WQ55 |
Flow-weighted mean TP concentrations entering Shark River Slough |
|
X |
X |
X |
X |
X |
X |
|
Water Quality |
WQ56 |
Frequency of Shark River TP inflow samples exceeding 10 ppb within a given 12-month period. |
|
X |
X |
X |
X |
X |
X |
|
Water Quality |
WQ57 |
Mean TP concentration at Shark River Slough marsh stations |
|
X |
X |
X |
|
X |
X |
|
Water Quality |
WQ58 |
Flow-weighted mean TP concentrations entering Taylor Slough/Coastal Basins |
|
X |
X |
X |
X |
X |
X |
|
Water Quality |
WQ59 |
Frequency of Taylor Slough TP inflow samples exceeding 10 ppb within a given 12-month period. |
|
X |
X |
X |
X |
X |
X |
|
Water Quality |
WQ60 |
Mean TP concentration at Taylor Slough/Coastal Basin marsh stations |
|
X |
X |
X |
|
X |
X |
|
|
|
Biscayne Bay |
|
|
|
|
|
|
|
|
Water Quality |
WQ61 |
Sediment Chemistry and Toxicity |
Biscayne Bay |
X |
X |
X |
X |
|
X |
|
Water Quality |
WQ62 |
Water Transparency |
Biscayne Bay |
X |
X |
X |
X |
|
X |
|
Water Quality |
WQ63 |
Total Coliform |
Biscayne Bay |
X |
X |
X |
X |
|
X |
|
Water Quality |
WQ64 |
Ammonia |
Biscayne Bay |
X |
X |
X |
X |
X |
X |
|
Water Quality |
WQ65 |
Total Nitrogen |
Biscayne Bay |
X |
X |
X |
X |
X |
X |
|
Water Quality |
WQ66 |
Total Phosphorus |
Biscayne Bay |
X |
X |
X |
X |
X |
X |
|
Water Quality |
WQ67 |
Nox |
Biscayne Bay |
X |
X |
X |
X |
X |
X |
|
|
|
Model Lands/C-111 Basin |
|
|
|
|
|
|
|
|
Water Quality |
WQ68 |
Mean TP concentration of inflow points to the South Dade Wetlands |
|
X |
X |
X |
X |
X |
X |
|
|
|
Florida Bay |
|
|
|
|
|
|
|
|
Water Quality |
WQ69 |
Toxics |
Florida Bay |
X |
X |
X |
X |
|
X |
|
Water Quality |
WQ70 |
Algal Blooms |
Florida Bay |
X |
|
X |
X |
|
X |
|
Water Quality |
WQ71 |
Nutrients |
Florida Bay |
X |
|
X |
X |
|
X |
|
Water Quality |
WQ72 |
Nutrient Loads |
Florida Bay |
X |
|
X |
X |
X |
X |
|
Water Quality |
WQ73 |
Light |
Florida Bay |
X |
|
X |
X |
|
X |
|
|
Note: |
|
|||||||
|
|
WQ1 |
Summary Sheet for Lower Kiss. River TP Load Reduction |
|
||||||
|
|
WQ2 |
Summary Sheet for Trace Metals |
|
||||||
|
|
WQ12 |
Summary Sheet for ASR Methyl Mercury |
|
||||||
|
|
WQ13 |
Summary Sheet for ASR - Cl and Salinity |
|
||||||
|
|
WQ25 |
Summary Sheet for (Organics) Pesticides |
|
||||||
|
|
WQ54 |
Summary Sheet for Big Cypress Mean Wet Season TP Concentration |
|
||||||
The documentation sheets presented here are for the set of 156 performance measures listed in Tables III-1 to 3. Each documentation sheet describes the performance measure, in what geographic regions it is to be measured, the restoration target, and a general description of the monitoring protocol. If the original sheets were combined or edited it is noted in the editing comments.
The 156 performance measures listed here linked with the key hypotheses in the conceptual models provide the basis for the monitoring and assessment plan. One of the next steps is to review the performance measures in the context of the ir linkages and uncertainties within the conceptual models and refine the monitoring and assessment plan to ensure that it addresses the key restoration hypotheses and focuses on a sustainable number of performance measures. The approach that will be used will examine the performance measures in an integrated hierarchical framework to ensure that the resulting plan will be holistic and include indicators at a range of temporal and spatial scales. The conceptual models will be further refined to focus on the most critical over-riding restoration hypotheses for each physiographic region. The models will be examined for logical groupings of performance measures, linkages, and key questions that will provide the essential information for the adaptive assessment process. The groupings within each model will be evaluated for their importance related to the success of CERP and the resulting groupings from each model will be reviewed together to ensure a system-wide perspective. It is anticipated that this process will be completed in the next 3-4 months.


