
2
Measuring Equal Opportunity: The Role of the E&S Survey
In education, civil rights always have been about equal access to the opportunity to learn for students from all backgrounds. In the 1960s, this was manifested primarily in the struggle to desegregate schools—and the sole purpose of the Elementary and Secondary Civil Rights Compliance Report was to provide information in support of that goal. In the greatly transformed educational landscape of the first decade of the 21st century, it is important to envision specifically what it means to ensure equal access to a high-quality education.
Over the years, the E&S survey has broadened its focus to include items that address a wide variety of potential violations of students’ civil rights. It has become an important, albeit underutilized, source of information regarding the prevalence of educational policies and practices that can restrict students’ learning opportunities. The Office for Civil Rights (OCR) of the U.S. Department of Education is obligated not only to take action against school districts that intentionally discriminate against students based on race, color, or national origin, but also Title VI regulations1 give OCR the authority to take enforcement action against educational policies and practices that result in discrimination (unjustified disparities).2 The regulations prohibit recipients of federal financial assistance from using “criteria or methods of administration which have the effect of subjecting
|
1 |
Section 602 of Title VI of the 1964 Civil Rights Act requires federal agencies to create regulations to implement the law (Ryan, 2002). The regulations specifying the Title VI enforcement responsibilities of the Office for Civil Rights are codified in Title 34, Subtitle B, Chapter 1, Part 100 of the Code of Federal Regulations. |
|
2 |
The disparate impact of a contested practice is unjustified if it can be shown that the disparity is caused by the contested practice and that the practice either does not serve the legitimate educational goals of the institution or effective alternative practices are available (Ryan, 2002). See Chapter 3 for a more complete discussion of this topic. |
individuals to discrimination because of their race, color, or national origin.” Policies and practices that result in discrimination may be barred through enforcement action by the department (Losen and Welner, 2002; Ryan, 2002).
It is important to note that the E&S survey was not designed primarily for use by academic researchers. Historically, its purpose has been to provide information to OCR and to members of the public, upon request, related to the compliance of individual schools and school districts with civil rights laws. As noted in an evaluation of the survey prepared for the Department of Education (WESTAT, 1997, p. 1), “OCR conducts the E&S survey to provide its regional offices with current data to use when targeting compliance review sites or to use as source material when investigating complaints.” However, the E&S survey is also used by civil rights advocacy groups for monitoring issues related to their mission and to inform and mobilize communities in school improvement efforts. Finally, the survey is used by social scientists conducting research on equality of access to high-quality education. This chapter describes characteristics of the survey that make it useful for civil rights enforcement, for research on patterns of access to learning opportunities, and as an information resource to inform public policy.
SURVEY CHARACTERISTICS
This section describes key features of the E&S survey. The entire 2000 survey is reproduced in Appendix C.
Mandatory and Certified as Accurate
The official name of the E&S survey is the Elementary and Secondary School Civil Rights Compliance Report. Unlike the surveys administered by the Department of Education’s National Center for Education Statistics (NCES), for which response is voluntary, schools and school districts are required to respond to the E&S survey and failure to respond could result in the loss of federal financial assistance.3 Response rates are close to 100 percent, so that OCR has a powerful mechanism for measuring compliance with civil rights laws and other public policy purposes.
The survey has two parts, ED 101 and ED 102. ED 101 is sent to the superintendents of school districts (local education agencies), who are required to certify that the data that they (or their designees) provide about their districts
|
3 |
As described in footnote 2 of Chapter 1, this authority is derived from Title VI regulations. It is important to note, however, that since the 1970s, the Office for Civil Rights rarely has used this power as a sanction for violation of civil rights (Halpern, 1995) or for failure to respond to the E&S survey (Rabekoff, 1990). |
are complete and accurate. ED 102 is sent to school principals, who are similarly required to certify that the information they provide is complete and accurate. The requirement that the data be certified is meant to deter respondents from reporting false information to OCR. Since data on race were not required in most states before the OCR regulations and some states had policies prohibiting them (Orfield, 1969), it is unlikely that state and local school authorities would collect the key OCR data elements without a mandatory policy.4
Data Identifiable for Specific Demographic Groups
The E&S survey contains data on access to opportunities to learn that are broken out by race, ethnicity, gender, and disability status—i.e., for those classes of students whose rights are specified in the civil rights laws that are the basis of the E&S survey. Basic racial and ethnic enrollment data were not routinely collected in the Common Core of Data (CCD) until 1987, 19 years after the launch of the E&S survey in 1968. Thus, the E&S survey provides the longest continuous record on the racial and ethnic composition of schools, as well as data disaggregated by race and ethnicity on participation in, and the consequences of, various educational practices of any Department of Education survey.
Besides race and ethnicity, the survey has also disaggregated data on a variety of topics by gender, English proficiency, and disability status since the mid1970s. For many issues addressed by the survey, the data can be disaggregated by multiple categories (e.g., race by gender or race and gender by disability status). Although other Department of Education surveys provide school information on many of the same issues that are covered by the E&S survey, few provide data that are disaggregated to show potential disparities associated with race, ethnicity, gender, language minority status, and disability status.5
Sampling and Timeliness
Generally, the Department of Education administers the E&S once every
|
4 |
Disaggregated data on opportunities to learn generally are not available in most member countries of the Organisation for Economic Cooperation and Development. For example, in some countries (e.g., France), it is illegal to collect and report data that are disaggregated by race (Orfield, 2001a). In certain states, including California, serious consideration has been given to prohibiting state agencies from compiling race data (see Sacramento Bee, May 1, 2002). |
|
5 |
Appendix D provides a detailed discussion of the similarities and differences of items on the E&S survey and to those from the CCD, the Early Childhood Longitudinal Study—Kindergarten Cohort (ECLS-K), and the 1988 National Educational Longitudinal Study (NELS:88). |
two years, in the even-numbered years. Between 1968 and 1972, the survey was administered annually. The survey was not administered in 1996. Because the survey is administered so frequently, the data about schools generally are more up to date than those available from other Department of Education databases, such as those derived from the NELS-88 or the High School and Beyond surveys. The frequency of the survey makes the data very useful in identifying patterns and changes in school district practices and results.
Except for 1976 and 2000, when the survey was administered to all schools and school districts in the United States, roughly one-third of the approximately 15,000 school districts in the country are included in the survey. School districts with at least 25,000 students are included in each administration of the survey so that sampled districts always include more than one-third of the nation’s schools and students. For example, in 1998, 37 percent of all school districts were included in the sample. These districts contained 61 percent of the nation’s public elementary and secondary schools and 77 percent of public school students enrolled in grades 1–12.6
Large urban school districts, which have a disproportionate share of minority students and students in poverty, have been included among the sampled districts in every administration of the survey. Also included in each administration of the survey are school districts that are under court order to eliminate civil rights violations. Because most of these districts are in the South, the survey has provided a more comprehensive view of districts in the South than in other parts of the country. Finally, a sample of smaller districts is included in each survey administration (WESTAT, 1997). Overall, the survey provides a continuous record on school civil rights issues that spans more than three decades and is disaggregated to show information for students from groups that are at greater risk of school failure.
Units of Analysis
The units of analysis for the E&S survey are school districts, individual schools, and selected classrooms within elementary schools. The E&S survey is a rare source of information for classroom-level data in the elementary grades. The survey collects information on the racial and ethnic composition of each classroom for the lowest grade in an elementary school (e.g., grade 1) and the highest grade (e.g., grade 6) and whether any ability grouping is used for instruction in those classrooms. How
ever, classroom assignment data are collected only from elementary schools in which the percentage of minority students is more than 20 percent but less than 80 percent.
The survey contains disaggregated group data for all schools in the sampled school districts. Obtaining information from nearly 100 percent of schools in the sampled districts enables one to examine issues for which more selective sampling strategies would not provide a sample of adequate size. Thus, the survey enables examination of disaggregated data at the school and district level that would not be possible using information derived from surveys with more selective sampling techniques.
Although the primary use of the survey has been to identify patterns that suggest potential violations of civil rights in individual schools and districts, the OCR also produces state and national data projections from the sampled schools.
Linking E&S Data to Other Databases
Because the E&S survey is administered so frequently to such a large sample, it is more costly and difficult than it is for smaller scale surveys to include additional questions that would help explain the significance of the simple correlations that can be identified with E&S survey data alone. This is a limitation that the E&S survey shares with other large-scale administrative surveys used for civil rights enforcement—e.g., EEO-1 of the Equal Employment Opportunity Commission and the Home Mortgage Disclosure Act survey of the U.S. Department of Housing and Urban Development (Ross and Yinger, 2002). Without additional information obtained from qualitative research or by linking to data from other surveys, the E&S survey can only highlight patterns of disparity that suggest problems of educational equity. Fortunately, E&S data can be linked to other datasets, considerably expanding their value; the E&S survey includes a school identifier code through which data for individual schools may be linked to information about the same schools from other federal and state surveys.
All of the analyses of E&S data overseen by this committee involved some linkage with the Department of Education’s CCD, other databases from the NCES, or education databases maintained by individual states.7 The
analyses addressed issues related to the following topics:
-
student discipline,
-
services for English-language learners in first grade,
-
the effects of high-stakes testing,
-
gender equity in interscholastic sports,
-
the characteristics of schools serving large numbers of Englishlanguage learners, and
-
the grouping of students by race and other characteristics in individual classrooms.
Many analyses overseen by the committee found that linking E&S data to other databases made it possible to investigate research questions that otherwise could not have been addressed (see Appendix A). Because of the short amount of time available, the research conducted under the auspices of the committee necessarily was preliminary and exploratory in nature. The objective was to determine the feasibility of using E&S survey data to investigate various issues, and, if possible, to begin analyses that could lead to papers that could be published independently in peer-reviewed journals. Initial findings from some of these analyses are presented below.
E&S SURVEY AS THE SOLE SOURCE OF NATIONAL INFORMATION
The E&S survey is the only source of national data on school disciplinary practices, gender equity in sports, services for students who become pregnant, and classroom-level data on student assignment.
Classroom-Level Student Placement
The E&S survey is the only national database with information on the placement of all students in classrooms by race and ethnicity and English proficiency.8 The item also asks whether any students are “ability grouped for instruction in mathematics or EnglishReading-Language Arts” in that classroom. Information on classroom assignment is requested for the lowest and highest elementary grades only.
The civil rights concerns emanate from evidence that many students who are “tracked” on a continuing basis into separate classrooms or groups within classrooms because of their belowgrade-level performance continue to lose academic ground in these settings,
that minority students are disproportionately “tracked” into low-ability classes, and that such practices may produce “within-school segregation” (see Oakes, 1990; Mickelson, 2001).
Classroom placement data disaggregated by race and ethnicity have been elicited by the E&S survey since 1969, when they were first used to identify what has been called second-generation segregation or within-school segregation.9
Disciplinary Practices
In 2000 the E&S survey provided information on corporal punishment, out-of-school suspensions, total expulsions, expulsions that constitute total suspension of educational services, and expulsions due to zero-tolerance policies. The survey also provides information on suspensions and expulsions of students with disabilities. E&S data are disaggregated to show the frequency of various practices by race and ethnicity, for English-language learners, and for students with disabilities. Information on disciplinary practices has been on the survey since 1973. There is no other national database on school disciplinary practices.
Substantial racial disparities exist in the administration of disciplinary practices. Data from the 2000 E&S survey show that although only 17 percent of all U.S. students were black, 39 percent of the 342,031 students receiving corporal punishment were black, as were 34 percent of the more than 3 million students who received an out-of-school suspension (Appendix B). Of course, out-of-school influences on students’ behavior may affect the frequency with which various disciplinary practices are applied for different groups of students. However, these data also suggest one or both of the following: schools are applying different disciplinary standards for students of different races, or, as with other E&S survey indicators, educators are failing to effectively educate, motivate, or engage a large number of black students in the purposes and programs of schools. Any serious effort to ensure equal access to a high-quality education requires that the underlying causes be investigated and addressed. Using E&S survey data to examine differences in the application of disciplinary measures among schools and among districts, as well as longitudinal trends, can be part of this effort.
|
9 |
As with other survey items, disparities in the distribution of groups of students in different classrooms may occur for various reasons, and some may be well justified—such as the grouping of English-language learners for language instruction. Although the classroom placement data on the E&S survey are a unique resource, the data could be made much more useful with some minor changes, as is discussed in Chapter 4. |
Gender Equity in Sports
The E&S survey is used to gather data pursuant to the enforcement of Title IX of the Education Amendments of 1972. The E&S survey includes information on the number of interscholastic sports teams on which male and female students are eligible to participate. It also includes information on the number of male and female students who participate in interscholastic athletics in each surveyed school. The E&S survey has been used to collect data on gender equity in sports since 1994 and there is no other national database on gender equity in interscholastic athletics.
The 2000 survey showed that, on average, high schools offer 9.7 interscholastic sports teams for boys and 8.7 teams for girls. Of the nearly 6 million high school students who participated in interscholastic sports in 2000, 58 percent were male (see Appendix B).
The Education of Pregnant Students
The E&S survey collects data on educational services for students who are pregnant or who have become mothers. The survey includes items regarding the number of students who became pregnant in the year prior to the survey, and then asks how many of those students (who had not already graduated) were enrolled the following year. This question first appeared in 1980, was dropped from the survey, and then returned in 2000.
E&S DATA THAT COMPLEMENT OTHER DATA
Although similar data on several topics can be obtained from other sources, they are less likely to be disaggregated, to be traceable to specific schools and districts, or to be as current as E&S data. These data cover teacher certification, the consequences of high-stakes testing, the characteristics of special-purpose schools, the number of graduates and type of diploma awarded, segregation, English proficiency, advanced placement classes, gifted and talented programs, and students with disabilities. Most other national survey data tend to be seriously out of date and to have samples that are much too small to be used to study individual states, let alone districts or individual schools.
Teacher Certification
Research indicates that the qualifications of teachers is the school resource that has the greatest impact on student learning outcomes (Hedges, Laine and Greenwald, 1994; Sanders and Horn, 1995; Ferguson and Ladd, 1996; Greenwald, Hedges, and Laine, 1996;
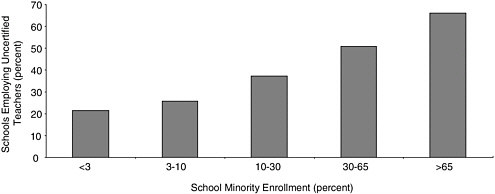
FIGURE 2-1 Minority enrollment and schools employing any uncertified teachers.
SOURCE: Data are from the 2000 E&S survey.
NOTE: Data do not include special education or alternative schools (school n = 82,341). Sixty percent of all public schools employ only state-certified teachers. Minority enrollment includes American Indians, blacks, and Hispanics.
Sanders and Rivers, 1996; DarlingHammond, 1997a; Ferguson, 2000). The E&S survey contains items about the total number of teachers in a school and how many of the teachers are fully certified. Data from the 2000 E&S survey show that schools with predominantly minority students (black, Hispanic, and American Indian) were significantly more likely to employ uncertified teachers; see Figure 2-1.
High-Stakes Testing
The E&S survey includes information about the number of students who passed or failed districtor state-mandated high-stakes tests, as well as the number who were given alternative assessments or were not tested. The data are disaggregated by race, ethnicity, gender, English proficiency, and for students with disabilities. Data disaggregated in this way provide an important opportunity to investigate the immediate consequences of high-stakes testing and how accountability policies affect the educational opportunities of specific student populations. Data are presented for each of the primary grades in which students are required to pass a test as a criterion for promotion to the next grade. At the secondary level, data in the same format are collected regarding tests that are required as a condition for graduation.
Because of rapid changes in educa
tion policies in recent years, the contemporaneousness of the E&S data makes them especially important. Most other recent surveys that contain data about high-stakes testing focus on testing policies and practices being advocated by federal and state legislators and policy makers (see American Federation of Teachers, 2001; Council of Chief State School Officers, 2000; Editorial Projects in Education, 2001, pp. 68–87). However, there is often an important difference between formally stated public policies and the actual implementation of those policies by practitioners in schools and school districts (Cuban, 1998). The E&S survey provides insights into these differences.
That the E&S survey contains data on high-stakes testing, along with information about enrollment changes, special education placements, disciplinary information, and other data, is particularly important in light of the increasing use of high-stakes testing. Education advocates and others are especially concerned that the standards movement and associated high-stakes tests could create incentives for schools to inappropriately place poorly performing students in special education (see National Research Council, 2002b, p.85), transfer poorly performing students to other schools, or take other actions that would eliminate them from the pool of tested students.
Analysis of the 2000 survey conducted for this report revealed that districts that were predominantly black and Hispanic were far more likely to require students to pass a districtor state-sponsored examination as a condition for grade promotion or graduation (Croninger and Douglas, 2002). Also, of those students required to take high-stakes exams, black and Hispanic students are more likely than white and Asian American students to have failed; see Figure 2-2.
Characteristics of Special-Purpose Schools
The E&S survey is an important source of information on the student composition, aspects of the curricula, and certain educational resources and practices of specialized schools. The survey (ED 102) asks whether the reporting school is one of five kinds:
-
a magnet school,
-
a charter school,
-
an alternative school for students with academic difficulties,
-
an alternative school for pregnant students, or
-
an alternative school for students with discipline problems.
Information on the number of charter schools, magnet schools, and alternative schools is also collected in the CCD,
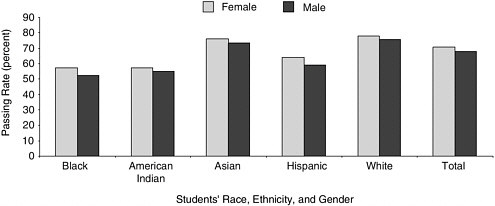
FIGURE 2-2 Passing rates for tests that are the sole criterion for high school graduation.
SOURCE: Data are from the 2000 E&S survey.
NOTE: Schools were instructed to consider a test of the “sole criterion” for graduation if “all students were required to take a districtor state-required test, and must pass the test to graduate from high school.” A total of 2,652 high schools required these tests; 585,709 high school students took such tests; 406,502 passed.
and in 2002 the NCES (Kleiner, Porch, and Farris, 2002) published a statistical analysis on public alternative schools and programs for students at risk of education failure. Little is known about how some of these schools—especially charter schools—are similar to or different from other schools. According to E&S survey data for 2000, minorities account for 40 percent of the enrollment of charter schools, compared with 30 percent of regular public schools. Charter schools are much more likely to employ teachers who are not fully certified.
Number of Graduates and Type of Diploma Awarded
Schools are required to report the number of students awarded regular diplomas and certificates of attendance or certificates of completion. Data from the 2000 E&S survey showed that blacks and American Indians were substantially more likely than whites and Asian Americans to a receive a certificate of attendance or completion instead of a diploma; see Figure 2-3.
Segregation
As discussed above, the original purpose of the E&S survey was to
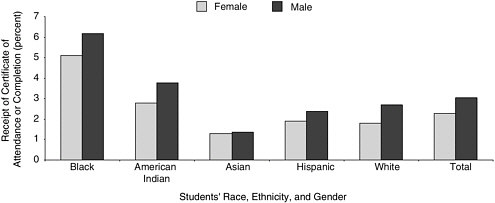
FIGURE 2-3 Certificates of attendance or completion to high school graduates.
SOURCE: Data are from the 2000 E&S survey.
NOTE: OCR projections indicate 2,605,843 public high school graduates in 2000, of whom 69,081 received certificates of attendance or completion. OCR defines a certificate of attendance or completion as “an award of less than a regular diploma, or a modified diploma, or fulfillment of an IEP for students with disabilities.”
document patterns of racial segregation and the compliance of districts with desegregation plans. Since 1987, information on the racial and ethnic composition of schools comparable to that collected on the E&S survey has been collected annually in the CCD. However, the E&S survey is the only source of information for earlier years, and it has proven to be an indispensable resource for documenting long-term trends, including the recent trend toward resegregation (see Orfield, Bachmeier, and Eitle, 1997; Orfield, 2001a). Data from the 2000 survey, when combined with information on school poverty from the CCD, show that highly segregated black and Hispanic schools also tend to have a very high concentration of students in poverty; see Figure 2-4.
Because nearly all E&S survey items are disaggregated by race and ethnicity, the survey is an important source of information on what has been called second-generation segregation or within-school segregation—an issue of particular interest for access to highlevel classes and curriculum tracking.
English-Language Learners
The E&S survey also is an important source of information concerning English-language learners and the
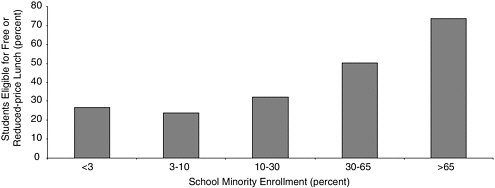
FIGURE 2-4 School minority enrollment and poverty concentration.
SOURCES: Data are from the 2000 E&S survey (minority enrollment) and the 2000–2001 Common Core of Data (free and reduced-price lunch eligibility).
NOTE: The data do not include special education and alternative schools (school n = 69,029). Minority enrollment includes American Indians, blacks, and Hispanics. Data on free and reduced-price lunch eligibility are not available for Arizona, Connecticut, Illinois, Tennessee, or Washington.
schools that serve them. According to 2000 survey data, 3.2 million (8 percent) of elementary and secondary students need English-language learner services: 76 percent of these students are Hispanic, and 13 percent are Asian American. According to the 2000 E&S survey, 36 percent of all Hispanic students need English-language learner services, as do 24 percent of all Asian American students.
Hispanic English-language learners, in particular, tend to be concentrated in highly segregated, high-poverty schools (Horn, 2002). On average, 60 percent of students in schools attended by Hispanic English-language learners are from families in poverty, and only 22 percent are non-Hispanic whites. Nearly half (45 percent) of all Hispanic English-language learners attend schools in which at least 90 percent of the students are minorities (see Appendix B). The isolation of students in segregated, highpoverty schools tends to concentrate disadvantage and can contribute to poor educational outcomes (Lippman et al., 1996; Puma et al., 1997). The E&S survey is an important source of data that can be used to analyze this problem. In addition, the survey is a useful source of information on the
availability of learning resources in the schools attended by English-language learners and on their access to those resources within their schools (Horn, 2002).
An official from the Office of English Language Acquisition informed the committee that the E&S survey is particularly valuable for its purposes because the data are current. The number of English-language learners is growing rapidly, and the E&S survey documents how they have become more widely dispersed across many more states. The survey also identifies the districts and schools where these students are concentrated.
Advanced Placement Classes
The E&S survey provides information on the number of advanced placement (AP) courses taught in high schools. On average, schools with predominantly minority students offer fewer AP courses than schools with predominantly white students (see Appendix B).
The survey also provides information on the number of students taking AP science and mathematics courses, disaggregated by gender, race, and ethnicity. In 2000, black, Hispanic, and American Indian students were about half as likely as white students to be enrolled in AP science and math courses (see Appendix B). The E&S survey also is a source of information on the number of students who have limited English proficiency and learning disabilities who are enrolled in AP classes. Information on access to AP courses has been available from the E&S survey since 1992.
Gifted and Talented Programs
The E&S survey provides information on the characteristics of elementary school students who are enrolled in gifted and talented programs. The 2000 survey showed that black, Hispanic, and American Indian students were 40 percent, 49 percent, and 64 percent, respectively, as likely as white students to participate in gifted and talented programs (see Appendix B).
Students with Disabilities
Since 1976, the E&S survey has included information on the composition of students in various disability categories and the degree to which those students are placed in inclusive educational settings—that is, the extent to which they are either “mainstreamed” or served in separate classrooms or schools.
This information is gathered because of OCR’s responsibility to ensure compliance with Section 504 of the Rehabilitation Act of 1973, which prohibits discrimination based on disability. As with other items, the E&S survey disaggregates information on students
with disabilities by race and ethnicity, and, in some cases, gender. Although surveys administered by the Office of Special Education and Rehabilitative Services (OSERS)—previously called the Office of Special Education Programs (OSEP)—have long collected state-level data on students in special education, the OSEP/OSERS data were not disaggregated by race and ethnicity until 1998 and have never been reported for individual schools and districts.
Prior to 1998, the E&S survey was the only source of routinely collected information on the racial, ethnic, and language background of students enrolled in special education. Recently, OSERS began to collect this information as part of its regular survey conducted for the purpose of monitoring states’ administration of the Individuals With Disabilities Act, as amended in 1997. That year, Congress required OSEP to begin monitoring racial and ethnic disparities in special education placement for the possibility of inappropriate placement (see Hehir, 2002).
Since OSEP began to collect disaggregated data in 1998, the data collected by OSEP/OSERS have become essentially redundant with the items on the E&S survey regarding students with disabilities. In the interest of eliminating redundancy and reducing the paperwork burden on respondents, OCR and OSEP/OSERS pilot-tested a combined data reporting instrument in 2000. The combined survey instrument covering items required by both OCR and OSEP/ OSERS on students with disabilities was administered by OSEP/OSERS.10
Racial disparities in certain categories of special education have long been a matter of concern (see National Research Council, 1982). Part of the concern has centered on the possibility that minority students were being inappropriately evaluated for placement in special education. In addition, there is concern that the poor quality of regular education services available to many minority students in the early grades may result in the disproportionate placement of students from certain minority groups in special education as they reach third grade (Hehir, 2002; National Research Council, 2002b). Furthermore, E&S survey data show that black and Hispanic students, once they had been identified as needing special education services, are far less likely to be educated in a fully inclusive general education classroom (Garcia Fierros and Conroy, 2002).
|
10 |
The Department of Education is in the process of developing a much more comprehensive approach to the collection of administrative data from schools and school districts, known as the Program-Based Data Management Initiative (PBDMI). The possible implications of PBDMI for the E&S survey are discussed in Chapter 3. |
An analysis of E&S survey data for a National Research Council report (Finn, 1982) found that some minority groups—especially blacks—were disproportionately represented among the “educable mentally retarded” and among students labeled as “emotionally disturbed.” The report also found that males were significantly overrepresented in these and other categories of special education. Using 1998 E&S survey data, a later National Research Council report (2002b) documented essentially similar disparities.11
Another recent report on the topic, Racial Inequity in Special Education (Losen and Orfield, 2002b), includes a number of papers that also used E&S survey data to document racial disproportionality in special education. Although recognizing the limitations of E&S data when not supplemented with information from other sources, the coeditors of this volume nonetheless argue that data on racial disproportionality in special education and other facets of education are important and provide information that is essential both to efforts to improve the quality of education and to equitable access to it. Losen and Orfield (2002a, p. xxii) note: “In a society where race is so strongly related to individual, family and community conditions, it is extremely difficult to know what part of the inequalities are caused by discrimination within the school.” Commenting further on studies in their volume that are based on E&S survey data and supplemented with information from other sources, the coeditors added: “These studies, however, do uncover correlations with race that cannot be explained by factors such as poverty or exposure to environmental hazards, alone” (Losen and Orfield, 2002a, p. xxii).
Like the 2002 National Research Council report, the coeditors of Racial Inequity in Special Education state that the papers in their volume also “suggest that special education issues faced by minority children often begin with shortcomings in the realm of general education well before teachers or parents seek an evaluation for special education eligibility. Therefore, policy solutions that fail to consider the connection with general education classrooms will unlikely bring about significant change” (Losen and Orfield, 2002a, p. xxiii).
In the absence of additional information from other surveys or from field research, the E&S survey data cannot by themselves prove whether racial differences in assignment to special education or other aspects of schooling that are addressed by the survey are the result of discrimination or constitute violations of students’ civil rights. Indeed, the survey was never intended to be used as the sole source of information about discrimination.


