
general container and is not specified. But if you take that for granted, it gives you an exact copy of what’s going on in the Blaise instrument.
GROVES: Just to tag onto that, how many uses of this have been made on real surveys? How many users do you have worldwide?
BETHLEHEM: [laughter] This is a prototype … [laughter]
GROVES: That’s exactly what I thought you were going to say.
BETHLEHEM: So there have been some uses, and some people have tested it in the project. But it’s not in real use at the moment. It’s in real use at Statistics Netherlands; they use it.
PARTICIPANT: In the data description, is there the capability for long labels to be associated with the questionnaire objects?
BETHLEHEM: Yes. I was talking about descriptions, and what you have … you can define many languages for an item, and you can say that one language is a long label. And it can do special things for you. So we have this capability for languages, and you can do that to record the long descriptions for export to SAS or SPSS, because they’re usually in a different format.
PARTICIPANT: So you could even articulate a custom series of conditions based upon the labels? So you could [almost build] from that, potentially, a natural language description of the universe as defined by the series of conditions?
BETHLEHEM: More or less, yes.
PARTICIPANT: You could generate that, based upon the …
BETHLEHEM: Yes, if you specify it; you have to do it, of course.
CORK: Any last questions? Otherwise, let’s thank Jelke.
COMPUTER SCIENCE APPROACHES: VISUALIZATION TOOLS AND SOFTWARE METRICS
Thomas McCabe
CORK: OK … and now for something a little bit different. To give a different take on documentation—a different sense of generally representing an electronic document—we asked Tom McCabe to describe general visualization tools and software metrics. Tom founded McCabe and Associates, which creates tools for software development, maintenance, and testing. He sold McCabe and Associates in 1998 and is now the CEO of McCabe Technologies. Tom?
MCCABE: I didn’t know where to begin, which in software is not unusual. [laughter] Because I have—how many people here have experience developing software? OK, most everybody. And how many people have no experience with surveys? [laughter]
The previous Bush administration used surveys to form a Cabinet. President, elder, Bush was in Moscow, and he met with Gorbachev. And he was having trouble with the vice president at the time, Dan Quayle. So he was impressed with Schevardnadze, and he asked Gorbachev, “How did you get this guy?” And he said, “I gave him a survey. I asked him who his father’s son was, who wasn’t his brother. And Schevardnadze said, ‘Me.’ ” So Gorbachev hired him. So, elder Bush said, “Look, I can’t wait to get back to D.C. so I can use this survey!” [laughter] So he called in Dan Quayle and said, “I have a question for you, which is kind of important to your career. Who is your father’s son, who is not your brother?” And Dan Quayle said, “I think I need two days on this.” So Quayle went to see Dick Cheney; Dick Cheney was Secretary of Defense back then. And he said, “Who’s your father’s son, who’s not your brother?” And Dick Cheney says, “Well, it’s me!” So Quayle went running back to Bush and he says, “I’ve got the answer!” And Bush says, “Well, what’s the answer?” And Quayle said, “It’s Dick Cheney!” And Bush said, “Well, that’s wrong—it’s Schevardnadze!” [laughter] So surveys are used a lot in D.C., here … and in the spirit of that, I’m going to talk about software.
I want to talk about visualization tools and metrics. And I’ll first talk a little bit about the business—what it’s like to be in the business of analyzing a lot of software, in different languages, on many computers, with metrics. Then I’ll talk about algorithms, and I’ll give an example of how to quantify complexity. What’s struck me is that there’s been a lot of discussion about complexity—I think maybe intuitive complexity—but yet [finding] the point at which things get uncomprehensible, untestable, unmaintainable … [answering] that question, certainly, is pertinent to software. And that happens to be the particular work that I’ve done.
I’ll give first a definition of it and show how it works, and then I’ll show a lot of examples of algorithms, in increasing complexity. There’s a point at which most of us [lose] sense of what these algorithms are doing, and I realize that this is a long stretch here—so we’ll give a quiz, and see where people lose the comprehension.
And then we’ll talk about using similar metrics for testing and maintaining as well. It turns out that, in software, maybe 20 percent to 30 percent of the effort is in development and 70 percent is in maintaining. And I’d bet that’s probably the case with surveys. But yet all the attention is on development when a lot of the effort is in maintaining. So we’ll talk about how to use metrics in a maintenance activity. And then we’ll talk about architecture—how to take a very large system and see a lot of software on a screen, and interact with that, and how you get a sense—beyond documentation—of the shape, the quality, the texture, the layout, the landscape of a very large application.
This comes from a lot of experience, a lot of it painful, a lot of it pretty exciting. My particular background is that of a mathematician, and I spent several years developing graph-theoretical techniques to apply to software. And then we built a company. And it was based on a mathematical idea of complexity. And it grew to be about 170 people, with offices in Columbia, Maryland; England; Germany; Paris; and Korea. We analyzed about 17 different languages, so we had parsers for Ada and C++, JOVIAL, and so on. And we worked on all the major platforms except for mainframe. So we worked on all the Unix platforms, PC operating systems, and hybrid platforms. And we probably did more than 25 billion lines of software.
What we did was, first, develop and teach the theory—actually, for about ten years. We got a lot of people to use it. And then ship products that did this. So—unlike a prototype—this stuff had to work.It was typically used in very, very large systems; [it has] a much better chance of working with the larger systems, it’s much more pertinent. So, typically, the kind of systems we were analyzing had upward of 4 or 5— or 20—million lines of code. Very, very large operational systems, [in] commercial environments, DoD, international, aerospace. It was pretty much across-the-board, as you’d find all different languages: COBOL, Ada, JOVIAL. We even had some assembly languages for real-time systems. So, it was a real operational applied kind of business.
The kinds of things that go wrong with software are manifold. One of which is that it’s too complex. And what you’ll often see are algorithms that people really can’t understand, and when they can’t understand ’em—even though they really think they’ve tested ’em—they typically haven’t, and you typically have errors because you can’t comprehend them. It would be interesting to look at that vis-a-vis surveys.
Another thing that goes wrong [with software] is that they’re not tested, and typically not tested when they’re complex. So, if we take something we’ll look at later with complexity 1, 2, or 3, typically, when they test it it would get tested thoroughly enough because it’s so simple. As the complexity increases, the accuracy of the testing decreases. And you find a point at which it’s not even close to doing a reasonable job of testing.
Software often doesn’t work, and the problem with it is that it’s fielded when it doesn’t work. And the cost of errors, by the way—there was a comment this morning about the cost of errors being 32 times once product is already fielded. In our experience it’s about 300 times. You take a software product, put it out there, and when it doesn’t work— comes back in—the problem is that you don’t know where the error is. So you have to localize it within the module. Then you have to change
the module, re-test the integration, and then do some more regression testing. And all of that would cost, typically, 300 times more dollars and time than if you had caught the error in development.
Another problem with software is that there isn’t much re-use. There [have] been all sorts of initiatives, in DoD and the government and academia, to write re-usable code. And the joke in software is that everybody likes to write re-usable code but no one likes to re-use it. [laughter] And one of the reasons is that nobody works at it. In the universities—[for instance,] Michigan having one of the first computer science departments—most of the curriculum is about development, design teams, metrics, coding. Very little about testing, very little about maintenance. And what happens is that everybody’s developing new code when—in fact—there’s often code that exists that has the functionality you need. The problem is that documentation and traceability aren’t there to let you get to it. We looked at it another way—and we’ll talk about reengineering here as well—and we reengineered systems and found 30 percent of the systems were redundant, in the sense that they were doing the same thing. And the problem was: people putting new things in couldn’t locate where the functionality already existed. It will be interesting to see if that’s pertinent to surveys.
And, of course, there’s the problem of standards. There are all kinds of standards in software—one of them is about complexity, now; it wasn’t some years ago. [It] goes toward programming style; individual corporations have their programming standards. There has not been a whole lot of success in using them. And, in fact, there’s a lot worse … it used to be, when projects were bigger and well-defined, that standards would have a chance. Now, you’ve got kids writing XML and products being shipped based on just a very loose, collaborative environment. And standards and testing are in probably worse shape.
OK, I want to talk just a little bit about the architecture of some products. Not to talk about the products, but I want to give you a sense of the activity we engaged in, because I think a lot of it is pertinent to surveys. And one part of it is parsing a lot of languages. Now, there’s a bunch of them listed here, and some have been added since.31 One of the key things of approaching this is that there has to be a grammar underlying the language, obviously, in the computer langauge. But there also has to be a fairly consistent parsing technology, so you can extend it. And the problem is that there’s no way to maintain seventeen different languages. And I think that’s pertinent to surveys as well; if you try to approach the problem of measuring surveys and testing them, and
getting their complexity, the first thing to deal with is how to parse the language in which they’re expressed.
Another [part of the architecture we developed] is the database to hold metrics, reports, and graphics for display.
Of the three major activities that we were involved in, the first was quality assurance: how do you find something early that’s out of control? How do you find something early that can’t be tested? How do you find something early that’s not going to be able to be maintained?
The second one is testing: once we have a product, how do we test it? Now, we’re going to take head-on the issue of paths—in fact, I’ve heard a lot of discussion about questionnaires and paths and modules and how you count a path and the number of paths and all that—and that’s exactly the topic we were into. One of the problems in the testing of software is that if you had a group of a dozen people, and you look at the criteria for shipping, it was purely ad hoc—it was simply that one guy sent it through testing and a manager would say, “Fine.” Well, one person might be good at it and the next guy lousy at it, but that was the criterion. So we’re going to talk more about a defined mathematical criterion for completing testing.
And then a third area is reengineering. In software, what that’s typically about is how you take a lot of source code—say, a million lines of source code—and how do you reengineer out of that the architecture? How do you tell whether the top modules were the ones who called each other, what functionality is within what modules, and how do you see the algorithms? [Our tools helped with these efforts in general programming environments,] so it would be interesting to see if surveys have the same kinds of characteristics.
So reengineering means: how do you get back what that architecture was? I was kind of fascinated listening to the discussion about documentation, and the pains of doing it, and the experience of it always being incomplete—because in software that’s exactly the case. In fact, I would maintain that software is worse. What typically happens, with almost all of our clients, is that documentation consisted of what we could reengineer from the source code. There was no documentation. And, in fact, when they had it, it was misleading. Because the problem was that the documentation didn’t match the system; it was done at one point in time, and then when the code was built and shipped too early, the whole organization was in such a panic to try to fix it that they had no time to update the documentation. In fact, they couldn’t complete the testing before they shipped out second releases of it. So what would happen is that the documentation would be four, five, six iterations out of date … and dangerous. So the only documentation was what you could reengineer.
Now let me make another point in terms of the time basis. The stuff in here—the testing—had to be done in real-time. So the way it would work is, when someone was testing an algorithm there would be immediate feedback about the paths he’d gone down, the paths he hadn’t gone down, the conditions that drive it, and the percentage complete. So it had to be as fast as a compiler, and that easy to use. And I’ll show later what that looks like. With reengineering, that was more on a daily basis. So it would take—for example, with maybe half a million lines of code— about a half hour to parse and represent. So, for a very big system, it might take half a day to parse all the source code, show all the architecture so you could see it. Now the other thing—so that would be just the parsing to get it.
The other thing, however, about having a big system is that there is no static view that would do. You have to have, like, a CAD/CAM picture of it. And so, for example, you would say, “give me a certain record; where does that record appear in the architecture?” So it would highlight those modules. “Where within those modules has it been tested?”— highlight those. “What modules never use it?” If I take a dataset with four, five, six, or a dozen records, show me the architecture that uses that. Show me the pieces that this user is using. So there are all kinds of questions and representations that you show very interactively, and when people go to use this—or start using it—there’s no way they try to change it without that, because you can’t see something that big. And I think that relates to surveys—a little bit different.
I was going to say that software has to work, because you modify it, you recompile it, you put it out there, and you run it … but it doesn’t. [laughter] The error rates in software are incredible. But you do compile it—and in fact do run it—and the idea is to see it that way. With the quality assurance, that would occur at the beginning and work all the way through.
OK, I’m going to show a few examples, and I chose C as a language. And that’s a very small—I would call it an algorithm or a module. [See Figure II-15.] And it says that you begin here, and statement 0 is x replaced by 3. And then here in blue is the first condition, which says that if y is less than 4, then x is replaced by sin(y); otherwise, x is replaced by [cos(y)]; and so forth. And then the flow graph—just the notation I’m going to use—looks like this. So it says—the node 0 is here, and it comes into this node that splits. It has one entry and two exits, and that’s what a decision looks like. And it goes to either 2 or 3, and then to 4.
One of the things that I hope that what I’m showing you will suggest is a sense of this being a minimal representation. The problem is that you want to show data associated with this, and a lot of things associated
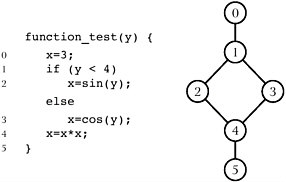
Figure II-15 Simple C algorithm with flow graph.
with this, so when you choose the way you think of this graphically you have to get a minimalist view.
Now here’s another algorithm—a little more complex, and you can see the graph next to it. [SeeFigure II-16.] We’re going to use some terminology here. This thing is called a “node”, a node being a circle with a number in it, typically representing one statement or collection element. And then an edge is the thing that points from one node to a second. So we’re going to talk about nodes and edges.
You probably can’t read that, but one of the questions you could ask is—when you think about a survey, does this pertain or not? And maybe it doesn’t. But it seems to me that one way in which it might is that a survey has a control flow, just like an algorithm. So, in a survey, the user would be asked the series of questions one through two and then— depending on the output—a quick exit would be out this way. And then a different outcome of the data would take you into here. And then a quick exit out of that would be around this way, and so forth. So you could think of this as being the control flow of a questionnaire.
Now another interpretation—I think, within a questionnaire—could be data flow. In other words, what this could mean is that the data at question four depends on the data at three, and one and two. Or the data I’m asking about at question six depended upon the outcomes of the data at five, three, one, and two. So it could also be thought of as a data dependency graph of the questions within the questionnaire, and it’s been used that way in software as well.
OK, now here’s another view. I don’t know if you guys can see that. [Here’s] the algorithm, and this is in C, and then you see some information here about it—the name of the module, and this indicates the correspondence between, for example, node number 8 over here, it’s this clause support(). And this shows something about the complexity,
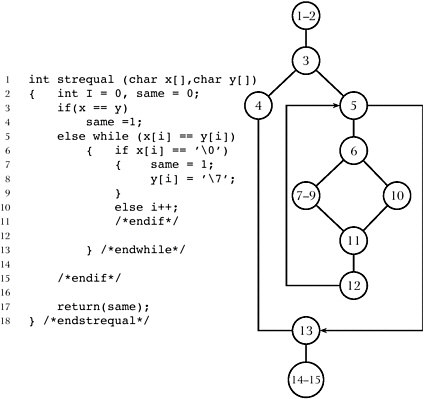
Figure II-16 More complicated C algorithm with flow graph.
and here the complexity is 2—meaning when you go to test that there are basically two paths.32 The point I’m making here is that the way we’re working this is to give the complexity and the graph to the user developing it, right with the source code. So there’s no separation.
It’s interesting with quality and testing of software … you have to make it very, very easy. If it becomes separated or takes some time to do it, or it becomes bureaucratic, it won’t be done. The point at which this particular stuff is applied is in unit integration testing, and if you don’t get the testing done well there, the software starts to blow up as you integrate things and go into field testing and the cost is incredibly high. We’ve mentioned that it’s about 300 times more expensive in the field; it’s about 90 times more expensive in a regression or acceptance test than in a unit test. So if you’re not catching the errors here, they get much more expensive later. And the idea is to make it very easy, OK?
Now let me also mention that a lot of our users would be using four, five, or six different languages—maybe Ada and C++ and JOVIAL. And all the testing, the quality, the reengineering would look exactly the same. In fact, the medium became the complexity, the graph, the numbers, rather than the syntax.
OK, I’m going to talk a little bit about three different metrics, and one is called “cyclomatic complexity” (v). It’s the measure of the inherent complexity within an algorithm, and the way it works is that it quantifies the number of basis paths. Now, many algorithms will have an infinite number of paths—just like many questionnaires do. And the reason is you can loop. However—as a practical concern—you can’t test an infinite number of things. You have to make some kind of engineering choice about what you test. And the cyclomatic number is the number of basis paths within an algorithm which, when taken in combination, would generate all the paths. There’s a theorem in graph theory that says that you can think of the paths in an algorithm as a vector space— that’s typically infinite. However, there’s a basis set of paths that when taken in combination would generate all paths. And the cardinality—the number—of basis paths is the cyclomatic number. And we’ll illustrate that with some examples. That’s something I published years ago, and grew the company with.
And then what we’re going to talk about as well is “essential complexity” (ev). And essential complexity is about—not so much the testing effort but the quality. There [are] some things in software that are inherently unstructured, and it’s very similar to what you guys were talking about with surveys; I’ll show some pictures of it. There [are] ways you can screw up … in fact, I suggest that the software world was screwing this up well before you guys even got into it. [laughter] And there’s a way you can quantify the essential complexity, which is the unstructuredness which leads to a maintenance trap—you can’t test it nor maintain it.
And then, later, we’ll talk a little bit about something called “[module] design complexity” (iv), and that has to do with how many modules this thing invokes below it.
All right, now the way cyclomatic complexity is going to look is that we’re looking at the decision structure within a module. In a survey, I think that the analogue might be that this is a page, a group, or a collection, that’s thought of as a separate group. So we’re talking about the complexity within that; we’re not talking about the complexity across, we’ll discuss that later.
Now I’m going to show an example here. Here’s an algorithm that typically would be error-prone, if this were Ada or JOVIAL or C++; it would be error prone because it’s a little bit too complex. [The schematic diagram referred to in this and the next few paragraphs is shown inFigure II-17.]
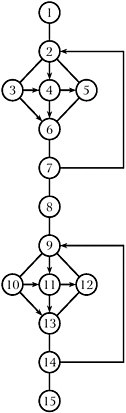
Figure II-17 Schematic diagram of error-prone algorithm.
It turns out it has 11 paths, and let me give you a sense of what they are. There’s one that goes like this, there’s a second that goes like this, there’s a third that goes like this, there’s a fourth that goes like this, a fifth that goes across here, a sixth here (around down), a seventh here, 8, 9, 10, and then 11. Anybody miss that? [laughter] So if you were testing that as an algorithm, you somehow want to come up with 11 paths. Now, typically, if you gave this to a software testing person you get answers all over the place. One person will tell you there are 3 tests, another will tell you there are 300. And probably every number in between.
Now let me quickly show you how this is computed, this cyclomatic complexity. This is the reason why we had the product; you don’t want to be doing this stuff by hand. And one way is you count up the edges, and it turns out there [are] 24 edges. Now the edges, recall, are the transitions between the nodes. So there’s one edge there, two, there’s another edge there, etc. So these things in blue are the edges. And now you count the nodes—and there [are] one, two, three, four—and it turns
out to be 15 nodes. And the cyclomatic number of a connected graph is the number of edges minus the number of nodes plus two. [Using] graph theory you can prove that this is the number of independent paths. And it turns out there [are] a lot of paths. Again, you get software to do this; you don’t try to do this by hand. Now it would be interesting in a survey to ask the people testing how many tests they do, and that might suggest you get the same thing as in software—anything from 3 to 300.
Now another way to compute the same thing, which is a little bit easier, is to—whoops, I went a bit too fast here—is to count the regions. If you just count the regions, that gives you the complexity. So, there’s a region in here—can you see that?33 So there’s one, two, three, four, five, six, seven, eight, nine, ten, eleven. There are eleven regions in the graph, and that will be equal to the number of independent paths. That’s not the total number of paths; this thing has a hundred million paths in it, because you could iterate any number of times. But it has eleven basis paths.
You can mathematically prove that, if somebody doesn’t test eleven basis paths, then that algorithm is overly complex. Have you ever seen a survey that’s too complex? [laughter] Now what it means—and there are all sorts of software that are too complex. And what it means is that the control structure is too rich for substantiation. In other words, there aren’t that many questions within it. So it turns out that if you can’t test eleven basis paths—say, you can only test seven—there’s an equivalent algorithm with complexity seven that does the same thing.
All right, so that’s how you compute it.
Now, what happens with all this? Well, first, when complexity is high you have a high number of failures, because it isn’t tested. People try to test it—they work hard—but they just don’t see all the combinations. It’s difficult to understand; you get unexpected results. What happens with time is entropy always increases. It always increases in software; my guess is that it probably increases in surveys. It doesn’t go down; you have to work at controlling it and keeping it down. As a result, it gets unreliable.34
|
33 |
This method assumes that the flow graph is planar—that is, that it can be drawn on a plane so that no edges cross over each other or intersect each other at any place besides a common vertex. In that case, the plane can be divided up into regions—connected areas bounded by edges that, pieced together, form the plane. In Figure II-17, each of the two diamond-shaped portions of the graph contains four regions (e.g., the triangle bounded by edges 4–5, 4–6, and 5–6 is a region). The area enclosed by the edges 6–7, 7–2, 2–5, and 5–6 (and the counterpart on the lower diamond-shaped portion) counts as a region. The area of the plane outside the already-mentioned enclosed regions counts as the final region, bringing the total to 11. |
|
34 |
McCabe’s slides add the comment that software with complexity values v > 10 are “less reliable and require high levels of testing.” |
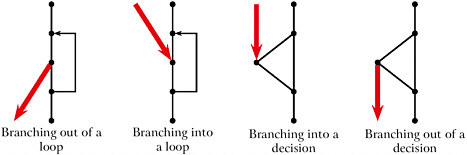
Figure II-18 Four sources of unstructured logic in software programs.
Now, I’m going to talk about essential complexity and then give a whole bunch of real examples. Now this is a little bit different; this isn’t about testing, it’s about quality. And it’s about unstructured logic. Harlan Mills came out some time ago—with Terry Baker—with papers about structured programming, and it meant a style of logic that looked like it was pretty testable and reliable.35 Now I published a paper some time after that about unstructured programming—what it meant, if you didn’t use structured logic, how could you characterize the thought process behind the spaghetti code?36 What does it look like when things are not structured? Essential complexity measures that; it measures the degree to which it’s unstructured.
Now let me show a couple of examples. These are four things you can do if you want to mess up your logic. [SeeFigure II-18.] Now, you can mess up JOVIAL, or Ada, or C++—you probably can mess up a survey, OK? Now one of them is to have a loop where the normal exit is down here but in the middle of the loop you jump up. Another one is to have a loop where the normal entry is here but you jump in the middle of it. See, the reason that this software doesn’t work well is that the compiler will typically initialize induction variables at the beginning and you’re jumping into the body, often with a random result. Another case is where you have a decision—you have a condition, and then some result. But you jump right to the result without going through the test. Andthefourthoneiswhereyoujumpoutoftheeventclause.
Now those look simple, but I proved a theorem which says that logic can’t be a little bit unstructured—it’s like being a little bit pregnant. If it’s unstructured at one point, it’ll be unstructured somewhere else.
Now let me give some examples. Actually, we’re going to have a quiz, so you guys are going to have to answer these questions. I’m going to show two examples of algorithms, and here’s one where the complexity is 20—it’s pretty complex. There [are] 20 paths. And let’s say you had to modify that node. So you have two choices—this is Choice A [Figure II-19], you could choose that, or this is Choice B [Figure II-20]. And Choice B is this algorithm with cyclomatic complexity 18, where you’re modifying that node. All right, so, look at it one more time. How many people would choose A, that one? Now you’ve got to choose one here; you can’t get out of here without choosing A or B. [laughter] So that’s A, and that’s B. So how many people would choose A? And how many would choose B? All right … chaos rules.
It turns out, with A, let’s look at what you do. In A, if you modify it there, it would be pretty clear how you would test that, right? Because the test-retesting you would do would be down here. And you pretty much could confine yourself to thinking—if not just that statement and that path—then at least to this domain within here, or in there. So you can kind of chunk the algorithm; you can look at it in pieces and separate concerns.
Now, in the second case—say you modify it there. Where do you test it? What are the chunks? You see, it’s gestalt—you either get it or you don’t, and you’ve got to get the whole thing. And that’s what goes wrong. And it turns out that this algorithm has essential complexity 17.
Now, essential complexity is bounded by 1 and the cyclomatic complexity.37 This thing [Figure II-20] is 17/18ths fouled up. You see, it’s almost perfect. [laughter] And you’re going to see things much worse than this. The incredible thing is when we look to software for real, it is beyond your imagination—this is just a warm-up, as to what the stuff will look like when we get to things we’re working on. Now, the one before [seeFigure II-19] has essential complexity 1. What that means is that, psychologically or physically, I can chunk that as much as I want. I can take all this stuff and treat it separately from that stuff. I can think about that separately from this, and I can separate this out. There’s a mathematical definition here, but if I keep going I can essentially reduce this whole algorithm to a linear sequence. So it means I can separate my
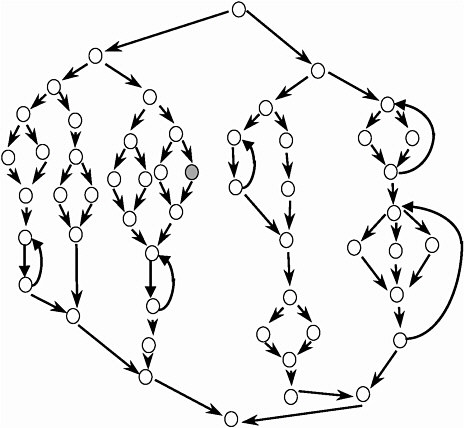
Figure II-19 Choice A in software metrics quiz.
NOTES: In the context of the quiz, the question is on the level of effort that would be incurred by making a change at the node (near the center) that is shaded in. The cyclomatic complexity for this graph (v) is 20; essential complexity (ev) is 1, and module design complexity (iv) is 2.
SOURCE: Workshop presentation by Thomas McCabe.
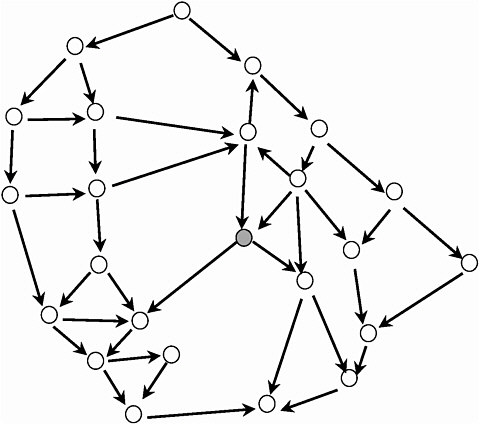
Figure II-20 Choice B in software metrics quiz.
NOTES: In the context of the quiz, the question is on the level of effort that would be incurred by making a change at the node (just right of center) that is shaded in. The cyclomatic complexity for this graph (v) is 18; essential complexity (ev) is 17, and module design complexity (iv) is 6.
SOURCE: Workshop presentation by Thomas McCabe.
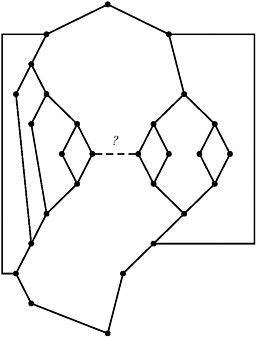
Figure II-21 Example of large change in complexity that can be introduced by a single change in a software module.
NOTES: Without the dashed line indicated by a “?” in the graph, the module has cyclomatic complexity 10 and essential complexity 1. Adding in the dashed line, the resulting flow graph has cyclomatic complexity 11 and essential complexity 10.
SOURCE: Workshop presentation by Thomas McCabe.
testing, separate my domain of change, I can factor out reusable code. I can comprehend it. Whereas in the second case I can’t do any of those things. Actually, the only structured piece is down there.
Now, let me show just one more thing about this. Now, that’s essential complexity. Here’s an algorithm up here where the essential complexity is 1. [SeeFigure II-21.] Can you guys see that OK? And here’s one change—the guy puts one “GOTO” in, from here to here—and the essential complexity went from 1 to 10. So it went from being perfect to being 10/11ths fouled up with one change. And you’ll see algorithms where it’s much more dramatic, cases where the cyclomatic complexity is 50 and the essential complexity is 1. One change, and the essential complexity went from 1 to 49. And that’s why maintaining and changing things is so dangerous; if this were a survey, you would go from a
survey where you could re-use pieces of it—you could separately test it, or modify just pieces of it—to where you couldn’t do any of those things. So, small change can have big impact on quality.
So that gives you a sense of the metrics. I thought it might be fun to look at some real stuff here. I’m just going to start showing some examples of algorithms and giving a comment. And this is all real, live stuff, like we see every day.38 And the first one, here, its complexity is 14. And it’s pretty well structured—its essential complexity is 5, and the only unstructured thing is down on the bottom. But that’s something that you can work with. And, by the way—we’ll talk about this later— these things have function calls. So it also gives you an idea of design complexity, how much it invokes from the stuff below it. But that’s something you could work with.
Now here’s another example—things are getting worse here. Actually, this one has complexity 7, so it’s not so bad. Now this shows the dynamic trace, which is often used in testing as well. For example, in this particular case the guy ran a test, and the test went down this particular path that’s highlighted. I don’t know if you can see this, but this shows that the path is highlighted down here. So it also works incrementally, as you’re testing, you can graphically see what you’re doing.
So this one has complexity 15, and we’re getting a little bit worse. This is complexity 17. And I hope you’re getting a sense that as those numbers go up that things are looking … worse. And we’re not even approaching some of the things you see in operational environments. So this is 37. Now with the tool you can expand this, make it wider and all that. But, you know, when you have incredible complexity that doesn’t help; you can just see the mess.
So this is complexity 59. Now one of the problems is that people sometimes get shocked—“I didn’t write that!” [laughter] “I don’t know what happened; I never wrote that! I know it’s got my name on it, but … I took a week off, came back, and look what happened!” [laughter]
Now here’s an example. I’m going to show two examples. Here’s an example of an algorithm that doesn’t work. It’s got complexity 300. And, by the way, 30 percent of—you see, this thing, this thing, this thing, they’re all the same. And if you blew this up, all of the things inside it are the same. There’s just so much complexity, the guy couldn’t see it. Now that’s an example of an algorithm that doesn’t work because it’s too complex. But you can make it work by modularizing it, because the essential complexity is 1. So you can attack it piece-by-piece.
Now here’s an example of an algorithm that not only won’t work but it will never work. [laughter] It’s got complexity 262 with essential complexity 179. Now the general work in a job, the way things work in software with an algorithm like this is you go to fix it, right? And you make your first set of fixes, and those fixes introduce secondary errors. You fix those secondary errors and you’ve got tertiary errors. And so forth, and so forth. And it’s like a bureaucracy: the more you work at it, the more work you’re generating. So then you figure out: we were best off seven months ago, before we ever changed this thing—the original errors weren’t that bad! [laughter] Did you ever work in something like that? That’s the way software goes. Now, we see stuff like this all the time—like, this, you can almost see it. But we’ve worked with some scary stuff, stuff with mission-critical software that just didn’t work or even come close to working.
There [are] two messages here. You can never see it without seeing it. You see, a lot of times the number of source lines of code is not that big. The relationship between the complexity and the number of lines was not that high a correlation. And, second, you can’t test number of lines; it’s the paths you test. And the other point is the metric to measure it. So that’s what I’m talking about, and I wanted you to see some real things to get a sense of what it’s like.
It would be really interesting to take a look at some surveys. See, I think that some of the analogues are … algorithms have complexity and the paths you traverse. It seems to me that surveys have complexity and they have paths you traverse. They’re the same thing. And you guys were talking about keeping track of all the paths—you don’t. Because a lot of the paths repeat segments of another path. So when you put the paths together you have an algorithm with an implicit complexity.
OK, and by the way, with this thing with cyclomatic complexity 262, the amount of testing might be like, say, 50. In fact, with this thing, we found the guy who did this … you have to be sort of diplomatic when you approach them. And he got kind of upset when he saw the picture and said, “Wow! I tested that at least twelve times.” [laughter] He was certain of it.
PARTICIPANT: Let me just ask … you’re defining complexity not so much as the logic problem they’re addressing but their approach to programming it?
MCCABE: Well, I am, in software. Like, the classical application of this is what you just said. But I think if I extrapolate to surveys I’d characterize it more the way you’re thinking. In other words, I don’t think that it’s as you write the algorithm. The survey, like the programming language, has an existence that’s fully characterized by the survey. And you get all the information from that document. And my belief is that
that document really is an algorithm—it has statements like statements in Ada, it has decisions like decisions in Ada, and it has subroutine calls which say to go around the document, go to a different area. And when you look at it together, it really is an algorithm.
[There has] been some discussion here about the paths going through it. [Someone] said that there might be thirty interviews, each one of which would be a different path. See, I don’t think that would be true. There may be thirty interviews but there might be only twelve paths, because you repeat some of the paths. So I think that if you model the survey as an algorithm and then compute the cyclomatic paths, then the interview is just a tracing of one of those paths.
And, by the way, with the representation—I think that this would work with surveys. The way you would show it is you dynamically [show] both the paths you didn’t test and the paths you did test. Now, when you show the paths you didn’t test, you do that to do more testing—to make sure you get things right before you ship it. When you show the paths you did test, you do that to comprehend reengineering. Because, in most software systems, you spend 90 percent of the time on 4 percent of the code. Therefore, when you go through an algorithm and highlight the paths that you most go through, that would tell you guys, “This is where 80 percent of the people are going.” So I think there’s an exact analogy.
And then the architecture … well, I’m assuming the survey is maybe two or three pages, whatever. [laughter] Well, I guess it isn’t. It probably looks worse than this. There’s probably a notion of architecture in surveys as well, it’s another area. I guess it’s like when you do the IRS stuff, the taxes, and switch to Form B or whatever you have to do. Form B is another module. And then the architecture is a linkage between the modules.
Now, likewise—I don’t know if I’ll have enough time to do it—but we’ve also published papers about design complexity, which is the interaction of all the modules. So the way you’d think about testing is, you want to know the design complexity and I’m going to force myself to do the design testing before I ship because I don’t want to have the errors coming back in. If I want to do reengineering I want to see the traces across the architecture when it’s being used. I think they’re exactly analogous. Yes?
PARTICIPANT: I like your presentation very much, and I have a kind of orthogonal question. A lot of the new object-oriented languages— Java, C++, and so on—sort of encourage their programming to have a kind of modularity, reusability and all this. And I personally have seen a number of real-life problems faced with languages like C, COBOL, and FORTRAN really hiding the functionality rather than making it usable.
So I wonder if you have any comments about how these differences might work in testing?
MCCABE: Yeah, I do. Did everybody hear the question? This is something we were talking about at lunch. What happens in software is that, about every four or five years, there’s a new mantra. It was [object-oriented (OO) programming], and before OO it was encapsulation. Before that it was structured programming, and after OO it was XML. And what happens is that—when things get totally screwed up and you can’t maintain them—you invent a new paradigm and declare all the other stuff unusable [laughter] until the current paradigm becomes unmaintainable. And then you declare another one. And what happened with a lot of our competitors—in fact, I think there’s a guy in the room here— we wrote all our stuff in C, all these things, because it’s very portable and we had a solid base. And some of our competitors switched to C++ about that time. And they landed up with an architecture so complex that—guess what?—they couldn’t maintain it. So what happens is, it isn’t so much the technology that gets us in trouble, it’s the fact that— for example, in a computer software shop—you never see a line item for studying the system. Analyzing the system. There are line items for development, for testing, for coding—but not for analysis. And, so what happened with a lot of our world is that the architecture gets so complex and reusability gets so complex that there are a lot of pathologies—well, we published a lot of papers about that. For example—along the lines of the comments on Bush and Cheney—when you have the father inheriting from the son you get the wrong kind of cycle in OO.
So the new ways of thinking about the programming languages really haven’t helped with that issue, OK? And, also, there’s going to be a guy from Microsoft talking—a lot of some of the best quality software is done with very thorough regression testing. And a lot of the big companies in the software business do that very, very well. One thing they do well is—that when they make a change—they can pinpoint the subset of regression tests pertinent to that change. Now there’s a thing which I may or may not get to about data complexity. And data complexity says, “if I change these variables, what’s the locality of them in my architecture? And what’s the data complexity of the change? And give me the regression tests that pertain to that data … not the other ones.”39
So therefore, what happens—you take a regression test that maybe has 14 million tests and you can pinpoint the—maybe—dozen that hit the things you’re changing. Now we used that in the year 2000, because the year 2000—the year, the data field—was driving the whole thing. But you find often that the organizations producing quality software are getting it not so much as the result of a new paradigm. It’s by engineering principles, stuff like regression testing and the stuff we’re talking about.
Let me just do a little bit more here—how am I doing with time?
CORK: The good news is that we’re going to try to copy Tom’s slides—and everyone else’s—and have them to distribute tomorrow. The bad news is that I need to ask you to wrap up in about five minutes.
MCCABE: Let me first take questions. Yes?
MARKOSIAN: This question isn’t directly relevant to the application, but more of a historical question. [inaudible] And then things got better over time, and now there’s been remarkable development that seems to be sending things back to the beginning, which was to proliferate current systems. What you’re doing there is introducing two things: the enormous complexity, the syntactical kind of complexity that’s represented in your chart. And also that complexity is hidden because it’s not available for the programmer to look at, things like leaving to the operating system. So, do you have any approaches to that?
MCCABE: Yeah, there are a lot of them, and some are not pertinent to the subject here. There are a lot of just engineering principles, about testing and project management, that pertain to that. And there are collaboration tools that help with that. So there’s no silver bullet. But within that I would suggest that, within the newer systems, these issues are even more important because one of the facts of life these days is that you get different contractors and people separated geographically in different countries all working on the same thing. And, [for instance], what Microsoft does, when you recompile every day, the idea is to visualize the thing you have. Easily and frequently, and share that. And it’s probably more important now because of what you say than it was back then. And things are growing in complexity, not the other way around. And the environments are more complex, in fact, and hearing the standards is even more important.
So I think—let me just summarize by saying that you’re saying that we want to know things about data complexity, and that’s a way to view a subset of data, and then what complexity it induces, and how to test that and how to change that. And a lot of this is about visualization. It was striking to me as we discussed it this morning that the issue, it seems to me about surveys, vis-a-vis documentation and testing, requirements being together up front—are entirely analogous to what has been happening in software. And in software the joke is that you never get to


