
complex? Somewhat complex?
PIERZCHALA: I didn’t see either CASES or Blaise as one of the 17 supported languages …
MCCABE: We didn’t commercialize that. Now the interesting thing is, you know why we didn’t? Because people don’t do it … They’ve got all the stuff, for the programming languages; that you could do, because the programmers will test. But we couldn’t enough [other] people to test early. I mean, it sounds insane, but that’s the reality. So I just wanted to kind of get you guys off the defensive, in surveys, because software has all these problems, too. We’re kind of birds of a feather. The problem is with these communities is that you talk to people, and they don’t want to fund testing. Microsoft does very, very well—they’re probably atypical—but in a lot of organizations testing is a poor cousin. You don’t get the money, the funds, and so forth. So we have the same problems you do. We haven’t commercialized that work because there wasn’t a big market, enough market … Now we did use it in some security, very high-risk environments … And just like software it’s never right the first time; the requirements are never right until four or five iterations, like testing.
CORK: Thanks to everyone for coming. I think that was a great first day.
GROVES: When does the evening session start? [laughter]
CORK: We look forward to seeing most, if not all, of you again tomorrow morning.
WEB-BASED DATA COLLECTION
Roger Tourangeau
CORK: Welcome back for Day 2 of our workshop. In Day 1, we concentrated on documentation and testing, after getting an overview of the general problems. For Day 2, we wanted to do something a little bit different; in this first block of talks, we look at some other emerging technologies coming around the corner, areas in this nexus between survey research and computer science where further interaction could be useful.
To start off, to talk about Web-based surveys in general, we have Roger Tourangeau, who is director of the Joint Program in Survey Methodology.
TOURANGEAU: Good morning … I’m going to give a kind of fast review, in 25 minutes or so, of issues in Web-based data collection. I’ll look mainly at measurement issues, and a lot of what I’m going to tell you is information I stole from Mick Couper. So, if you disagree
with most of it, hey, talk to Mick after the talk … The Web has really caught on, and it looks like an incredibly low cost means of survey data collection. So, the average face-to-face interview now costs, what, maybe $750 or $1,000, on average, to do a face-to-face interview in an area probability sample. It’s literally true—you can get, for $2 or $3 dollars a case, an interview on the Web. So lots of firms, particularly in the market research community, have rushed to adopt this new technology. Yet, I think we all think—those of us who have looked at it carefully— for government applications and high-end academic applications there’s a lot of research that’s going to be needed before federal agencies accept the Web.
And why is that? Well, there are several key issues involving sampling and coverage, non-response, and then there’s this host of measurement issues.
What are some of the sampling issues? For sampling purposes, there are two key obstacles for Web surveys. For most survey populations likely to be of interest to the federal government or academic survey researchers, there’s no good frame. There’s no frame of Internet users. And even if there were a good frame of Internet issues, it’s not clear … there are significant coverage problems; only a fraction of the population—a growing fraction—has Internet access. So for most surveys there would be huge coverage problems.
Because of these problems—the absence of a frame and the presence of these significant coverage problems—there have been four methods of sampling that have been adopted, mostly by the market research community. There are what might be called general invitation samples, volunteer panels, probability samples, and then—as a special case of probability samples—intercept samples, and I’m going to talk briefly about those four.
The general invitation samples are simply Web sites where you can go and fill out a survey, if that’s your cup of tea. I love this; there’s, for example, a Web site [called] MrPoll.com, and you can go there and register your opinion on various issues, at no charge to you. [laughter] These are the moral equivalent of those 900 polls on TV, except that they’re even cheaper to do, right? When you do a 900 poll, you actually pay a few bucks to participate. Here, it’s free. It’s a completely self-selected sample, so it’s a sample of convenience; it has unknown sampling bias and it’s obviously restricted to the Internet population. So, not a really good sample.
There are also volunteer panels. The largest of the volunteer panels— at least the largest of the volunteer panels that I’m aware of—is the Harris Interactive panel. I think they’re up to several hundred thousand members of the panel. And you can get a probability sub-sample of this
large volunteer sample. So you can get a probabilistically cleaned-up version of a really dreadful sample. Again, the coverage is … so it’s not really a probability sample, and it’s coverage is obviously limited to Internet users. [George] Trehanian and his various colleagues at Harris Interactive have attempted to improve the quality of the estimates from the Harris Interactive panel by using propensity weighting, where they’re predicting the likelihood that you’d be in this panel as opposed to their telephone sample. They’ve had parallel telephone samples. And so they calibrate the results from their Web panel to their telephone surveys. And, in the presidential polls, they were dead on; they did pretty well. Again, though, I’m not sure how many of us are ready to trust the miracle of weighting as opposed to probability sampling.
There are some probability samples used for Web surveys. It is possible to get a list sample—for example, all the e-mail addresses of students at a single university. My colleague, Mick Couper, has done several studies like this; he’s surveyed students—where is Mick? All right, oh, there you are, you’re hiding. He’s done several surveys of students at the University of Michigan, for example. A number of studies have offered the Web as one means of responding among other means, so the sample is not restricted to Web users. For example, I worked on a study—the National Survey of Post-Secondary Faculty, in 1998—where respondents were mailed a questionnaire and invited to respond via the Web if they wanted to; they could also respond by phone. So the Web is just one option among others in this probability sample. These samples are typically … Some samples are identified through other means—for example, random digit dialing—and then asked to respond via the Web. In principle, these samples present no new sampling problem: you have some frame, you do probability sampling, you do your usual thing. Then you ask people to respond by the Web. And the problem there is that you can have much higher non-response as a result. For example, in InterSurvey’s panel, people are contacted by RDD; there’s a certain dropout at that stage.47 They are asked if WebTV can be installed in their home; there are dropouts at that stage. After a while, people drop out of a panel; on any particular survey, you always have non-respondents. When you multiply … even if you had an 80 percent response rate at all those stages, you’re down to 33 percent when you multiply .80 times 4. And in fact they don’t have 80 percent at all stages; their response rates are typically in the 20s.
|
47 |
InterSurvey was a Palo Alto, California, company established to conduct surveys using the Internet. It is now Knowledge Networks, Inc., and more information on the firm is available at www.knowledgenetworks.com. |
And then the final approach is that you can kind of intercept people at particular Web sites. So you can get a probability sample of visits to a particular Web site through this means. There are various ways you can do this; in some Web sites a banner ad pops up, and then you can go to another Web site to do a survey. There, obviously, you don’t get a very high response rate by this method. There are pop-up surveys; sometimes, the questions just come up. And then you have to get out of it if you don’t want to do it. And then there is hijacking, where the survey takes over the browser, holds your children hostage, [laughter] and you have to complete the questions before you can move on. Often, it would be difficult to calculate a response rate in these intercept surveys; you’d have to keep tabs on the number of visitors. And the response rate is likely to be low. Another drawback to this approach is that you’re getting a sample of visits, not visitors, right? So the questionnaire comes up every nth time and if it’s the same person—like Mick [Couper] is a habitual Web site abuser and might visit the same site 20 times a day or something—you’d get Mick 20 times if you weren’t careful. Although he has plenty of different opinions, so there would still be good variance properties … [laughter]
If you want to use the Web to survey, to make projections to the general population, there are likely to be difficulties. Not only is the overall coverage less than perfect, there’s differential coverage by lots of different characteristics. For example, in education, if you have a college degree or more, 82 percent of those people—according to the Pew Internet Project—have Internet access. Whereas it falls to 37 percent for people who only have a high school diploma. Likewise, it varies by age; the elderly population, 65+, are less likely to have access. It varies by income. It varies by race, as well. So some groups approach reasonable coverage—high income groups, college graduates. But lots of groups have pretty poor coverage.
You probably can’t read this very well, but I’ll take you through it quickly. So one set of issues is: it’s hard to sample in the absence of a frame, and, if you want a sample of the general population, there’s severe coverage problems. A second set of problems with Web surveys is that the response rates tend to be low, and this slide—which I stole from Mick—shows the response rates in various mode comparison studies. [SeeTable II-2]. And I’ll just take you through a couple of studies. Radler has done a number of experiments on University of Wisconsin students, and he’s compared mail survey with Web, and in both cases you get a much higher response rate with mail. Guterbock finds the same result. There was another survey done at the University of Georgia with similar results; the mail exceeds the Web. It isn’t always the case that the response rates are dreadful. Bates did a study of U.S. Census
Table II-2 Response Rates from Explicit Mode Comparison Studies (List-Based Samples)
|
Source |
Target Population, Topic and Design |
Response Rate by Mode |
|
Kwak and Radler (2000) |
University of Wisconsin students; 1999 survey on campus computing; n = 1,000 per mode |
Web: 27.4% Mail: 41.9% |
|
Radler (2000) |
University of Wisconsin students; 2000 survey on campus computing; n = 1,000 per mode |
Web: 28.0% Mail: 52.6% |
|
Guterbock et al. (2000) |
All computer users at University of Virginia; survey on university computing; n = 549 Web, 362 mail |
Web: 36.8% Mail: 47.6% |
|
Bason (2000) |
University of Georgia students; survey on drug and alcohol use; n = 200 per mode |
Web: 15.5% Mail: 27.7% IVR: 17.4%a Phone: 23.9% |
|
Crawford et al. |
University of Michigan students; survey on alcohol drug use; n = 3,500 per mode and (2002) |
Web: 61.6% Mail: 40.6% |
|
Jones and Pitt (1999) |
Staff at 10 English universities; n = 200 Web (email invitation), 200 email only, 100 mail |
Web: 19% Email: 24% Mail: 72% |
|
Weible and Wallace (1998) |
Management Information Systems (MIS) faculty in U.S., from directory; n = 200 per group |
Web: 2 6% Email: 24% Mail: 35% Fax: 25% |
|
Bates (2001) |
U.S. Census Bureau employees; organizational climate survey; n = 1,644 Web, 1,645 paper; invitations by mail |
Web: 66.6% Mail: 62.8% |
|
Raziano et al. (2001) |
Geriatric physicians; n = 57 per mode; mode reversed for follow-up; initial response rates reported |
Web: 39% Mail: 63% |
|
Klassen and Jacobs (2001) |
Establishment survey from directory of Canadian firms; firms contacted by telephone to get names and contact information; thereafter randomly assigned to mode; n = 110 Web, 163 mail, 161 fax, 160 DBMb |
Web: 14% Mail: 23% Fax: 20% DBM: 21% |
|
Vehovar et al. (2001)c |
Survey on e-commerce among Slovenian companies, in five experimental groups: A: solicited by phone, respond by phone (n = 900); B: solicited by mail, respond by mail (n = 300); C: solicited by mail, respond by fax (n = 100); D: solicited by mail, respond by Web (n = 300); E: solicited by email, respond by Web (n = 200) |
A: 63% B: 54% C: 43% D: 26% E: 7% |
|
a Interactive voice response (IVR) surveys are automated telephone surveys; respondents answer survey questions through verbal response or by pushing keys on the telephone keypad. b Disk-by-mail (DBM) surveys involve sending respondents computerized questionnaires on a diskette, which are completed by the respondent and returned by mail. c The figures reported for this study are completion rates, not response rates. The completion rate is the proportion of respondents with respect to the entire sample while the response rate is with respect to the number of eligible participants. In this case, the completion rate denomination for group D would include those firms for whom web access was not available; likewise, the completion rate denominator rate for group E would include firms with no listed email address. These quantities would be excluded in computing response rate. SOURCE: Workshop presentation by Roger Tourangeau. |
||
Bureau employees and actually got a higher response rate, and not a bad response rate—66.6 percent—in that kind of a setting. But generally what you are seeing is low response rates. And, in part, that may reflect an absence of an empirical basis for knowing how to get a high response rate on the Web. This is a new mode of data collection; we don’t know what the right schedule of follow-ups is, how to give advance notice, and so on; all that technology which is well established for mail surveys and telephone surveys isn’t there yet for the Web. So the techniques for increasing response rates on the Web are still in their infancy, and you can see it in the poor response rates.
There are actually some perverse results that suggest if you add the Web as one option among several in a mixed-mode survey you can wind up with a slightly lower response rate. So people say, “OK, I can do it on the Web,” and they never get around to doing it on the Web or they break off on the Web, or something else happens, and you end up with a worse response rate with the Web as an option than if you hadn’t. That’s a result, by the way, in the ACS—the American Community Survey.
Another problem, non-response related problem, with Web surveys is—aside from ordinary unit non-response, “hey, I don’t want to do it”— it’s awfully easy to break off in a Web survey. So you do a few questions, and you hit despair after a while … and so you stop doing it. And it’s a lot easier to break off in a Web survey because there’s no interviewer there to say, “Oh, wait, don’t break off, don’t be rude to me ….” And a series of studies by [Mick] Couper and colleagues suggest that sometimes progress indicators are helpful; these are the little bars that say that you’re partway through—“go, go, you’re partway through.” But if the news is bad then people become even more discouraged.
Despite the nonresponse problems I think that you’re going to see the Web more and more as an option in mixed-mode surveys. And, for example, the ACS offers a Web response option, the American Community Survey. And people are thinking about this as an option in Census 2010; I don’t know if the Census 2000 allowed a Web option . . .
PARTICIPANT: The American Community Survey doesn’t have a Web option … We did a Web test for the American Community Survey.
TOURANGEAU: I stand corrected.
DOYLE: Census 2000 did have a Web option, but it wasn’t advertised …
TOURANGEAU: A carefully guarded secret; I like that.
DOYLE: If you looked at the letter, you could see that there was an option …
TOURANGEAU: And, of course, no one in America—this being America—actually got to the end of the letter [laughter] where this spec was revealed.
OK, I want to spend the remaining 15 minutes or so of my time talking about measurement issues. And, relative to familiar methods of data collection, the Web offers an enhanced capacity for visual material, for audio material, and for interactivity between the interface and the respondent. All these possibilities—which seem so exciting—also raise some concerns. And so we’ve started—Mick and me, and Reg Baker, and Fred Conrad, and some others—have started doing some work looking at these problems, with support from the National Science Foundation.
There are three issues that we think are especially important or, at least, when I was doing this talk, I thought, “these are the three things I’ll talk about.” One is the overall set-up of the questionnaire, its format. Tradition has already evolved that says that Web surveys are just like mailed paper questionnaires, and we should transfer that technology to the extent possible. So the rules for creating an ordinary [self-administered questionnaire] should be followed in constructing a Web questionnaire. And that’s what I call the “static format.” And the other tradition that has emerged is that Web surveys are like computer-assisted surveys, so they ought to follow the conventions that CAPI surveys and CATI surveys follow. And I’ll talk about that a little more. Then there are some issues about what sort of interface you should have and whether you should add humanizing features to the interface. Finally, there’s concerns about the impact of visual images, photographs and the like.
Here’s an example of what I call a static questionnaire. [SeeFigure II-24.] This is our attempt—Mick and I and Reg Baker are involved in this project—to take a questionnaire used as a part of NAMCES, the National Ambulatory [Medical] Care [Evaluation] Survey—and make it part of a Web survey. Clearly, what we’ve done is follow the conventions that the paper questionnaire follows. For example, instead of having a separate screen where you would get a follow-up item, this sort of directs the respondent over to this follow-up item. OK, and likewise, 3b follows that same convention. So it looks like a paper questionnaire; it’s just been transferred to the Web.
Alternatively, you can imagine presenting item-by-item the questions, and then skipping automatically; if the person answered “yes” to 3a then they would never see this. This is the way we would do it in a CAPI survey.
There’s not a lot of empirical literature; there have been three or four empirical tests that have compared the interactive format with the static format, and for the most part they don’t demonstrate a lot of differences between the two. In theory, there are some advantages and disadvantages to each approach. It’s easy to program the static version, it minimizes download time, it accommodates low-level browsers, the respondent can view the entire questionnaire. On the other hand, skips
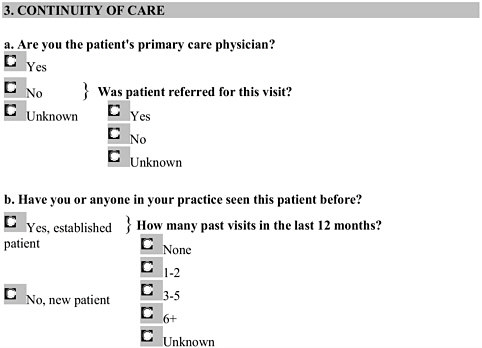
Figure II-24 Example of static design for a Web questionnaire.
and edits can be difficult to handle, you can’t control the order of completion, you get more missing data, if the system crashes the whole thing is lost, randomization is difficult, and so on. I’m not going to walk you through the rest of those.
So that’s one issue—how do you set them up?—and there’s not much empirical literature; there seem to be some a priori pros and cons to both approaches. A second issue is what kind of interface do you build into a Web questionnaire. Already, there’s been—again, given that many of the samples consist of volunteers, there’s been an effort to sort of jazz up questionnaires by adding humanizing touches, making the questionnaire more entertaining. And here’s an example of the Lightspeed MiniPoll, where you have this attractive young woman inviting you to take part— “it’s fun to voice your opinion, and compare it to others!” There she is again—“Thanks! That was easy!”—and then they’re inviting you to be in a LightSpeed panel. [SeeFigure II-25.]And so the idea is that a lot of Web surveys add various humanizing touches to make the survey more fun.
There’s been a small industry in research—mainly generated by two groups of researchers at Stanford and Carnegie Mellon—who have looked

Figure II-25 Humanizing touches in a Web questionnaire interface.
at the consequences of adding humanizing touches to computer interfaces. And their results suggest that humanizing an interface can create problems. People begin to react to these interfaces as though they were interacting with a person. So, for example, in the survey context, you may get social desirability bias effects just like you would in interacting with a human interviewer. This is especially true when social interface features like voice or visual cues are added. And this stands in stark contrast with the survey literature that says when you add voice, for example, to Audio-CASI, that actually improves things. So voice presumably is one of these humanizing cues, but it nonetheless seems to generate improved reporting. Their work is based on laboratory experiments with student subjects.
And here’s an example; this is a study by Nass, Moon and Green (1997), who are part of the Stanford group of researchers. They had students interact with a tutor computer—say that three times quickly—
and then evaluate it on a second computer. So they interacted with one computer that was trying to teach them something and then evaluated it on a second computer. This is their ratings of the tutor based on features of the evaluator computer. And you see that the voice on the evaluator computer seems to have a significant impact on the assessment of the tutor computer. And they conclude that there’s a tendency to gender stereotype, and it can be triggered by minimal cues such as the voice on a computer.
PARTICIPANT: Can I just ask, was the voice on the computer a male or a female?
TOURANGEAU: On the evaluator computer some got a male voice and others got a female voice, and that’s the difference.
PARTICIPANT: Which of those is the tutor computer and which is the evaluator computer, the one on which the voices varied?
TOURANGEAU: I think this was the voice of the evaluator computer, so this is mis-labeled. And these are the ratings of how friendly was the tutor computer and how competent was the tutor computer based on the evaluator computer voice.
So, Charles Turner—who’s looked at Audio-CASI—has argued that, even in sex surveys, the gender of the recorded voice is unimportant. Whereas Nass, Moon, and Green argue that the voice selection is highly consequential; a male voice brings with it a large set of expectations and responses, blah blah blah.
Mick and I have done three Web experiments that compared a neutral interface with interfaces that featured human faces and various other interactive features. And we were looking at the various possible survey response effects that might emerge when you use this humanized interface, including people changing their answers to gender-related questions to appear more feminist if they had a female picture. Or differences in social desirability bias.
So, there’s an example of what we did as a humanized interface … [SeeFigure II-26. Laughter; face in example is speaker’s own.] This was one of the major sexes; I can’t remember. And I don’t know if you can read this, but this is me giving feedback to a fictitious respondent: “According to your responses, you exercise more than once a day. The fat you consume is much less than average, and you currently weigh pretty close to your ideal weight. Thank you for providing this information … you liar, Mick.” Here’s the female investigator, Darby Miller-Steiger—I’m one of the investigators on the project. And then [there] was the neutral interface.
We did a series of three studies; those three pictures, I think, were from the first study, male, female, and the logo were contrasted. There was a high level of interaction. Across—I’ll just summarize—across the
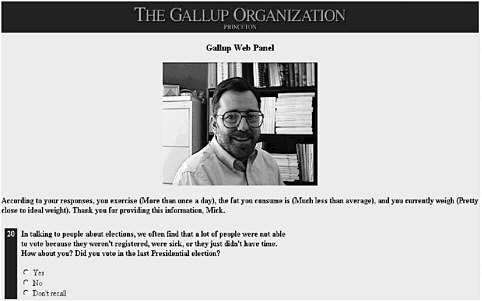
Figure II-26 Web instrument with human face added to personalize the instrument.
studies, we don’t find a lot of differences in the degree of socially desirable responses. We gave people a couple of standard batteries of items that are supposed to measure social desirability. The Marlowe-Crowne items, and something called the Balanced Inventory of Desirable Reporting, BIDR.48 We didn’t find any differences across versions of the interface, nor did we … we also gave a battery of about a dozen survey items that asked about things like drug use and drinking and diet and exercise, and so on; voting, church attendance, sort of standard items that are known to be susceptible to social desirability effects in surveys. And we don’t find a lot of differences. Where we do find differences is in gender attitude responses. And the higher numbers here indicate more pro-feminist responses. In each case, the attractive fuchsia bars represent the female interface and the blue bars represent—guess which major sex? And then the grey bars are the neutral interface. And you always see this trend towards more pro-feminist responses with the female interface. So there is some evidence suggesting that adding humanizing cues to an interface can change things a little bit; we find little support for the social presence hypothesis, this idea that people react to an interface as they
do to a person in response about sensitive behaviors. But we do find some results for gender attitudes, perhaps due to a priming effect.
I’m just about done here. The final issue I wanted to talk briefly about involves the effect of images on the answers to survey questions. One of the appeals of the Web is that it’s very easy to present visual images—video clips, photographs, drawings, the whole bit. On the one hand, you can see how these are appealing, because they could really help clarify the questions. But we were concerned that they might carry misleading implications as well; in particular, images are necessarily concrete. So we thought that images could affect the construal of the target category. And let me give you an example; this was our study design. This was a study that Mick and I did with a researcher at InterSurvey. We asked people how many overnight trips they made over the past year, and some people—with that question—had a picture of a businessman at an airport. Some people got a picture of a family loading up a station wagon, getting ready to go on a trip. And some people got both pictures, and some people got neither picture. The idea was … what we called the Activity A pictures were highly salient—but not necessarily common— examples of the category. So people attend more Little League baseball games than professional sporting events, but they’re more likely to think of a professional sporting event when you ask, “Did you go to a sporting event last year?” You’re not likely to think of the neighborhood Little League. At least that was our hypothesis. And here’s an example of the stimulus: “Overall, how many sporting events have you attended in the last year; that is, since April 2000?” This is the Little League picture and it’s a little bit better on the Web but you get the idea.
These actually were our two best examples—the sporting events and the shopping—where the data conformed best to our hypothesis. So with the salient instance—in this case, the professional sporting event— people reported 2.7. With no pictures, 3.1. With the Little League picture, 3.7. And with both pictures, 3.4. Likewise, here, we asked people about shopping. The salient instance was … gee, I can’t even remember. A department store. And the non-salient instance was a grocery store. You show people a picture of the department store and they report 7.7 instances of shopping; 8.7 with no picture; 9.0 with a picture of the grocery store; and with both pictures it goes up to 9.8. There seems to be some kind of impact of the image on how the category is construed, and it affects the overall frequency.
So let me wrap up. There are difficult sampling issues in stand-alone Web surveys—Web surveys that don’t offer other response options— particulary when they intend to represent the general population. The situation, the sampling situation, is better for certain restricted populations—for example, students at a single university. Mick and I have
been investigating the possibility of doing surveys of physicians, and it looks like 95 percent of physicians have Web access. The situation is also better for mixed-mode surveys. Response rates are generally low, but they can approach 70 percent. There are many, many tough measurement issues. Some of these design issues reflect that there are two separate and contradictory design traditions: one says that Web surveys are like usual computer-assisted surveys and the other says that, no, they’re like typical mail surveys, like paper questionnaires. In addition, the visual character of Web surveys raises some interesting issues.
That’s it; thank you very much.
All right, you’re allowed to ask questions now. Pat?
DOYLE: I’m curious that you would present the response rates as sort of being OK, because the experience in what I’ve seen with household interviews is that they really are very low. And, in fact, in the numbers you put up, the only number that was above 60 was the Bates study, which was not a household survey; it was a survey of people in businesses. It does seem that the Internet surveys are much more successful on the business side than the household side. I’m real surprised to kind of hear you tout those response rates as encouraging.
TOURANGEAU: I think that, in time, I can imagine that these rates will approach those of mail surveys. So that’s maybe the right, guarded conclusion. You can imagine Web surveys using a sequence of reminders, similar to what’s done in mail surveys, and achieving similar results. Now, for the general population, absolutely not. I mean, right now you don’t really have access to the general population unless you do special things like install equipment in their house. So … I know, I think that for the same kinds of applications where a mail survey might be reasonable, you might be able to get similar response rates using a Web survey.
DOYLE: But you’re not—I guess the numbers don’t show that yet …
TOURANGEAU: In the one case, it did …
DOYLE: … unless you’re really optimistic. It was only in the case of the business study where the rates were comparable, the Bates study, where literally everyone was at work.
TOURANGEAU: Right. But isn’t it the case, though, that mostly mail surveys are done when there’s a list frame, and so on? So I think that’s the feature, and not the business thing. Miron?
STRAF: Your visual images are really just setting the context for what you mean by shopping or sporting events, and you don’t expect the same results if you add language? Such as, “a Little League game”?
TOURANGEAU: You know, we’ve gone back and forth … that’s a good question. And I definitely agree with you, your first point, which
is that I see images as context, as survey context. Part of our motivation for this study is: because images are so easy to do on the Web, you see a lot of it. And the examples may not be particularly well-selected. So that’s an issue. There is some literature suggesting that people are more likely to process images than they would verbal material. But in principle what you’ve said is right: you’ve drawn some exemplars from the category and it helps shape the perception of the boundaries. And in the case where you do the highly salient instance it seems pretty clear that they’re drawing the boundaries more narrowly than they would if you take a non-salient instance.
You had a question, I think?
PARTICIPANT: I’m just curious about the difference in response rates between the mail and the Web. Most people I know are somewhat more interested in using the Web in those instances. How do you … [trails off to inaudible]
TOURANGEAU: Well, in every study but that one, mail exceeded Web in terms of response rates; that was the point Pat was making. In every single comparison, mail exceeded Web, significantly so. And so, I think, though, that mostly reflects our inexperience with Web surveys and the difficulty. I mean, maybe one big difficulty is that it’s easy to slip a two-dollar bill into a mail survey but it’s more difficult to do that … I think that none of these studies—Mick, correct me if I’m wrong—but I don’t think that any of those studies used incentives, did they?
COUPER: There is one recent exception, a study that Reg and I are involved in. Again, a survey of Michigan students where we got a 63 percent response rates by the Web versus 41 percent on the mail. And what we did is deliberately send out—this is to students at Michigan—a Borders gift certificate; Borders is headquartered in Ann Arbor. And when they completed the Web survey they got an ID and could immediately claim a $10 gift certificate.
TOURANGEAU: Was that in both groups, or just the Web?
COUPER: It was in both groups, but was more of a factor in the Web group.
TOURANGEAU: So, again, my conjecture—and it is just a conjecture—is that with greater experience we’ll get to a position where Web is sort of the equivalent of mail. Yes?
PIAZZA: I was talking recently with the person at Berkeley, with the person who does surveys of the student population there. And he said that they used to do these surveys by mail but that the response rate had dropped way below 50 percent. And now he’s doing all of his surveys by Web, with some e-mail follow-up, and he routinely gets about 50 percent—a much better response rate by Web than by mail, right now.
KALSBEEK: So does that possibly mean that the convergence that you anticipate—and I tend to agree with you—might be more a matter of the technology generation getting older and beginning to move into the population. Is age a factor in the things Mick is talking about; do you expect these effects more because use of these tools is more of a way of life for younger people?
TOURANGEAU: I like that speculation, too … I would anticipate convergence, or even a cross-over, happening in the younger age groups. Yes?
PARTICIPANT: What is the length of these Web surveys before you start to see a lot of break-off?
TOURANGEAU: I don’t think that there’s a magic formula here. I think a lot of it has to do with what you anticipate. For instance, we did a study—this is actually using interactive voice response, telephone Audio-CASI. Well, actually, we used the long-form questions from the census, the decennial. And people broke off whenever they got to a new person; you know, a light went off, “[Uh-oh], 35 dull questions about to come.” And then they hung up. And I think you’ll see similar phenomena when it comes to the Web; when people can anticipate a lot of tedious questions, you’ll have break-offs. On the other hand, I’ve also done some surveys where you had no progress indicator, and it was just one item after another, using the interactive format, and you’re just totally clueless about how far along you are, and I—at some point, that’s not a successful strategy either, and there, it just might be a function of time rather than anticipation. Miron?
STRAF: If I could ask another question, on the collection of sensitive information … some of what you’re showing seems to show that there aren’t major desirability effects and the like. But are there alternatives, and here I’m thinking of things like randomized response, using the Web?
TOURANGEAU: I’m not sure. All of our results tend to come from comparisons of different Web interfaces. It’s conceivable that people didn’t, weren’t sensitive to the different interfaces because in every condition they’re underreporting sensitive information. You know what I mean? In fact, there’s one study done by Moon, one of the Nas collaborators, who asked the same questions but portrayed the computer that the respondents were using as either a standalone computer, not hooked up to any kind of network, or part of a network and the questionnaire resided on a computer across town. Or on a network and the questionnaire resided across the country. And you got more socially desirable responding when it was viewed as being across country, hooked up to a computer across country. And it might be that people, when they’re using the Internet, are very sensitive to the fact that people could be


