
UNDERSTANDING THE DOCUMENTATION PROBLEM FOR COMPLEX CENSUS BUREAU COMPUTER ASSISTED QUESTIONNAIRES
Thomas Piazza
CORK: The first block of talks we have this afternoon is going to deal with the documentation problem; later in the afternoon we will turn to the problem of testing. We will have three talks in the general area of documentation, and the first one is going to be by Tom Piazza, who is the head of the Survey Documentation and Analysis project at the University of California at Berkeley. Tom?
PIAZZA: Right; now we’re going to talk about documentation. We had a great line at lunch. We said, “What are we talking about?” You know, what are you documenting? And what was our line—“gratuitous complexity,” I think it was.
At any rate, that’s what we have to deal with. I’m first going to give just a few words of introduction to the instrument documentation problem in general. Then, I’m going to talk about instrument documentation for CASES instruments. And then Jelke Bethlehem is going to be talking about instrument documentation for Blaise instruments, using the TADEQ system.
Incidentally, it’s hard sometimes to see this screen—a lot of this stuff that I’m going to talk about you’ll find at page 79 in your [agenda] book. At least those first couple of pages give the basic structure of what I’m going to be showing. So you might refer to those if you have some difficulty with the screen.18
Now, in terms of instrument documentation in general, I found very interesting this discussion in the morning on testing and documentation for computer programs in general because it is the same basic problem. And we sometimes get caught up in the complexity of these instruments and think that it’s completely different. It’s not completely different, but it’s good for us to step back and look at things from a global perspective.
Why is documentation a problem? Notice that it was introduced not as “let’s talk about instrument documentation” but “let’s talk about the instrument documentation problem.” It is perceived as a problem, and indeed it is. And part of it is the pressure of production work. It does get pushed to the end, and I suppose that’s inevitable. But we haven’t really dealt adequately with it.
|
18 |
As of the time this report went to press, Dr. Piazza’s Web site—from which he delivered this talk, and which contains links to additional information on both IDOC and TADEQ—is still accessible at http://sda.berkeley.edu/present/automation. From that page, links are available to the specific pages referenced in these remarks; we have excerpted some of those in this printed report. |
And another situation is that documentation really depends on the proprietary tools you happen to be using. Now, many times when you’re testing and documenting computer systems and tools … [that is, in general computer systems testing,] you don’t have to use, necessarily, documentation tools that are dependent on a C++ processor, for instance, or something like that. But [in the survey community], because a lot of our CAPI instruments are so tailored to proprietary systems, our documentation is also dependent on that.
And that’s one reason I was talking about a possible future—this is an idea that’s been floating around for a while—where the documentation language could work off of some common representation of the questionnaire so that you would at least have enough market for developing documentation tools. See, right now, these are all stovepipe-type operations, and it’s very difficult for anyone to do documentation without getting to the innards of all this. Now, as we’ll see in the TADEQ presentation, they’ve approached this a little bit in terms of having an XML representation of the Blaise instrument. So they’re thinking along these lines also, to some extent. From a computer design perspective, if you’re thinking along the lines of, “this is a good model,” I just want to make sure you understand we’re already thinking about that. It’s a possibility, but I would say it’s—it hasn’t gone anywhere. And I would say that, occasionally, it gets, I would say, “polite yawns.” [laughter]
On that cheery note … We’re not going to document a pie-in-the-sky model. We have to document the instruments we actually have, the way they run right now. And so let me talk about documenting CASES instruments. I’m going to show you first what some aspects of what an instrument document (IDOC) looks like, and then I’m going to say briefly how one is created, and then maybe a few closing comments before we turn to the next discussion, which will be on documenting Blaise instruments.
If you’re going to start with an instrument document, one thing that’s useful to do—perhaps you have done—there is an online file that is always available with an instrument document that gives some information on, you know, what it looks like, what indexes are available, it talks about it. And even, down here—it’s kind of cute—it even gives you a color-coding that you’ll find in there. So, if all of these things aren’t immediately intelligible, some of these things you can obtain just by looking at that help file.
Now let’s switch to the opening page for our old friend, the SIPP instrument. When you look at the instrument document for the SIPP instrument, this is what it comes up. Here it says the title and so forth, and so forth, and it says, “start over there on the left.” And you can get the help file I told you about, which is the way to start. But what I
want to point out first are indexes, because—in a CASES instrument— it’s difficult to document top-down logic because it’s a GOTO-structured language.19 So about the only thing that can help you here is a variety of indexes to different parts of the instrument.20 And it helps you get some top-down view.
I’ll come back in a second to the input screens, but I’ll show you, here, “Items within Modules.” Usually, Census Bureau instruments are designed in a variety of modules. Now, notice the only one here that’s got any text—because Pat Doyle has an interest in that—is the medical expenses module. So you have various aspects of the SIPP instrument, and this is one we could look at. And if you go here, you could look at the various items that are within the module. Notice that the color-coding comes in here—the red ones are respondent input. In other words, these are so-called “input items” where the interviewer will enter some data. And the others have to do with tests and logic and things like that. And these types of secondary things are what you get when you have multiple items on a screen—in other words, you have one screen but many questions on one screen. And that’s your clue that that’s whats going in those cases.
So that’s what you get for just an overview. Let’s look at “alphabetical order”. Well, sometimes that’s useful, but there are so many instances. [If] you have some particular item you’re looking for, you can find it. But [that’s] rare, I would say. The best thing are the keywords, where you can go and find particular items based on keywords. So let’s look at “health insurance” here. And, oh, there they are, a couple of items. But the problem is that keywords have to come from human intervention. And human intervention is a rare thing in instrument documentation. [laughter] There, special effort was made to put these up, but that’s about it.
There’s an esoteric structural thing here—[the index on] “roster and section transitions”—that only a specialist would care to look at in terms of trying to understand how transitions go from one part of an instrument to another, particularly in this type of instrument where we have rosters. Now, “rosters” mean cycling through people—all the people in a household. And that adds complexity, and this gives you some indication of how those things go. Again, if you’re a specialist, you might find that useful.
One of the things that I do want to look at here is the index of input screens. What this means is … let’s pick a module here, the medical expenses one again. And the interesting thing here is that this lists only the screens that take input from the keyboard, and this is often what people want to look at—to see what is presented to the interviewers or to the respondents in a self-administered mode. And you can just start here and look at any of them. And what you can do, once you get into the guts of this, for every item you have a thing up there—notice it says ME04 is the next screen in the instrument—is just by clicking this one thing, you can skip through all of the input screens in the instrument. So this is one way to get a quick look about what is there.
And I might add that most of this documentation is really done online—that is, you can see how this hypertext linking takes advantage of this being just a series of HTML files. You can’t duplicate that on paper. However, there is an option to produce an ASCII file of documentation. And the default mode is to show only these input screens, because that’s typically what you have to print out and show somebody because they often want to know what types of questions you’re asking. And you might need approval for that type of question. That is a possibility.
But I’m going to switch gears here now, and let’s look at an individual item—one of these health insurance items we were looking at [item ME16]. [SeeFigure II-5.] And you get a sense of the complexity of what you think might be a relatively simple question. Here we have some of these “fills” that Pat was referring to—in other words, you don’t just leave this up to the interviewer. You try to provide the name of the person you’re interviewing, or the relationship, and sometimes that affects the question. So you wind up with things like this, [fill TEMPNAME]. What is TEMPNAME? Well, you can click on this and go to that part of the instrument, and here you’ll notice [it says] “first name last name/you fill,” and here at the bottom is an indication that this item has been stored from another item.21 You see how complicated this gets. So you don’t really know what’s there. But, here, these items tell you where possibly something could have been stored.
Let’s go back, and another thing to notice is—look at this here—[if PCNT le <1>].22 Here, the text of the question is conditional. And the issue here is: how much did so-and-so pay for health insurance, or how much did so-and-so pay for health insurance for you, or for oneself? And, notice here, [fill SELF]—you want to know who “SELF”is?
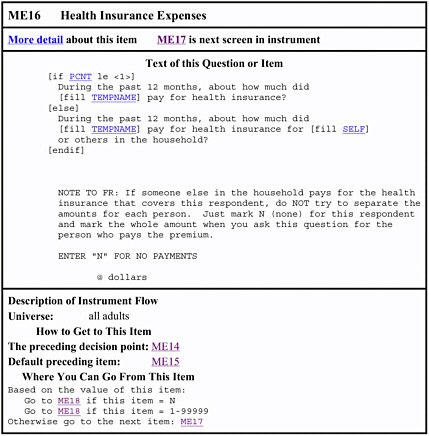
Figure II-5 Item ME16 from Instrument Document (IDOC) for Wave 6 of the Survey of Income and Program Participation (SIPP).
Well, here we go—what is SELF? Depends—it could have been stored in any of these three items.23 So these are complicated instruments.
Notice here—“more detail about this item.” We try to present fairly simple things. But if you want more, well, OK, we’ll give you more. [See Figure II-6.] And notice the logic associated with it. We see that if the response is: how much do you pay, between $1 and [$99999 per year], you go to one item. And if you pay nothing you go to the same place. But look at these “D”s and “R”s—if they don’t know or they refuse, then something else happens. Here, let’s return to the main description
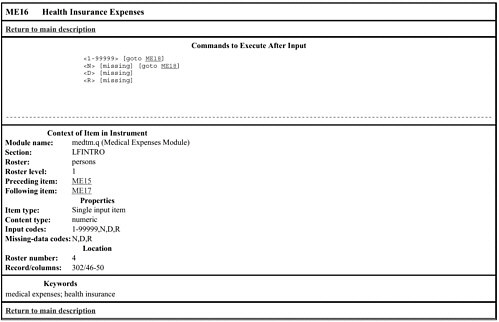
Figure II-6 “More Information About This Item” View of Item ME16 from Instrument Document (IDOC) for Wave 6 of the Survey of Income and Program Participation (SIPP).
and see what happens. It goes down here, here’s a summary [of] what happens.24
Now I’d like to talk a little bit about the logic tools that are available. With a GOTO-based instrument it’s very difficult to get a top-down view because, really, you can go anywhere. And, often in these instruments, they do. [laughter] So, it’s possible with a GOTO language to write a very structured thing. Think of an old BASIC program, with the line numbers—you could go from anywhere to anywhere, the old spaghetti code. CASES is like that.
Why is it like that? Well, it’s in response to the development environment out of which it came. In other words, you start with a paper questionnaire, and on the paper questionnaire, you have something where if you answer “yes” there’s a little arrow that says “go here” or another arrow that says “no, go there.” And what CASES did—in the development
environment of its time—was to make things as close as possible to a paper-and-pencil questionnaire, instead of a computer science approach, which is more what you’ll see in Blaise, where you start with a model and a logic. CASES came out in an earlier, a different environment in which we really tried to make it look like a pencil-and-paper questionnaire. And that’s also why nobody seemed to think of documentation, because a paper-and-pencil questionnaire is self-documenting, sort of, and the early users of CASES thought that a CASES instrument would be similarly [self-documenting.] And it is more readable than a Blaise instrument, in that sense. But once you allow it to become more and more complex that analogy breaks down, and it has broken down. And that’s the problem.
So, at any rate, what do you do with a GOTO-based language? Since you can’t really get a top-down view, the most you can do is get a sort of bottom-up view. And what does that mean? Well, a few things. Take a look at this section here—where you can go from this item [referring again to item ME16, Figure II-5]. Now, even in a GOTO-based language, you can always know where you’re going to—I mean, that’s the point. So, at any given moment in the questionnaire you’re going to go somewhere else, and that’s obvious from the questionnaire itself. And, in this case, notice what we have here—based on the value of this item, you’re going to go to ME18 if this item equals “N” for “none”, or you’re also going to go to the same place if it’s between this range; otherwise, you’re going to go somewhere else. Now, in this case, you’re just going to drop through to this next one, and if they don’t know or refuse how much is paid for health insurance you drop down to this one where you try to get them to answer in terms of ranges—ranges of amounts. So, at any rate, from the instrument you can figure out where you’re going to go to—not a problem.
Trickier is to find out where you came from.
Now, here we have the default preceding item—ME15, let’s just click on that. OK, bed days, well—this means that that’s where we came from. Let’s go back, and where does this come from? Now this is not obvious from the instrument itself. But the program that puts together this whole set of HTML files goes through all of the destinations in the instrument. In other words, for every item you know where you go to.So,forevery item to which you go you maintain a list of all of the other items that said, “go here”. Usually, there aren’t that many immediate ones; there are many paths to get there, but there are usually just a few items that say, specifically, “go to this item.” So you make a list of those. And if there’s only one, you wind up here with just one, ME15. In other words, there is no other item in the whole instrument that says, specifically, “go
to ME16”—the only one is ME15, which happens to be right above it. So, in this case, it’s simple.
Now what else can you do? One more level of abstraction is provided in the IDOC thing, which is the “preceding decision point.” Now, what does that mean? Think of a typical questionnaire, in which you have a series of items—you go from this one to that one, to the next one, to the next one, to the next one. OK? In other words, there’s no logical issue here—you just keep dropping down unless, conceivably, you skip out—but that’s a different issue. So you just drop right down. So what’s useful to identify, sometimes, is: where is the beginning of this series, at which some decision—some logic—could enter? And that’s what this particular thing is, the preceding decision point. Now notice here that ME15 is the preceding item but ME14 is the preceding decision point. That’s the point—let’s go back there—at which there is some logic which could affect the flow. And we could look at “more detail” here and see what we have—yeah, sure enough, let’s look at some of these things. Here we go … ooooo, quite a bit!25 … Here are commands, a set of commands. For the faint-of-heart, we bury this on the second page of every description. But, at any rate, that’s what happened.
This is basically all of the logic tools you have available in IDOC, for CASES instruments—as you see, just from the point of view of the bottom up. From the local item—where you can go, where you can come from, and then the beginning of a series for the decision point. Conceivably, you could use—particularly these decision point items—to create a higher-level structure. It would be possible to do that, so that— even in real time, you could say, “I want to map how do I get here, what’s involved?” And, from a local point, you would get forward-and-back a little bit.
It would be possible to do that, huh? I don’t think I’m going to do it, but … [laughter]
PARTICIPANT: This information is supplied by the CASES instrument versus input by the persons implementing the specifications?
PIAZZA: All of this is really provided by the system itself; we don’t really rely on individuals. There is one exception—if you look right above here, where it says “‘description of instrument flow universe.” This is just an option for people to put in, “all adults.” [It’s] just an annotation.
Now it would be possible—and there are hooks—for the author to put a lot of this information in as you go. And ideally that’s the time to
put it in, because when the person is writing this particular item he or she knows at that point who it’s supposed to apply to. A lot of information is available, at that point, and if you have a hook, you put it in, it’s carried forward in this instrument document as well. And—if you don’t put it in now—no one’s going to go back and put it in later. That’s the reality.
So a lot of the things we talk about, that Pat talked about, in terms of organizational problems and priorities and so forth—this is one more thing for authors to worry about and do, to put in these bits of information.
I’ll give you another, simple example—here, just look at this particular item. “Health insurance expenses”—the long label that we love and use in SAS, SPSS, and so forth, a long label for each variable. That’s not a part of a [CAPI or CATI] instrument because … sure, you need a name for the variable, but you don’t need to put this long label. So nobody puts it in. Now there’s a slot to put it in, and you could do it, and if you did it would be carried over to the documentation. And it would even be carried over to a set-up for SAS. But, since it’s not required to make a [computer-assisted] instrument run, people tend to overlook it.
What we try to do in documenting CASES instruments is—if nothing is specified—we try to manufacture one from the first line of the question. So, here, what would you have? “During the past 12 months about how much did … ” Well, OK—that’s not … I guess you’d get a sense that it’s something about how much of something, but it wouldn’t tell you too much … Although I think we’re getting more sophisticated [in deriving these default names], so if we just drop this fill [and thus omit the first clause of the question]: “How much did x …”—well,that’s not much better. And then you have [other] fills as well, so that makes it more complicated.
So at the time this item is being authored somebody would have a fair shot at coming up with a descriptive label for this item. But one reason people have not done it in the past is that they haven’t had any confidence that it would do any good [or] that it would be carried over to the next stage. [There] is a hook in the system to allow doing that, but I don’t think it’s done very much. Part of the problem is an organizational one. At the Census Bureau—[where] the authors don’t ever have to use the data—there’s very little incentive to make things easier for people down the pike when they’re under immediate pressure to get their own job done. So part of it’s an organizational thing.
So, at any rate, I think that’s about all I have time for in talking about this part. Before I move on, does anybody have any questions about instrument documentation here, that you’ve seen? Something drastic?
PARTICIPANT: Would you get any major pushback, resistance from the authors, or would it be feasible, to require more of the tagging, descriptions, test information into the original authoring?
PIAZZA: Well, that would be for Pat to answer—I don’t know—or the authoring staff. Let’s see what they would say.
DOYLE: Typically, if the author is providing the label for a particular item in the instrument, the problem is that that’s not the person who needs to create it. The person who needs to create it is typically the analyst who invented the question, and it’s most efficiently done at the point in time they invented the question. Well, some of our questions were invented forty years ago [laughter], and the exercise of going back now and finding some one to go through and provide the nice labels …. It would be phenomenal for the user community to have. It’s just [that] it’s hard to get ’em motivated. You know, this is part of my behavior chain—to get the industry as a whole to habitually include these nice English additions.
The other thing that’s user-input here is keywords, which is a very useful tool for anybody looking for answers. And if we could do keywords, and feed them into the questions, we could help our users so much. And my IASSIST friends are over there, smiling away.26 They know the value of these things; they’re phenomenal. But the only person who can really do that well is the person who’s designing the question, who knows the content and what they’re trying to get at…. It’s a real dilemma.
GROVES: When you’re doing this, Tom, what are the different users you’re thinking of? Who are the different users? And, if you place one user group over another … who are the readers of this documentation?
PIAZZA: I wish I had a good sense of that. I mean, most of them I think are at the Census Bureau. Most of the CASES users don’t have instruments that are complicated enough to go through this, I think; many of them just have very straight-ahead instruments, and they still think that they can just read the instrument. So, I’m not aware that many people use it except at the Census Bureau. And, here at the Bureau, I’m not sure who uses it. Pat, maybe you could say?
DOYLE: Well, I thought the question was: what was the intent?And the intent is quite different than the actual. It has very little usage, at the moment. And this is mostly because very few of the instruments have the additional or optimal labels to facilitate transfer.
Its intent was to serve everybody who needs to use the instrument. Someone like Libbie [Stephenson], who’s going to go get the SIPP file
for the data archive, the data library, to get it to her users. And she needs to “hand over” the questionnaire. So she could hand over this—either a URL or this document—to a user, and they could sit down at Netscape and figure out what’s in the survey. The intent is also to have something to hand over to [the Census Bureau’s Center for Survey Methods Research (CSMR)], to the cognitive people, to see the different variations on the questions, and assess whether or not there are problems … so, to learn what’s in there before they begin to develop alternatives. It’s basically for anybody and everybody who would have normally wanted to look at the paper instrument.
PIAZZA: There’s an additional problem, too, and that is—especially in terms of federal data sets—all of these variables are derived, or censored, or recoded, or something, so that the data set you get is far removed from the original questionnaire. So, one thing that we are working on in terms of the documentation of the data sets is to allow links back to the document for the questionnaire, which is related but not the same thing. So that becomes a [more] complex project. But that can be done as well.
BANKS: It begins to sound as though one wants to have many, several, different, independent kinds of documentation.
PIAZZA: Yes.
BANKS: One documentation for the analysts, one documentation for the potential user, and so forth. And that these shouldn’t necessarily interact at all.
PIAZZA: That’s true, that’s true. In terms of the analyst, that’s focused on the data set, huh? So, occasionally, you may want to go back and say, “Let me see where this variable came from.” And you click, and you could go back to the original instrument. And in terms of many of the users on the production side … well, that’s another issue. The developers may want all of this information, particularly focusing on some of the logic issues.
One of the by-products of creating the instrument document is that you have this whole list of—this matrix of where you can go, from where to where. And if it turns out that one of your items is not the destination of anything, this becomes rather obvious. And in fact the process prints out a warning message, so that you’ll know that nobody can get to here. So that’s one diagnostic aid that’s a by-product of doing this kind of documentation.
Ideally, too, people should be able to pick the level of complexity they want to look at. We sort of isolated this by having the main things on one page; then you go to another page that’s more details. But, you know, ideally, you could also say let me click-click-click specify directly
what I want to look at—just those aspects of each instrument. So, all of these things are possible, but result in a more complex interface.
PARTICIPANT: It sounds like a lot of what you’ve been talking about is to get people to use, to put these sorts of hooks into the programs. And I think this gets back to what Jesse [Poore] was saying this morning, about the specifications documents, getting the questions together and putting labels to put with questions.
I haven’t heard anybody say anything about this today but there’s an effort at the Census Bureau to put together a corporate metadata repository, which would be a place where you could put those specifications. And it drives part of the software development process—be it CASES or Blaise—to get the labels onto data at that point of the process, to make it easier to either analyze data or to document it on the Web … [trails off to inaudible]
PIAZZA: Is it? I don’t know. I mean, there is a movement to use …
DOYLE: Well, the corporate metadata repository isn’t focused on the needs of household surveys as much as it is business surveys, so it doesn’t have all the components. But the basic idea is right—we are using other tools for the same purpose, particularly in database access tools.
[You] had said something earlier about using this to drive development? Well, part of the design of the database is to include these additional pieces of information that are only used for documentation purposes—the labels, keywords, and that sort of thing. But, again, just having the place to put it doesn’t necessarily mean that it’s going to get put there. So we still have to … we can do everything we can do to save it and preserve it once it’s put there. We just need to get someone to put it there.
PARTICIPANT: Right. But the only way you’re going to get people to put it there is to make your software system …
DOYLE: Well, if you try to force someone to put it in—in other words, if you …
PARTICIPANT: … I guess, a penalty for them not to put something in.
DOYLE: OK. But what they could do is decide not to use the tool, and go do it in their word processor. They’ll find a way around it, if they don’t want to do it.
PIAZZA: Given that it’s more work, right.
DOYLE: And they’ll do that if they don’t see the value. So we need to teach the value of doing this; all these individuals need to see what can benefit them, and the use of their data, by their taking the extra step forward.
PIAZZA: Right. OK, I’m about out of time here, so what I want to do here is to make one mention here—that you should be aware of the Data Documentation Initiative (DDI). Instrument documentation is somewhat different from documenting datasets, but there are a lot of things in common, and these two things are aware of one another. So, that’s one thing to keep in mind, is there are some standards for documentation, and we’re trying to make use of those.
Then, the other thing is that it is possible to do some sort of convergence of documentation systems. I won’t go back to the original flowchart. But some of the stuff that we do is related to what you’re going to hear about now, with Blaise. For instance, what a CASES instrument does … there’s a program that creates an ASCII file that’s got all of the specs in it, which is then put together. And then—what you’re going to hear about in TADEQ—that also generates an XML representation of a Blaise instrument. [So, ideally, this migration to a common intermediate format might make it possible to develop more universally applicable documentation tools.] And maybe more would get done because, remember, this is a very small market. And unless you have a broader range of applications, a lot of these tools just don’t get developed.
So I think I’ll stop there and later on I can take any questions you might want.
POORE: I keep seeing a graph, and each instance being a walk on the graph.
PIAZZA: Awhat?
POORE: A walk on the graph. Why isn’t that enough documentation?
PIAZZA: You mean, a flowchart sort of thing, or what?
POORE: A directed graph, from beginning to end of the instrument. And each instance of the survey, you can peel off of the graph.
PIAZZA: That’s true, but there are so many graphs.
POORE: No—one graph; many walks.
PIAZZA: OK, but so many walks! I mean, that’s our problem.
POORE: One per interview …
PIAZZA: But if you have 100,000 interviews, that’s hard, you know?
POORE: Well, OK; I just, it doesn’t seem that hard to me.
PIAZZA: It’s doable, but who’s going to look at it? I’d love to talk about these things but we have to move on, so let me close this down.
PARTICIPANT: But maybe a lot of the interviews follow the same path?
PIAZZA: Oh sure, oh sure.
PARTICIPANT: And that knowledge would narrow things down a lot.
CORK: Let’s have one more [question], and then we have to make a switchover in technology here.
PIAZZA: Right … Why don’t you start now, and I’ll just take any final questions here?
BANKS: Going to Jesse’s point about the many possible ways through the graph, it would seem that one would probably go a long way down the road towards documenting things adequately if you had … if you treated each module as a vertex in the graph, and then the paths linking modules in the graph, going from one to the other. One has one kind of documentation for a flow, and I think you would want to have pairwise documentation for pairs of modules. And I don’t know if you need to go through the exercise and effort of documenting all possible paths when getting connections between modules of questions could carry you a very long way down the road.
PIAZZA: Right, right. And we have to find some way, like that, that will give a close enough approximation. But partly it’s just to understand the major, just the overall view of the instrument. It’s not the case that we need a full flowchart of everything because that gets very complicated. And a lot depends on the design of the instrument. If it’s really a modular design, then of course it’s a lot easier because you just go from one to the other. Then, within those, recursively, you have the same setup.
DOYLE: The other part of the issue, of using just a flowchart, is that it’s critical to fill out the words. And once you try to fit all of the words in a flowchart, you’ve taken up a lot of the visual real estate with the words, and you can’t get a lot of your paths in there. So what you wind up lots of times is a visual of the flow and then the text of the questions. Which, if you’ve got these in some nice coordinated software package …
PIAZZA: In synch, right …
DOYLE: In synch, then it’s probably all right. But that’s where it needs to go. but it just can’t be a simple flowchart. Because there’s too many words to put into one box.
PIAZZA: Actually, TADEQ does some of that, where you go through and then click on the side; you can select the view and get the text of the question. But, as you see in the examples I’ve presented, sometimes the text of the question—as in the instrument—isn’t all that informative because it’s conditional text or it has all of these fills. So it’s really hard to know, for a particular interview, what really was done.
PARTICIPANT: [inaudible]


