
PIAZZA: Maybe your point is: I guess we don’t have to, if it worked, if they got to the end all right. It’s true, the amount of energy it takes for documentation. It makes you wonder, huh?
GROVES: The one thing about what we do is that we are utterly uninterested in a single interview.
PIAZZA: Yes, yes, usually.
GROVES: What we’re interested in is the information that is taken away by summarizing. So in a way I think Jesse’s point is well-taken; if you had a visual technique that could readily identify where 90 percent of the cases are going to appear, or 80 percent of the cases, or the modal case—that would be very valuable. I don’t know how you would do that in one visual appeal, given the nature of these trees.
PIAZZA: The one case where we really are interested in the individual record is to make sure that the logic was followed for that individual records—in other words, that the averages are based on appropriate answers to the things that we’re answering.
PARTICIPANT: It’s of interest to the users, I suppose.
PIAZZA: Could be.
PARTICIPANT: One other role for individual traversals of the graph would be for what’s called regression testing. So that if you could save these traversals of the graph, for this information, and then you redesign some features, these are scenarios that you could then run through to make sure that what you’re doing satisfies, meets what’s previously been done.
PIAZZA: OK, all set? Thank you.
THE TADEQ PROJECT: DOCUMENTATION OF ELECTRONIC QUESTIONNAIRES
Jelke Bethlehem
CORK: OK, now that I’ve learned the difference between “Shut Down” and “Restart” in Dutch … [laughter], we’re just about set.
Our next speaker is going to be Jelke Bethlehem, who is a senior advisor to the Department of Statistical Methods at Statistics Netherlands, and is past head of the Statistical Informatics branch there.
BETHLEHEM: Well, let me start by thanking the organizers for inviting me to participate in this conference. Up until now, it’s been quite interesting and a lot of fun to be here for an exchange of interesting opinions.
What I’m going to do is …well, I think Tom Piazza almost gave my presentation, so I don’t have to add much more. [laughter]
What I want to tell you is a little bit about some research we did in Europe with respect to questionnaire documentation and—to be more specific—questionnaire instrument documentation. The background of this is the same as was already discussed this morning.
We changed, in the Netherlands and in Europe, to computer-assisted interviewing—and in particular to computer-assisted personal interviewing with laptops—in the 80s of the previous century. And we had, from [that] moment, a growing complexity of questionnaires [and] growing size of questionnaires. We have seen, a famous example, instruments with 10,000s of questions. And indeed the old paper questionnaire was more-or-less self-documenting. But these large, complex questionnaires have become more and more of a problem from the point of view of documentation.
So the basic question is: how can you make, for a complex, large questionnaire instrument, a human-readable documentation? And we wanted to have a solution for that and started a project to develop a prototype for that, and that became TADEQ. So we want to generate, to create a software tool for questionnaire documentation. And, when we thought about it, we realized that once you have a tool for questionnaire documentation it’s also a very useful tool in the process of developing a questionnaire. Because more or less the same aspects with respect to documentation, and getting insights into complex structure of the questionnaire, are involved in both the final documentation and in the process of developing it.
What we tried to do—as Tom also explained—was that we started in a later phase of thinking on this issue, and tried to have a more-or-less object-oriented approach in developing a questionnaire documentation tool. We see a questionnaire instrument as a collection of objects—all kinds of objects you can have in a questionnaire. Questions, checks, route instruction, computations—whatever you can think of. And all these objects are part of a kind of questionnaire execution tree.
So here I’ve named a number of these types of objects. You have questions—the various types of questions [such as] open, floats, numeric, etc. Route instructions, which can either be GOTO-oriented instructions as in CASES or IF-THEN-ELSE structures like in Blaise. We have checks in the questionnaire structure; these were not mentioned too much this morning, I think, but these are a valuable, extra advantage as compared to a paper questionnaire. You are able to detect inconsistencies while you are carrying out an interview, and are also able to correct incomplete answers in the course of an interview. If you have to do that later on, in the office, it’s almost impossible to do that. So we feel that, with respect to checks, a questionnaire instrument can add to the quality of the final collected data. You have computations, you have loops. And
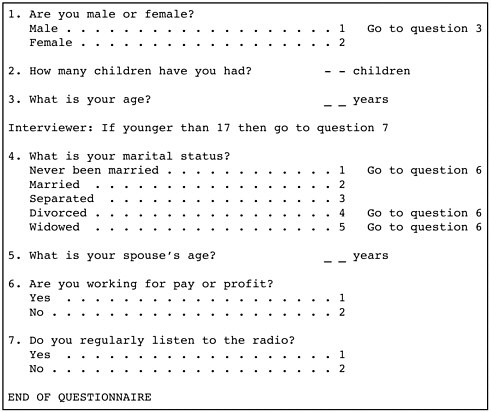
Figure II-7 Portion of a sample questionnaire, as it might be represented on paper.
we apply, in Blaise, a more-or-less modular structure, in that we have one big questionnaire but can divide that up into sub-questionnaires, and those sub-questionnaires can be divided, so that you have a more modular approach that I think is very important when you’re working on large questionnaires.
Just a simple example—maybe not very well readable in the back of the room. But this is the typical paper questionnaire as it existed a number of years ago. [SeeFigure II-7.] You have the various types of questions, and you have routing instructions that can take two forms. You have these jumps attached to possible answers or you have, say, interviewer instructions that tell the interviewer to go elsewhere in the questionnaire if some condition is satisfied.
Well, this type of questionnaire—if you programmed it in CASES you would have something like that. [SeeFigure II-8.] Of course, you will find the definition of your questions, and the routing instructions,
the GOTO-type instructions, in your code, either as separate instructions that instruct the system to go elsewhere or jumps connected to the outcomes of questions.
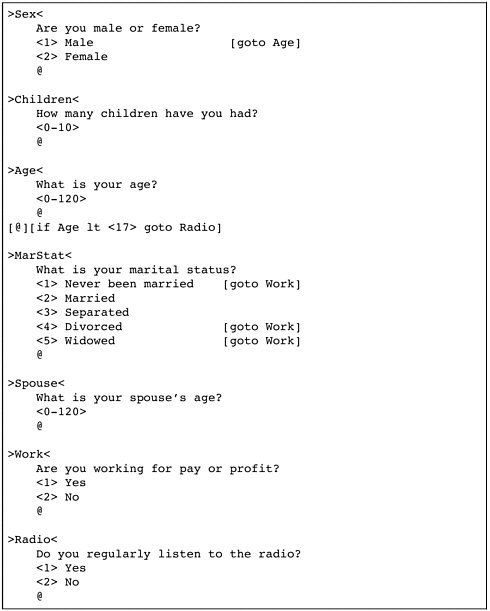
If you would do that in Blaise, you would get a bit different piece of code. [SeeFigure II-9.] In Blaise, we [felt] that it was important to separate the definition of the questions from the logic of the questionnaire. So we have to separate two parts of the questionnaire: we have the field section in which the questions are defined and every question has a name and unique identification. And then we have the rules section, which tells the system what to do with all these questions. You can ask a question, and you have route instructions like, “if the sex is female then ask the question about children.” We also have checks in this rules part, like if marital … no, actually there aren’t any checks in this particular piece of questionnaire. But there are different types of routing instructions here that allow you, in a more structured way, to indicate what question has to be answered under which condition.
Now you see that routing instructions can be very different in CASES and in Blaise. But there are also other systems in the world, and we have even seen hybrid systems that support both GOTO-type and IF-THEN-ELSE-like instructions, which makes things even more complicated, at least if you are looking at that from the routing logic point of view.
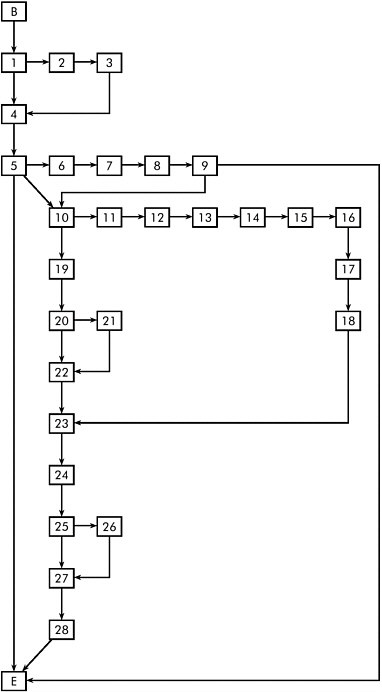
But, in the end, it’s true that the routing structure is a graph, as was already mentioned just a moment ago, and the vertices are the various types of questionnaire objects you have, and the edges are the possible transitions—possible moves—from one part of the questionnaire to the other. It’s not a general type of graph, a questionnaire routing graph … there are some limitations. It’s an acyclic graph; it is not—at least I think it should not—be possible to be able to really jump back in your questionnaire, and making loops in your questionnaire. That would lead to a very long interview, I think. It’s a directed graph, so the flow is from the top to the bottom; you never go up again, it’s always going down. There’s one start vertex, the beginning of the questionnaire, but there are multiple ways out; you can exit the questionnaire at many points, depending on whether conditions are satisfied. It’s a connected graph; each point can be reached from the beginning—I hope—and each path isapossibleroute.
Well, I said, “I hope”—I think this is one of the problems that comes up when complex questionnaires are designed, that it is not always completely clear whether each point can be reached from the beginning of the graph. The logic can be so complex, and conditions determining the routing through the graph may contradict each other. So I think it would be very important to have [a tool] in the analysis, in the development stage of a questionnaire that would allow you to detect whether there are
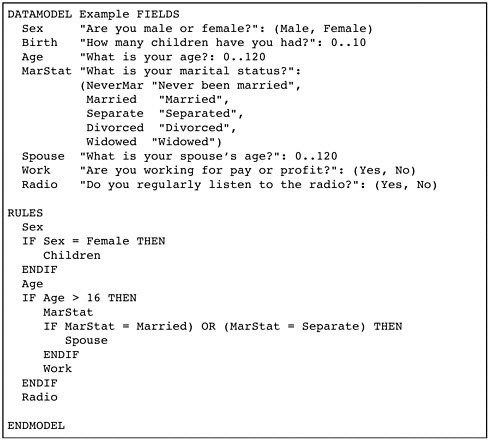
Figure II-9 Portion of a sample questionnaire, as it might be represented in Blaise.
[any] points that you can not reach. It would help you greatly, I think, simplify your questionnaires by getting rid of those things. Or, maybe, it would point out an error in the graph that you could fix.
What would such a graph look like? Well, this is a simple example of a small part of our Labour Force Survey. [SeeFigure II-10.]Andit shows you also that all these different paths can have great variation in length. For example, here, if you are lucky, by choosing the “right” answer [at node 5 or 9] you can skip a lot of questions and you can go to the end immediately. And if you are so unlucky that you go this way, then you have to answer a lot of questions. But it helps also, of course, in organizing the fieldwork; people would like to have some impression of how long taking the questionnaire interview could take. And then, here, you could see that it could be very short or very long.
But this is only limited information; it gives you a global overview of the graph. Of course, you would like to see a little more than this; then, you could think about making a flowchart. Well, everybody knows what a flowchart looks like; the green boxes indicate questions, and these diamonds indicate decision points where you can go to different parts of the questionnaire depending on the condition, whether or not it is satisfied. This can be very illustrative but, on the other hand, also here, information is limited. You can only see the name of the question, and in a very short way the condition that should be satisfied. There is not much more room here to add more information there.
These are some thoughts that we had at the beginning: what shall we do? Do we want textual documentation, like Tom showed? Or do we need graphical information? What do we need? This was the reason this TADEQ project was set up. It was, of course, a European project, set up and funded in part by the European Union.27 Some of the objectives were that—of course—when you make a tool, it should work in such a way that documentation is automatically generated. You should try to get into a situation where people don’t have to do a lot by hand; it takes too long, is costly, is error-prone, etc., etc., etc. You try to design the package—the tool—in such a way so that it would be open for many different systems. So we tried to design an open tool, that is not meant for Blaise only but for any package that can support the language we designed for this tool. Also, we realized that there are different types of documentation necessary, probably, for different types of users—and there are lots of types of users—who need different kinds of information. We had the impression that the users might need both textual and graphic information—that one is not enough and that you need the other. And we were wondering what the users really want: documentation on paper or electronic documentation? Is it sufficient—we hope, at least—to just have electronic documentation, to give them the graphs [and] the hypertext documents, and would that be sufficient?
In order to find out what the users really wanted, we set up this project. And let me just mention the partners in this project: Statistics Netherlands, Office of National Statistics in London, Statistics Finland, National Statistics Institute of Portugal. And another thing about this project was that we had a university in it which was very experienced in computer science, in graph drawing algorithms—something we were not very experienced in. But [it was] nice to work together with someone
from a totally different type of activity; that helped us to do this work. And, indeed, when we contacted these people, they shouted at us that they had already done a lot of work with this that would be very useful for us, but they didn’t know. [They argued] that they had a problem but not an application, and we had an application but not the theory behind it. And they have already found out how to do it. So, it was a nice marriage, you could say.
But what we tried to do in this project was find out what the users really needed. We had a look at some of the CAI packages; we tried to design some sort of neutral language for specifying what’s going on in the questionnaire instrument. And, in the first prototype, we implemented some documentation functions and, in the second prototype, we introduced some analysis functions. What we found out in our user requirements survey—a survey in which about 100 users of CAI systems were involved—it was clear that different users required different types of documentation. There are a bunch of different types of users—the developers, the managers, the supervisors, the interviewers themselves in the field—[and] all need documentation. And the analysts using the data later on. And they made clear to us that they need both paper and electronic documentation. For example, an interviewer in the field with the laptop, they say that they want documentation on paper because they can not do the interview on the laptop and consult the electronic documentation at the same time. So they want something on paper that they can use if they need it.
There was a need for detailed information about the questions—well, that’s obvious, of course. But it was also was important that, for every question, it would be clear what the answer universe was. That’s how we defined it: what kind of people are answering this question? What is the sub-group of people, [and] what are the conditions leading to this question? And there was a need for detailed information about the routing structure, and there was—not that heavily expressed—but some need for tools to analyze the routing structure.
OK, we looked at some different CAI software but the results were not too dramatic, I think. Mainly we see two types of packages—the IF-THEN-ELSE-oriented packages and the GOTO-oriented packages—and some with the hybrid approach using both. Blaise is IF-THEN-ELSE, CASES GOTO-oriented. We wanted to look at some other packages, but they suddenly disappeared from the market, so … it was hard to have a look at them.
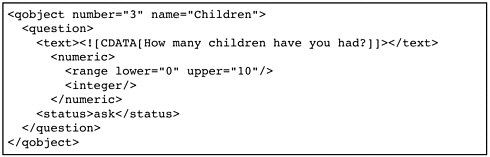
Figure II-11 Sample question, as coded in the Questionnaire Definition Language used in the TADEQ project.
And then we decided, after looking at some of these packages to design this XML-based specification of the questionnaire instrument.28 Why XML? Well, I don’t know; I think it’s an obvious development. At the moment, if you look around, wherever you want to do something with metadata—[to] say something about data—XML is an obvious instrument to do that. I mentioned some other initiatives that also have the idea to do something with XML to specify the metadata structure. So I’ll skip over some of those things.
To give you a quick overview—how is a questionnaire defined in QDL, the Questionnaire Definition Language? [SeeFigure II-11.] There are questionnaire objects, and in this case, it’s a question; it has a text. It could have many texts in different languages. It’s a numeric question, so it has a lower bound and an upper bound. It’s an integer answer, etc., etc. And you could have special items, like this question is asked, or it’s computed, or so forth. This is a limited example.
This is how the routing structure is defined in the Questionnaire Definition Language. [SeeFigure II-12.] You have a questionnaire object called split; it has a condition, sex is female. So the jump is only carried out if the sex is female. And if this condition is true, this part of the questionnaire is carried out, and if it’s not, the if_false part is carried out. There is no if_false part specified here so it’s skipped in this case, just to keep it simple.
You also see, generated, is a list of all questions involved in these conditions, which may help in the analysis—which questions determine the routing in the questionnaire, [and] which are involved in the checking of the answers? These are the more important questions. It’s all based on a Data Type Definition (DTD) in XML, which in fact turned out to
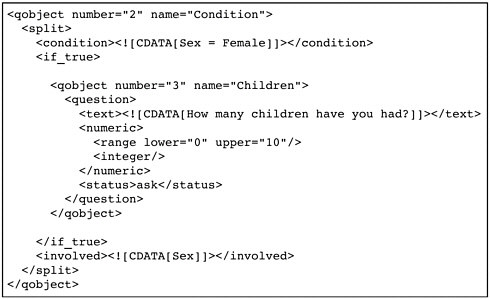
Figure II-12 Sample route instruction, as coded in the Questionnaire Definition Language (QDL) used in the TADEQ project.
be very simple—one page, just to give you a quick look. A questionnaire consists of specification for a number of languages, descriptions, some attributes, definition of local variables, and then one or more questionnaire objects.
And what’s a questionnaire object? A questionnaire object can be a question, split, computation, check, loop, statement, GOTO, or a sub-questionnaire. And what’s a question? Well, a question can be closed, numeric, open-end, various types of questions. And below here you see that a closed question consists of a number of items, and every item has a code and a text, etc., etc. So, this is a way you can quickly define the structure.
So this was the starting point, for the input to the TADEQ tool. Once you have your questionnaire specification in the XML structure, TADEQ can read it and it then has three elements. It has a structure tree; that gives you a schematic overview of the questionnaire. You can use it to navigate through your questionnaire—to open branches, to close branches, to open sub-questionnaires, to close sub-questionnaires. You can select parts of this structure tree, and then for these selected parts you can have a look on the question documentation that’s really focused on the question definitions. It’s a textual documentation. We also spec-
ify the universe for each question. So there’s unlimited information on the route of a questionnaire.
On the other hand, you can choose the graphical documentation on selected parts by choosing another option, and then the focus is more on the routing structure and less on all the details of the questionnaire.
So this is more or less the same diagram as Tom Piazza showed; this is what we intend to do. The TADEQ tool as built is completely separate from the Blaise system. What we have now is that the Blaise system generates the XML file that is then read into TADEQ. And any system that can generate an XML file—in the proper data definition structure—can be input into TADEQ. And then TADEQ produces a tree view, and you can either go for text or the graphical overview to have your documentation.
This is a quick look at the structure tree. [SeeFigure II-13.]It’slike the tree you have when you’re looking at Windows Explorer; it’s a familiar metaphor, I think, for when you’re looking at a questionnaire. This is the questionnaire in a kind of collapsed state, you could say.29 Blaise is a modular language, which has questionnaires, sub-questionnaires, sub-sub-questionnaires. And these squares denote sub-questionnaires. So what you see here is the questionnaire at the main level. And I think these are important things if you develop large questionnaires—to get a global overview of the questionnaire. So “person” here doesn’t mean a single question named “person,” but a whole block of questions about the person. There’s a whole block about work conditions; there’s a block about school; there’s a block about travel, etc., etc. This is the main view of the questionnaire, and by simply clicking on the icons, you can unfold these three—maybe not all of it at the same time—but you can focusinontheblockyouwanttostudyortakealookat. Thisisthe view completely unfolded, and you see all single questions here; you see text, computations, checks, all sorts of things. And the routing structures connect them, saying which question you have to go to.
This is mainly the part of the system you use to navigate, to go to a certain part of the questionnaire. But, at least, we’ve found out that many people like this part of it; you can print this, and it gives you a good overview of the questionnaire.
If you generate textual documentation from this tree, it’s [in] HTML format, generated as an HTML format for a selected part of the questionnaire. It has the text of the question [and] some status information; for the closed questions, it mentions all of the possible answers. And also—but not on this screen—it would also show special answers like
|
29 |
For sake of brevity, the screen shot in Figure II-13 jumps ahead to the fully-unfolded questionnaire Dr. Bethlehem refers to later in the paragraph. |
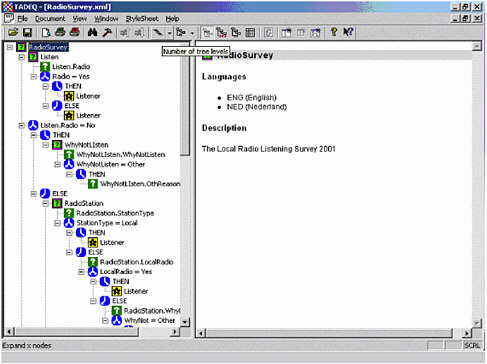
Figure II-13 Screen shot of TADEQ applied to a sample questionnaire, with some sub-questionnaires unfolded.
“don’t know” or “refuse.” And you also see the answer universe here; this is a very simple one, the condition is age greater than 12. So this question will only be asked of persons 13 years or older. It’s an HTML file, and the layout is controlled by cascading style sheets, so if you want a different layout you can just create your own format.
This is part of the graphical documentation. Here, again, the main overview corresponds to the main tree overview. So the green blocks are the sub-questionnaires, and the blue symbols indicate decision points in the routing structure. It’s interactive; you can click on the blocks and they will unfold. And this is what you’ll get if you unfold the complete questionnaire for this example. You can, of course, zoom in and out if you can’t read it.
And there’s one other thing: that this information you have can be displayed in two modes. One mode is what we call the “techno” mode; [in that case,] you get the mathematical expressions, the question names. So it’s fairly compact but for the designer of the instrument maybe more illustrative. Or you can choose the “textual” mode, and then you get the
complete text of the questions in these blocks. And there’s more textual information there, which may be easier to read for those people who are not really into designing the instrument but just want to know what this question is all about.
You can see that the amount of space you have is limited, so you can not do everything. But the system has the option that allows you to open an extra window on the screen, and when you click on it, then you get all the information about one specific object, if you want it.
And now the analysis elements—well, “analysis” may be a big word for this but it turns out to be quite useful. This is just a frequency distribution of the types of questions you have, the number of checks, the number of computations, number of splitting points, number of sub-questionnaires. There’s a frequency distribution.
This may be a little bit more important. This gives you information with respect to questions and in which types of checks or computations they are involved. So, for example, the question marital status is involved in one check, so it’s used in one check, so it might be a more important question than some other questions. And, also, the distance to work is involved in a check. Question age is involved in three split points, so if question age is answered wrong, then you know that things could go wrong elsewhere in the questionnaire.
This is what we were talking about a while ago; this is the length of the path through the questionnaire. [SeeFigure II-14 for a sample of the route statistics.] There is usually a large number of different paths through the questionnaire. And when we use this tool for real-time, real-life surveys, then usually the total number of possible paths is so big that formatting it in a normal programming language is impossible. It’s amazing, if you look at the large numbers that appear there, for maybe even moderate questionnaires.
How many different paths are possible through a questionnaire? Well, this is a very simple questionnaire; there are paths with four questions, there are paths with thirteen questions. And the median is somewhere here, nine questions, and there are 74 paths with length nine questions.30 If you see these large numbers sometimes, you think, “Is this really what we wanted to do when we designed this survey questionnaire? And how about the poor statistician who has to analyze the data later on?” [laughter]
OK, there are some things that are still in the process of being developed, that are not yet ready. We can count the number of paths, we
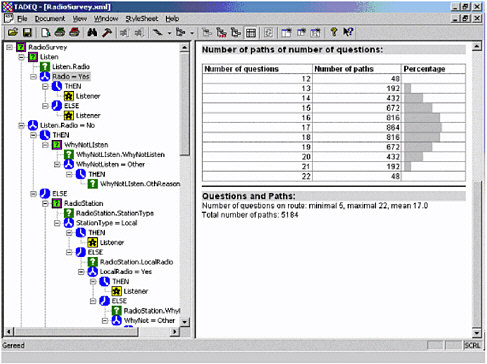
Figure II-14 Screen shot of some route statistics generated by TADEQ for a sample questionnaire.
can compute the length of the paths. And what we also want to do is to do a weighted computation—assign weights to each questionnaire object and then do the weighted distribution of the lengths of the paths. This is important because if you have some kind of simple model capable of assigning to every object how much time it takes to execute—to ask the question—then you would have a distribution of the possible length of the questionnaire interviews. That would be useful in the field; that is what people always ask for.
Because we have the questionnaire instrument now in a convenient format, the XML tree, it also has become possible to compare various questionnaire instruments. That was not really the objective of the project but came out as a sort of side-product, but it is a very useful side-product. So you can feed two questionnaires to the tool, you can compare them, and it will try to find the inconsistencies between the two. And it indicates inconsistencies between the two instruments with different colors. For example, here’s a check on marital status; it’s red, and that means it’s not here. There’s a green one here, and it means it’s
not there. And the yellow one—distance to school—is in both, but the texts, the contents are different, one word different from there. This is a very easy tool to compare, for example, instruments for two consecutive years, or something, and you want to know the changes made in the two instruments very quickly.
So, some of the conclusions … how much time do I have, Dan?
CORK: Keeping with equal time, you have about fifteen minutes.
BETHLEHEM: Fifteen? OK, so I’ll continue.
We think that this type of tool could fulfill a need for electronic questionnaire documentation. I also have to stress that this is now a prototype; it has to be developed further. But when we are playing with it, we have the feeling that it can help. And we also feel that we have to do something because hand-made documentation is out of the question. I have seen examples of that—thick books for the Labour Force Survey, hundreds of pages of documentation that took three months to prepare. And then we had the next version of the instrument and it was out of date. And also a lot of errors in it.
Because we have something like this we think that it will help promote standardization of questionnaire documentation, through your organization and even between organizations. It could even—as Tom [Piazza] also indicated—get to different output, documentation output for different systems. And, of course, we have the feeling that the analysis tools improve the quality of the data collection instrument because it helps you to find things wrong when you are designing it. But, not all problems are solved yet in this prototype.
To mention some more things … If you have a GOTO-oriented questionnaire and you want to compute the distribution of the path lengths, you might be in for some trouble, I think. It is a very complicated thing to do if you can jump back and forth through a questionnaire, and even more so if you have the combination of IF-THEN-ELSE and GOTO, where you can use GOTO to jump in and out of IF-THEN-ELSE branches. It’s, I think, impossible and I think people should forbid it. [laughter]
Weighted analysis of path lengths can also be a very time-consuming task if you have to go through all possible combinations and do a weighted calculation. There should be ways to do something about it; we are now experimenting with sampling the routing graph, and we have the feeling that that might help in some way to get more or less the same results.
Detection of impossible routes could be very important in the design phase of the questionnaire. At this stage, we’re not capable of doing this in the TADEQ prototype, because what does that mean? It means that you have to go through the graph and—everywhere you encounter
a logical condition [or] expression—you have to evaluate it and go to the next condition, and compare the results from this next condition with the previous conditions. And you get a stack of conditions, and [when] you want to know more about that, you have to write some kind of expression parser. And [at that point] you are almost rebuilding your computer-assisted interviewing system. And we didn’t want to do that. And moreover these conditions can be very complicated and could even depend on things not in your questionnaire—for example, on the data set of another questionnaire, or a random number generator, or whatever. So you don’t have complete control over all these expressions. I think it could be done, to some extent, but you would have to think about the best way to do it.
What we’d like to do is the following. Once you have this graph and can draw the graph, you could take the dataset you collected and push that through the graph, and try to visualize the flow of data through your graph by, say, having thicker lines for paths that are followed more often than other paths. The thickness of the lines could indicate how frequently paths go through that part of the questionnaire. And that may also help you detect paths that are never taken through the questionnaire and make you wonder. But it can only be done after you have done the field work or maybe you have collected some test data.
There was some discussion about text fills, and that’s another important point of questionnaire instrument documentation. I have seen questionnaires where questions consist completely of text fills; [laughter] there was no question text at all, and all question text was derived from databases elsewhere, depending on certain conditions. But, how to document this? What we have done is to take the approach, more or less, of saying that every object has its own peculiarities but also every object should have some label, we call it [a] description—whether it’s a question or a condition or a check. There should be a descriptive label somewhere. And you can choose everywhere in your tool to display the descriptive label instead of the question text, or the logical expression. So that gives you a way out—maybe not a very elegant way out, but an easy way out—of documenting the text fills. But [implementing] that remains a difficult problem.
What we also do not have in TADEQ is the screens. Some people say that the screens that the interviewers see should be part of the documentation. So maybe it should be possible to click on a question and get the screen of the laptop computer, a copy of that screen on display. Well, it could be included; we didn’t do it. On the other hand, we thought that the text screens are there [but] the screen display for every interviewer might not be the same. [You] could have many different screen displays, and what to do with that?
Another interesting thing is that—once you have this interactive system—that allows you to play with a questionnaire in interactive ways. The next step could possibly be to use it to design questionnaires. Why not build an integrated development environment that allows you to just put your objects on the screen—“this is a question, connected to this condition,” etc.—and just build up a questionnaire in a graphical way? I think it could be done, but it would take some time.
And then one final point is that in TADEQ we concentrate on the documentation of the questionnaire instrument; we do not concentrate on the documentation of the final data set. Tom [Piazza] mentioned that also. Now sometimes there are two different kinds of documentation. If I go to the data archive and ask for the survey data file, I get documentation—in XML—but it’s not related at all to my questionnaire instrument documentation. But it’s also in XML, and TADEQ is in XML, so you wonder whether it should at all be possible, in some way or another, to combine that in some way—to completely integrate it, or to make links, or whatever. And it should be done, I think, in the future, too.
So, how much time do I have left?
CORK: We have a few minutes left for questions if we want to do that. And, in particular, if anyone wants to ask questions central to his slides, ask those first because we’ve got to make another technology switch up here at the podium.
PARTICIPANT: A clarifying point … What if you have [a] GUI instrument that is really a pen-based kind of thing—where it’s totally interviewer-directed in terms of what modules or what I’m going to do now—but there are no predefined paths at all? Will this work, and you could actually then see what the paths are, what paths the interviewers are really taking people on?
BETHLEHEM: Well, I don’t know, and I can’t really give an answer to that question because we don’t have that kind of thing in our organization. On the other hand, I could say that if you can get it in our XML file we will document it for you! [laughter] The functionality of the XML language is sufficient for your application; it can be done. But maybe it isn’t. Then you should have to describe somewhere how decisions are taken, and you have to document that in some way or another. Maybe, in textual form, you could do that.
PARTICIPANT: Is there a plan to make this a production-level software?
BETHLEHEM: Yes. The aim of the project was to develop a prototype, and that is what we did. And we will put it on the Web and—in a few weeks’ time—everybody can just grab it from the Web and play with it. And if you want to attach your own system to it, and you get
the definition of the XML language, you can make your own interface to it. There are plans to incorporate it in the Blaise system; that is one thing. But if someone else says, “I want to incorporate it in CASES,” or whatever, then they can [adapt it as well]. This was really the meaning of the project, to present something to the community and they can work from there, to see if they can do something with it. [Inaudible reply from participant.]
MARKOSIAN: Have you considered using a proper development platform and open-sourcing it? Because it sounds like there’s a large enough community around the world that would want to contribute.
BETHLEHEM: Yes, we have had some contacts, but not to a level that we’ve started a cooperation. But we are open for that. Because, well, one thing about XML is that everyone says it allows you to make new standards. And, that’s what everybody does—makes their own new standard. [laughter] And that’s not good, I think. On the other hand, if you have different XML standards it would probably not be too difficult to get from one XML to the other definition.
MARKOSIAN: I wasn’t referring specifically to the XML standard but rather just to encourage people to … by having an open-source collaborative development you can encourage a lot of development in the end product.
BETHLEHEM: Well, we learned about this in the course of this project. And we are open to that; it’s not a problem at all. But there’s no concrete thing to mention at this moment.
PARTICIPANT: How well does it work? And how do you decide that it’s working well?
BETHLEHEM: Well, I don’t decide it, you decide it. [laughter] I think if you have very, very, very, very large questionnaires then it might turn out to be a little bit slow now and then, to generate the graph and this kind of thing. But that’s not something you’re doing every five minutes. So I don’t think that’s a real problem. Also, I think that the type of files that are generated—for example, if you have a 40,000-item questionnaire in Blaise and you generate the XML, it might be rather long, a big file. But it works; it works.
PARTICIPANT: In terms of accuracy, is it possible for me to write a program to see that it’s parsed correctly, you know what I mean? Will it go through a Blaise program accurately, do a representation, 100 percent of the time? Or get 95 percent of it right? Or, what’s your feeling?
BETHLEHEM: If you generate it from Blaise, the XML file—which you can do, if you know Blaise—then it will be an exact copy of the Blaise program. One remark to be made is that not every object in Blaise is represented in the XML; if you have very special things like coding questions or calls to an external file, that is more handled like a


