
2
Interior and Crustal Structure and Activity
PRESENT STATE OF KNOWLEDGE
Major advances in our understanding of the interior and crustal structure of Mars have come recently in four important areas:
-
The bulk composition of Mars is better constrained as a result of the vastly improved estimate of the moment of inertia, made possible by Pathfinder measurements.1
-
Mars had a magnetic field in the past, but there is no present global field, as shown by high-amplitude magnetic anomalies detected in the southern highlands of Mars by the Mars Global Surveyor (MGS).2
-
An impact origin for the hemispheric dichotomy between the northern and southern hemispheres of Mars appears to be ruled out by topography and gravity data from MGS.3
-
Links between a warm, wet climatic period and the formation of the gigantic Tharsis Plateau are suggested by the MGS topography and gravity data.4
Before targets for future inquiry are described, these four subjects are discussed briefly.
Bulk Composition
Constraining Mars’s bulk composition is an excellent way to improve our insight into processes of planet formation in the solar system.5 The composition of a planet is constrained by measurements of its mean density (well determined for the inner planets), the moment-of-inertia factor,a the seismic velocity structure, and from the composition of partial melts (now rocks) extruded from the interior. The moment of inertia depends on the distribution of density within a planet, and only a limited range of rock compositions have a given density.
Before the Mars Pathfinder mission in 1996, the moment of inertia was known with certainty only for Earth and the Moon. The large uncertainty previously associated with the moment of inertia of Mars, due to an uncertainty in the spin pole precession rate, left room for a range of feasible bulk composition models. Folkner and
colleagues calculated a value of 0.3662 ± 0.0017 for the moment-of-inertia factor, based on an improved estimate of the martian spin pole precession rate determined from Doppler range measurements to the Mars Pathfinder and Viking landers.6
Any compositional model of Mars must account for its low mean density and high moment-of-inertia factor compared with those of Earth. Uncompressed density is a more relevant indicator of planetary composition, but this is necessarily uncertain because of a lack of knowledge of temperatures in the planet and material properties at high pressure. The ranges of estimated uncompressed densities are 3.8 to 3.9 g/cm3 for Mars and 4.4 to 4.5 g/cm3 for Earth.7 The moment-of-inertia factor measured for Earth is 0.3315.8 The difference in moment-of-inertia factors indicates that the concentration of mass toward the center of Mars is less than that of Earth. Earth’s core size is well determined from seismic studies; thus, the measured moment-of-inertia factor for Earth directly constrains the ratio of the core density to the mantle density. However, on Mars the core size is still a free parameter. As shown in Figure 2.1, the moment-of-inertia factor and bulk density constraints allow a wide range of possible core sizes, with an attendant range of core and mantle compositions.
Two factors are thought to be responsible for the lower mean density of Mars compared with that of Earth.9 Mars has an Fe/Si ratio smaller than that of Earth, and it is somewhat enriched in oxygen. The additional O is chiefly in the mantle, associated with Fe2+ that would otherwise occur as Fe0 in the core. A smaller or lighter core alone would not account completely for the higher moment-of-inertia factor of Mars: It is also necessary that the average density of Mars’s mantle be greater than that of Earth’s mantle. No unique density can be specified by the geophysical constraints, however, since this value depends on assumptions of crustal thickness and core size. The
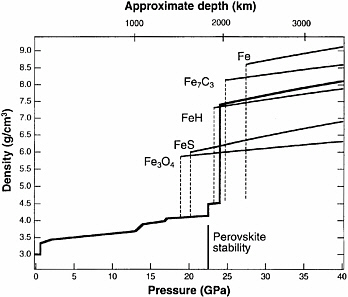
FIGURE 2.1 Density profiles for a range of model core compositions (solid lines). For each core composition, the thickness of the low-density crust is adjusted to give the correct mean density and moment of inertia for Mars. Dashed lines indicate the depth, or pressure, of the core/mantle boundary for model core compositions. The crust-mantle-and-core profile shown (heavy line) assumes a 50-km, 3.0-g/cm3 crust. SOURCE: Reprinted with permission from C.M. Bertka and Y. Fei, “Implications of Mars Pathfinder Data for the Accretion History of the Terrestrial Planets,” Science 281:1838–1840, 1998. Copyright 1998 by the American Association for the Advancement of Science.
upper and lower bounds for mantle density are about 3.45 and 3.55 g/cm3.10,11,12 The uncompressed density of material likely to be in Earth’s upper mantle is about 3.34 g/cm3.13
Given that Mars must contain less Fe and more O than do the planets closer to the Sun, there are several ways to accomplish this within reasonable cosmochemical frameworks.14,15 The Equilibrium Condensation Model assumes that the temperatures and pressures in the zone of accretion of Mars were low enough to promote condensation of a different suite of minerals there than in the zones of the other terrestrial planets.16 Low temperature would allow more complete reaction of S with Fe to form FeS, affecting core density; and more Fe would oxidize and form ferrous silicates, resulting in an increased mantle density. Ringwood and Clark have assumed that Mars, Earth, and Venus have the same abundances of the common metals Fe, Mg, Si, and Al, but differing amounts of O.17
Zones of Strong Crustal Magnetization and No Global Field
During the aerobraking phase of the MGS mission the orbiter flew below the martian ionosphere and the onboard magnetometer detected regions with very-high-amplitude magnetic anomalies.18 The short (~100-km) wavelength of these anomalies implies that the source of the field is confined to the top several tens of kilometers of the crust. The estimated crustal magnetizations are in the range of 10 to 30 A/m, an order of magnitude stronger than magnetizations typically encountered for Earth rocks.19 Over much of the planet, the pattern of the anomalies is blocky or mottled. The field seen in parts of the highlands is consistent with a crustal magnetization model made up of multiple quasi-parallel linear features with dimensions ~200 km in width, extending as far as 2000 km in length. Some workers interpret these highland areas as remnants of early “oceanic crust,” reworked in places by subsequent major impacts and thermal events, but preserving elsewhere the magnetic imprint acquired when the crust formed by “sea floor spreading.”20 Others consider that dike intrusions produced the magnetization patterns.21
Measurements made early in the MGS mission established unambiguously that Mars does not currently possess a significant global magnetic field, the estimated upper limit for a Mars dipole moment being ~2 × 10¹⁸ A m2.22 The absence of crustal magnetism near large impact basins such as Hellas and Argyre implies cessation of internal dynamo action during the early Noachian epoch (~4 billion years ago).
Crustal Thickness and the Hemispheric Age Dichotomy
The northern hemisphere of Mars is far smoother and less cratered than is the southern hemisphere, and the northern hemisphere is about 5 km lower in elevation than the south.23 Ideas for the origin of the dichotomy range from impact thinning of the crust24,25 to formation of thin basaltic crust in some form of plate tectonics early in Mars’s history.26,27 The smoothness of the lowland surface is attributed to either volcanic or sedimentary infilling. The great number of erosional channels linking the highlands to the lowlands favors sedimentary infill.28
The topography and gravity data acquired with the Mars Global Surveyor spacecraft have allowed estimation of the range of variability of crustal thickness over the planet.29 Crustal thickness variations are fairly smooth across the dichotomy boundary (see Figure 2.2); thus, an impact origin for the lowlands is not favored. The crust thickness results are not inconsistent with the plate tectonic hypothesis but certainly do not confirm that idea.
The gravity and topography analysis also allows estimates of a lower limit for the average crustal thickness, for the case in which the crust is assumed to approach zero thickness at its thinnest point. This yields an estimate of 50 km as the minimum average crustal thickness over the planet.30 Studies of the geochemistry of martian meteorites suggest that the amount of crustal material differentiated from the mantle would produce a crust thicker than 100 km.31 Geophysical upper bounds on the crustal thickness are less well defined, since they depend on arguments about the temperature-dependent flow strength of the crust and the temperature of the lower crust. Basically, the thicker the crust, the hotter and therefore weaker is the lower crust. Assuming a temperature gradient and crustal thickness, the temperature can be estimated, and from it the strength of the lower crust. If the lower crust is too hot, it would be expected to flow and in so doing to obliterate differences in topography. The fact that the southern hemisphere is about 5 km higher than the northern hemisphere indicates that the crust is too cold to
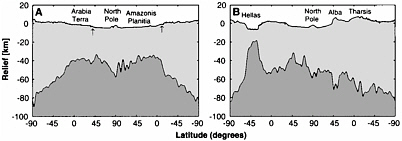
FIGURE 2.2 Circum-Mars profiles of crustal thickness along longitude lines of (A) 0° to 180° E and (B) 70° to 250° E. Light gray represents crust, and dark gray represents mantle. In the figures, the south pole is at both ends of the plot, the north pole is at the center, and the lower-longitude profiles (0° E and 70° E) are on the left sides of the plots. Apparent crustal thickening beneath the north and south polar regions is an artifact of the assumption that layered terrains and ice caps are composed of material with the same density as the crust rather than of less dense ice plus dust. The arrows in (A) show the location of the hemispheric dichotomy boundary. The vertical exaggeration is 30:1. SOURCE: Reprinted with permission from M.T. Zuber, S.C. Solomon, R.J. Phillips, D.E. Smith, G.L. Tyler, O. Aharonson, G. Balmino, W.B. Banerdt, J.W. Head, C.L. Johnson, F.G. Lemoine, P.J. McGovern, G.A. Neumann, D.D. Rowlands, and S.J. Zhong, “Internal Structure and Early Thermal Evolution of Mars from Mars Global Surveyor Topography and Gravity,” Science 287:1788–1793, 2000. Copyright 2000 by the American Association for the Advancement of Science.
flow now and was too cold to flow when the hemisphere difference was created. If the interior had been extremely hot at the time of formation of the large impact basins, such as Hellas, then the topographic relief of those features would not have been preserved.32
Climate, Lithosphere, Volcanoes, and Support of the Tharsis Plateau
The high-elevation Tharsis region is the main area where tectonic faults and volcanoes are exposed. The surface of the region is young because of volcanic resurfacing, although there are no absolute dates on the age of those volcanoes. Evidence of very recent Tharsis volcanism is indirect and comes from basaltic meteorites from Mars, the shergottites, which have igneous crystallization ages of ~180 million years.33 Small offset faults appear to be related to lithospheric bending in response to the loading of huge volcanoes. Normal faults also parallel the huge Valles Marineris canyon system, lending weight to the idea that this is a rift.
Two different mechanisms have been proposed to explain the long-wavelength gravity anomalies associated with the Tharsis Rise. First, the gravity anomalies are explained as a result of the load of Tharsis volcanic rocks on an ~100-km-thick elastic lithosphere with insignificant contribution from the deep interior.34,35 Second, the gravity and topography of the Tharsis Rise are interpreted as dynamic effects of mantle convection.36
A key insight from the MGS topographic data is that the plateau predates the formation of apparently fluvial channels. This suggests that the outpouring of lava to make the plateau may have released enough carbon dioxide to form an insulating atmosphere and sufficient water to form the channels and even an ocean. Tharsis loading amounts to ~3 × 10⁸ km3 of igneous material, which is equivalent to a 2-km-thick global layer. Assuming that the Tharsis magmas have a volatile content similar to that of Hawaiian basalts, the total release of gases from Tharsis magmas could produce the integrated equivalent of a 1.5-bar CO2 atmosphere and a 120-m-thick global layer of water.37 These quantities of volatiles may have been sufficient to warm the atmosphere to the point at which liquid water is stable at the surface, which could explain the evidence for water-cut channels around Mars.38 This is a particularly clear example of how integrating basic geophysical and geological measurements has led to inferences about the past climate of the planet.
NEAR-TERM OPPORTUNITIES
Two near-term launch opportunities would address high-priority scientific objectives relating to the structure of Mars. The Mars Reconnaissance Orbiter, intended for a 2005 launch, is to include gravity mapping at a higher resolution than has been done by MGS. This will allow improved estimates of the near-surface density and crustal thickness variations. Combined analysis of higher-resolution gravity and MOLA (Mars Orbiter Laser Altimeter on MGS) topography will lead to better estimates of the lithospheric thickness under volcanoes, rifts, and craters. If the crustal thickness in a few places can be determined seismically, then the gravity data can be used to quantify the crustal thickness relative to those places.
A passive seismic experiment that might determine crustal thickness in one place is in the advanced planning stage: the NetLander project, planned and supported by several national space agencies in Europe—including those of France, Germany, Finland, and Italy—with some U.S. participation, is envisioned to include four broad-band seismic stations. Though this planned experiment involves a minimal number of stations, it may accomplish several important goals, including constraining the size and state of the core, and determining the level of tectonic activity and the rate of meteroid impacts. This is an excellent start to the exploration of Mars’s interior, and COMPLEX encourages NASA to support this and more comprehensive future seismic experiments.
RECOMMENDED SCIENTIFIC PRIORITIES
Virtually everything about Mars, including its surface composition, topographic relief, and even its atmosphere, has its origin in processes of the planet’s interior. Thus, many kinds of studies would shed light on the composition and evolution of the interior. For example, multispectral analysis from orbit will help constrain the composition of surface rocks and so give a better idea of the kind of interior from which the rocks came. Clearly, analysis of returned rock samples will improve our knowledge of the source region of those rocks in the same way that samples from the Moon did. Age-dating of rocks on the surface could indicate when the major tectonic features of the planet formed and so constrain its thermal evolution. Since each of these types of measurement is central to objectives discussed in later chapters of this report, they are not addressed further in this section—which instead focuses on geophysical measurements that are crucial to major advances in our knowledge of the interior of Mars. Among the types of measurements to address scientific objectives listed below, the passive seismic experiment has by far the highest priority.
Deep Internal Structure
The most direct way to constrain the deep structure of Mars is by use of seismic waves generated by activity within the planet and detected by an array of seismometers distributed across the planet’s surface (Appendix B: [1.11]).
There are several clear and compelling reasons for deploying an array of broadband seismometers on Mars. First, seismic data can determine the size of the core (Appendix B: [11.1.7, 3.1]). When the size of the core is known, there can be much tighter constraints on the bulk composition of the planet. Information on the seismic velocities in the mantle will also constrain its composition. This will provide the best measure of the composition of a terrestrial planet outside the Earth-Moon system, and so constrain cosmochemical models for the origin of planetary systems (Appendix B: [1.2, 4.7, 10.1]).
Second, seismology will tell us whether the interior of Mars is active today. If evidence of activity were found, it would generate great interest in further studying a planet that is not dead (Appendix B: [1.11]). As noted above, there is evidence from some Mars meteorites that Mars may have been volcanically active in the geologically recent past.
Third, the question of whether the core is all solid, all liquid, or part solid and part liquid (as is the Earth’s core) has a direct and profound bearing on our understanding of planetary dynamos and the present-day lack of a Mars global magnetic field (e.g., Appendix B: [11.3.5]).39 Several groups have concluded that a passive seismometer experiment could answer these questions, in that there would likely be enough natural sources to generate the
needed seismograms (e.g., Appendix B: [1.11]).40 (The one Viking seismometer that deployed did not detect Mars quakes, but it was not well coupled to the ground and it had a sensitivity as much as four orders of magnitude less than it is possible to use now.41,42) The issue of fluid in the core can also be constrained by tracking the positions of two or more landers for rotational dynamics (Appendix B: [1.12, 4.1]).
Shallow Seismic Structure
One key question is, How thick is the crust of Mars? (Appendix B: [1.12, 3.1, 11.6.3]). With the thickness and velocity profile through the crust determined at several locations, models could be constrained for the origin of the hemispheric dichotomy, thus improving our understanding of the geologic history of Mars. Receiver function analysis of passive seismic stations could constrain the crustal thickness and shallow mantle structure.
Active seismic experiments could elucidate the smaller-scale problems of the structure of the crust and shallow mantle. Local- or regional-scale active experiments could also help determine the thickness and stratigraphy of sedimentary and volcanic units, as well as differentiating between those units. Such experiments require a far higher level of effort to carry out than do passive experiments.
Heat Flow
One of the most basic pieces of knowledge needed is whether the interior of Mars is currently hot enough to flow, melt, and cause tectonic activity (Appendix B: [11.3.5, 11.7.1]). On Earth, hydrothermal activity and associated life forms are concentrated in areas of tectonic and magmatic activity. Is there such activity on Mars? One way to begin to answer this is to carry out heat flow measurements on the surface in a wide range of environments (a form of the geophysical mapping recommended in Appendix B: [1.18]). These measurements will require drilling into the surface to emplace heat flow probes, as was done for the Apollo measurements on the Moon.
Gravity Field
Gravity field measurements on a finer scale than accomplished by MGS can help constrain the subsurface structure of sedimentary basins and variations in crustal thickness (Appendix B: [1.11, 1.18, 11.7.1]). For structures on a scale less than the order of 100 km, such measurements probably cannot be made by an orbiter.
Magnetic Field
There is great interest in the origin of the very strong remnant magnetic anomalies found by MGS and discussed above. To learn more about these features, researchers need to map magnetic anomalies on a finer scale than has been done so far. There are several ways to improve the spatial resolution of the magnetic field maps, including orbiter missions with aerobraking, near-surface measurements (either by rovers or aircraft), and sampling and study of the magnetic properties of rocks. Inclusion of a magnetometer in future orbiter missions using aerobraking would bring the instrument close to parts of the martian surface that were not mapped at periapses (closest approach) during the MGS mission (Appendix B: [3.1, 11.7.1]).
ASSESSMENT OF PRIORITIES IN THE MARS EXPLORATION PROGRAM
The top-priority objectives concerning the interior of Mars are not high priorities in the first 10 years of NASA’s new Mars Exploration Program. The European NetLander mission, which is being planned in conjunction with NASA, does focus on the highest-priority goals, and COMPLEX applauds this effort. There are opportunities for gravity, heat flow, and magnetic measurements on several missions that are expected to fly in the next decade, and COMPLEX believes that they should be pursued. It is critical to understand the structure and
evolution of the planet as a whole in order to understand discoveries relating to distributions of water and conditions that might have allowed life to develop.
Great improvement in our knowledge of the martian interior could come from a passive seismic experiment. There are good reasons, based on terrestrial and lunar experience, to believe that the rate of detectable seismicity on Mars would provide adequate sources for imaging the interior. The impacts of meteoroids would also provide useful seismic signals. Determining the rate, mechanism, and location of seismicity and the rate of meteoroid impacts are high-priority objectives in themselves. Crustal structure in a single area could potentially be constrained with a local network of three stations. Seismic attenuation properties should depend on whether the shallow crust is wet (as on Earth) or dry (as on the Moon). More stations would be needed to locate Mars quakes accurately and to determine the velocity and attenuation structure of the mantle and the size and state of the core. For example, accurate constraints on the size and state of the core would require stations at a wide range of distances from seismic sources. Thus, a phased approach is suggested, with a deployment of four stations to determine the locations of seismic sources and constrain crustal properties, while later experiments would add more stations to focus on the deep interior.
The seismic experiment part of the NetLander mission would take the first step in a phased seismic study of the martian interior. It must, however, be emphasized that seismometers need to operate simultaneously over a period of years to provide constraints on the interior structure. Given the high priority that COMPLEX places on the range of objectives that seismic experiments could accomplish, the committee strongly recommends that NASA support passive seismic experiments.
REFERENCES
1. W.M. Folkner, C.F. Yoder, D.N. Yuan, E.M. Standish, and R.A. Preston, “Interior Structure and Seasonal Mass Redistribution of Mars from Radio Tracking of Mars Pathfinder,”Science278: 1749–1752, 1997.
2. M.H. Acuña, J.E.P. Connerney, N.F. Ness, R.P. Lin, D. Mitchell, C.W. Carlson, J. McFadden, K.A. Anderson, H. Reme, C. Mazelle, D. Vignes, P. Wasilewski, and P. Cloutier, “Global Distribution of Crustal Magnetization Discov-ered by the Mars Global Surveyor MAG/ER Experiment,”Science284: 790–793, 1999.
3. M.T. Zuber, S.C. Solomon, R.J. Phillips, D.E. Smith, G.L. Tyler, O. Aharonson, G. Balmino, W.B. Banerdt, J.W. Head, C.L. Johnson, F.G. Lemoine, P.J. McGovern, G.A. Neumann, D.D. Rowlands, and S.J. Zhong, “Internal Structure and Early Thermal Evolution of Mars from Mars Global Surveyor Topography and Gravity,”Science287: 1788–1793, 2000.
4. R.J. Phillips, M.T. Zuber, S.C. Solomon, M.P. Golombek, B.M. Jakosky, W.B. Banerdt, D.E. Smith, R.M.E. Will-iams, B.M. Hynek, O. Aharonson, and S.A. Hauck, “Ancient Geodynamics and Global-Scale Hydrology on Mars,” Science291: 2587–2591, 2001.
5. See, for example, H. Wänke and G. Dreibus,“Chemical Composition and Accretion History of Terrestrial Planets,”Philosophical Transactions of the Royal Society of LondonA235: 545–557, 1988.
6. W.M. Folkner, C.F. Yoder, D.N. Yuan, E.M. Standish, and R.A. Preston, “Interior Structure and Seasonal Mass Redistribution of Mars from Radio Tracking of Mars Pathfinder,”Science278: 1749–1752, 1997.
7. See, for example, C.M. Bertka, and Y. Fei, “Implications of Mars Pathfinder Data for the Accretion History of the Terrestrial Planets,”Science281: 1838–1840, 1998; C.M. Bertka and Y. Fei,“Density Profile of an SNC Model Martian Interior and the Moment-of-Inertia Factor of Mars,”Earth and Planetary Science Letters157: 79–88, 1998; F. Shol and T. Spohn,“The Interior Structure of Mars: Implications from SNC Meteorites,”Journal of GeophysicalResearch102: 1613–1635, 1997; and D.H. Johnston and M.N. Toksöz, “Internal Structure and Properties of Mars,” Icarus32: 73–84, 1977.
8. H. Moritz, “Fundamental Geodetic Constraints,”Travaux de L’Association Internationale de Géodésie25: 411–418, 1976.
9. C.M. Bertka and Y. Fei,“Implications of Mars Pathfinder Data for the Accretion History of the Terrestrial Planets,”Science281: 1838–1840, 1998.
10. D.H. Johnston and M.N. Toksöz,“Internal Structure and Properties of Mars,”Icarus32: 73–84, 1977.
11. T. McGetchin andJ.R. Smythe, “The Mantle of Mars: Some Possible Geological Implications of its High Density,”Icarus34: 512–536, 1978.
12. C.M. Bertka and Y. Fei,“Density Profile of an SNC Model Martian Interior and the Moment-of-Inertia Factor of Mars,”Earth and Planetary Science Letters157: 79–88, 1998.
13. A.E. Ringwood, Composition and Petrology of the Earth’s Mantle, McGraw-Hill, New York, 1975.
14. E. Anders, “Chemical Processes in the Early Solar System, as Inferred from Meteorites,”Accounts of ChemicalResearch1: 289–298, 1968.
15. J.W. Morgan and E. Anders, “Chemical Composition of Mars,”Geochimica et Cosmochimica Acta43: 1601–1610, 1979.
16. See, for example, S.J. Weidenschilling, “Accretion of Terrestrial Planets. II.,”Icarus27: 161–170, 1976.
17. A.E. Ringwood and S.P. Clark,“Internal Constitution of Mars,”Nature234: 89–92, 1971.
18. M.H. Acuña, J.E.P. Connerney, N.F. Ness, R.P. Lin, D. Mitchell, C.W. Carlson, J. McFadden, K.A. Anderson, H. Reme, C. Mazelle, D. Vignes, P. Wasilewski, and P. Cloutier, “Global Distribution of Crustal Magnetization Discov-ered by the Mars Global Surveyor MAG/ER Experiment,”Science284: 790–793, 1999.
19. J.E.P. Connerney, M.H. Acuña, P.J. Wasilewski, N.F. Ness, H. Reme, C. Mazelle, D. Vignes, R.P. Lin, D.L. Mitchell, and P.A. Cloutier, “Magnetic Lineations in the Ancient Crust of Mars,”Science284: 794–798, 1999.
20. J.E.P. Connerney, M.H. Acuña, P.J. Wasilewski, N.F. Ness, H. Reme, C. Mazelle, D. Vignes, R.P. Lin, D.L. Mitchell, and P.A. Cloutier, “Magnetic Lineations in the Ancient Crust of Mars,”Science284: 794–798, 1999.
21. F. Nimmo, “Dike Intrusion as a Possible Cause of Linear Martian Magnetic Anomalies,”Geology28: 391–394, 2000.
22. M.H. Acuña, J.E.P. Connerney, N.F. Ness, R.P. Lin, D. Mitchell, C.W. Carlson, J. McFadden, K.A. Anderson, H. Reme, C. Mazelle, D. Vignes, P. Wasilewski, and P. Cloutier, “Global Distribution of Crustal Magnetization Discov-ered by the Mars Global Surveyor MAG/ER Experiment,”Science284: 790–793, 1999.
23. See, for example, D.E. Smith, M.T. Zuber, S.C. Solomon, R.J. Phillips, J.W. Head, J.B. Garvin, W.B. Banerdt, D.O. Muhleman, G.H. Pettengill, G.A. Neumann, F.G. Lemoine, J.B. Abshire, O. Aharonson, C.D. Brown, S.A. Hauck, A.B. Ivanov, P.J. McGovern, H.J. Zwally, and T.C. Duxbury, “The Global Topography of Mars and Implications for Surface Evolution,”Science284: 1495–1503, 1999; and H.V. Frey, S.E. Sakimoto, and J. Roark,“The MOLA Topographic Signature at the Crustal Dichotomy Boundary Zone on Mars,”Geophysical Research Letters25: 4409– 4412, 1998.
24. D.E. Wilhelms and S.W. Squyers,“The Martian Hemispheric Dichotomy May Be Due to a Giant Impact,”Nature309: 138–140, 1984.
25. H.V. Frey and R.A. Schultz, “Large Impact Basins and the Mega-Impact Origin for the Crustal Dichotomy on Mars,”Geophysical Research Letters15(3): 229–232, 1988.
26. N. Sleep, “Martian Plate Tectonics,”Journal of Geophysical Research99: 5639–5656, 1994.
27. F. Nimmo, and D. Stevenson,“Influence of Early Plate Tectonics on the Thermal Evolution and Magnetic Fields of Mars,”Journal of Geophysical Research105: 11969–11980, 2000.
28. R.J. Phillips, M.T. Zuber, S.C. Solomon, M.P. Golombek, B.M. Jakosky, W.B. Banerdt, D.E. Smith, R.M.E. Will-iams, B.M. Hynek, O. Aharonson, and S.A. Hauck, “Ancient Geodynamics and Global-Scale Hydrology on Mars,” Science291: 2587–2591, 2001.
29. M.T. Zuber, S.C. Solomon, R.J. Phillips, D.E. Smith, G.L. Tyler, O. Aharonson, G. Balmino, W.B. Banerdt, J.W. Head, C.L. Johnson, F.G. Lemoine, P.J. McGovern, G.A. Neumann, D.D. Rowlands, and S.J. Zhong, “Internal Structure and Early Thermal Evolution of Mars from Mars Global Surveyor Topography and Gravity,”Science287: 1788–1793, 2000.
30. M.T. Zuber, S.C. Solomon, R.J. Phillips, D.E. Smith, G.L. Tyler, O. Aharonson, G. Balmino, W.B. Banerdt, J.W. Head, C.L. Johnson, F.G. Lemoine, P.J. McGovern, G.A. Neumann, D.D. Rowlands, and S.J. Zhong, “Internal Structure and Early Thermal Evolution of Mars from Mars Global Surveyor Topography and Gravity,”Science287: 1788–1793, 2000.
31. See, for example, F. Shol, and T. Spohn,“The Interior Structure of Mars: Implications from SNC Meteorites,”Journal of Geophysical Research102: 1613–1635, 1997.
32. M.T. Zuber, S.C. Solomon, R.J. Phillips, D.E. Smith, G.L. Tyler, O. Aharonson, G. Balmino, W.B. Banerdt, J.W. Head, C.L. Johnson, F.G. Lemoine, P.J. McGovern, G.A. Neumann, D.D. Rowlands, and S.J. Zhong, “Internal Structure and Early Thermal Evolution of Mars from Mars Global Surveyor Topography and Gravity,”Science287: 1788–1793, 2000.
33. L.E. Nyquist, L.E. Borg, and C.-Y. Shih, “The Shergottite Age Paradox and the Relative Probabilities for Martian Meteorites of Differing Ages,”Journal of Geophysical Research103: 31445–31455, 1998.
34. R.J. Willemann and D.L. Turcotte, “The Role of Lithospheric Stress in the Support of the Tharsis Rise,”Journal ofGeophysical Research87: 9793–9801, 1982.
35. R.J. Phillips, M.T. Zuber, S.C. Solomon, M.P. Golombek, B.M. Jakosky, W.B. Banerdt, D.E. Smith, R.M.E. Will-iams, B.M. Hynek, O. Aharonson, and S.A. Hauck, “Ancient Geodynamics and Global-Scale Hydrology on Mars,” Science291: 2587–2591, 2001.
36. W.S. Kiefer, B.G. Bills, and R.S. Nerem,“An Inversion of Gravity and Topography for Mantle and Crustal Structure on Mars,”Journal of Geophysical Research101: 9239–9252, 1996.
37. R.J. Phillips, M.T. Zuber, S.C. Solomon, M.P. Golombek, B.M. Jakosky, W.B. Banerdt, D.E. Smith, R.M.E. Will-iams, B.M. Hynek, O. Aharonson, and S.A. Hauck, “Ancient Geodynamics and Global-Scale Hydrology on Mars,” Science291: 2587–2591, 2001.
38. R.J. Phillips, M.T. Zuber, S.C. Solomon, M.P. Golombek, B.M. Jakosky, W.B. Banerdt, D.E. Smith, R.M.E. Will-iams, B.M. Hynek, O. Aharonson, and S.A. Hauck, “Ancient Geodynamics and Global-Scale Hydrology on Mars,” Science291: 2587–2591, 2001.
39. F. Nimmo and D. Stevenson, “Influence of Early Plate Tectonics on the Thermal Evolution and Magnetic Fields of Mars,”Journal of Geophysical Research105: 11969–11980, 2000.
40. S.C. Solomon, D.L. Anderson, W.B. Banerdt, R.G. Butler, P.M. Davis, F.K. Duennebier, Y. Nakamura, E.A. Okal, and R.J. Phillips, Scientific Rationale and Requirements for a Global Seismic Network on Mars, LPI Technical Report 91-02, Lunar and Planetary Institute, Houston, Texas, 1990.
41. D.L. Anderson, W.F. Miller, G.V. Latham, Y. Nakamura, N.M. Toksoz, A.M. Dainty, F.K. Dunnebier, A.R. Lazarewietz, R.L. Kovach, and T.C.D. Knight, “Seismology on Mars,”Journal of Geophysical Research82: 4524– 4546, 1977.
42. S.C. Solomon, D.L. Anderson, W.B. Banerdt, R.G. Butler, P.M. Davis, F.K. Duennebier, Y. Nakamura, E.A. Okal, and R.J. Phillips, Scientific Rationale and Requirements for a Global Seismic Network on Mars, LPI Technical Report 91-02, Lunar and Planetary Institute, Houston, Texas, 1990.


