
2
Characteristics of Underage Drinking
Alcohol is the most commonly used drug among America’s youth. More young people drink alcohol than smoke tobacco or use marijuana. And young people who drink tend to drink a lot. They have easy access to alcohol, largely from adults. Yet adults tend to underestimate the prevalence of underage drinking, fail to recognize the full range of negative consequences that can result, and assume that drinking is something that other children, not theirs, do (Institute of Medicine and National Research Council, 2001).
PATTERNS AND TRENDS
Despite minimum legal drinking age laws, actual drinking patterns in the United States suggest that almost all young people use alcohol before they are 21. Those who drink tend to drink much more heavily than adults. Biglan et al. (in press) estimate, based on the National Household Survey on Drug Abuse (NHSDA), that 91 percent of all drinks consumed by teenagers are consumed by those who drink heavily. In addition, the average age of first alcohol use has generally decreased since 1965, indicating that youth are starting to drink at a younger age (Substance Abuse and Mental Health Services Administration, 2003). This early onset and heavy use of alcohol poses serious concerns for healthy, unimpeded development.
According to 2002 Monitoring the Future (MTF) data, almost half (48.6 percent) of twelfth graders reported recent (within the past 30 days) alcohol use. Based on 2001 NHSDA data, more than one in four (28.5
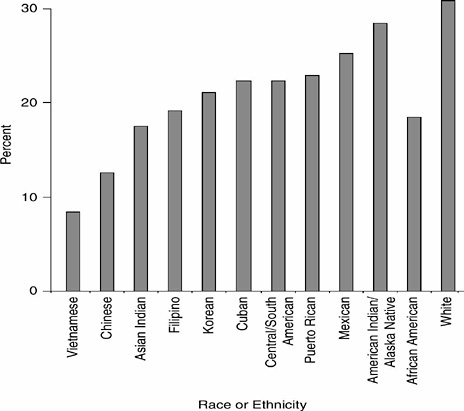
FIGURE 2-1 Past month alcohol use by 12- to 20-year-olds, by race or ethnicity: 1999-2000 annual averages.
SOURCE: NHSDA (2001).
percent) youth aged 12 to 20 have recently used alcohol. When disaggregated by racial and ethnic groups for that age group, whites reported the highest past month use of alcohol (30 percent), followed by American Indians and Alaska natives (28.4 percent), Mexican Americans (25.2 percent), and Puerto Ricans, Central and South Americans, and Cubans (22.9 percent, 22.3 percent, and 22.3 percent, respectively); see Figure 2-1.
Terminology
Multiple data sources—including the NHSDA, (now called the National Survey on Drug Use and Health), the Youth Risk Behavior Survey, and MTF—collect extensive information on the frequency and quantity of alcohol consumed (see Chapter 12 for additional discussion of these sur-
veys). To provide consistency and allow comparisons with adult consumption patterns, the majority of data presented in this report are drawn from the NHSDA.1 However, no measures of alcohol use or patterns of use have been universally accepted (Flewelling et al., 2004), and no common terminology is used to characterize different patterns of drinking (National Institute on Alcohol Abuse and Alcoholism, 2002). For example, having five or more drinks on the same occasion has been referred to as heavy drinking, heavy episodic drinking, and binge drinking. A report by the Substance Abuse and Mental Health Services Administration (SAMHSA, 2003) using NHSDA data, used binge drinking to refer to five or more drinks on one occasion and heavy drinking to refer to five or more drinks on at least 5 different days in the past 30 days. In the context of college drinking, binge drinking has been commonly used to refer to five or more drinks in a row for men and four or more drinks in a row for women. In other cases, binge drinking is referred to as 5 or more drinks in the last 30 days. Usage of other terms, such as heavy, frequent heavy, or heavy episodic drinking, are similarly inconsistent. For purposes of this report, the committee chose to use the terms “heavy drinking” and “frequent heavy drinking”: heavy drinking refers to five or more drinks on the same occasion in the past 30 days; frequent heavy drinking refers to five or more drinks on at least five occasions in the last 30 days.
Long-Term Trends
MTF data, available for 1975-2002, document that the prevalence of drinking among high school seniors peaked in the late 1970s and then decreased throughout the 1980s. Drinking rates have been relatively stable since then, with 30-day prevalence rates hovering at approximately 50 percent throughout the 1990s. The proportion of high school seniors who reported drinking in the last 30 days was the same in 2002 as it was in 1993 (48.6 percent). The proportion of seniors who reported having five or more drinks in that past 2 weeks was higher in 2002 (28.6 percent) than it was in 1993 (27.5 percent). Rates of annual drinking show a similar pattern, but the 2003 rates are slightly lower than they were in 1993; see Figure 2-2. Although there have been modest reductions in the 30-day and annual prevalence rates for the past 5 years, current rates are not significantly different than they were in 1993, and they remain high. Nearly half (48.6
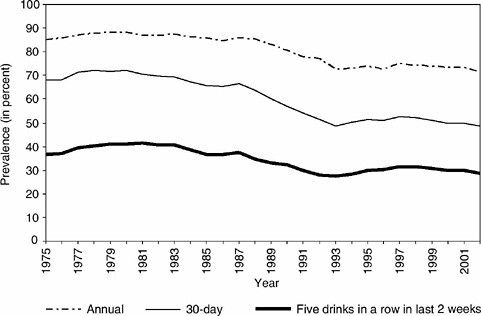
FIGURE 2-2 Long-term trends in prevalence of drinking among twelfth graders.
SOURCE: Data from the MTF online data tables.
percent) of high school seniors report drinking in the last 30 days—significantly more than the proportion of youth that report either using marijuana (21.5 percent) or smoking (26.7 percent) in the last 30 days.
NHSDA data indicate that the average age of self-reported first use of alcohol among individuals of all ages reporting any alcohol use decreased from 17.6 years to 15.9 years between 1965 and 1999. Recent studies also suggest that gender and some racial and ethnic differences are diminishing and that these groups with historically low drinking rates are moving toward the higher rates of non-Hispanic white males. Finally, while college surveys have indicated a decrease in overall drinking on college campuses over the past decade, there has been little change in heavy drinking (Wechsler et al., 2002a).
Overall Patterns
In 2000, about 9.7 million young people aged 12 to 20 had used alcohol in the past 30 days. Of these recent users, almost 6.6 million were heavy drinkers, and about 2.1 million were frequent heavy drinkers
(SAMHSA, 2003). Non-Hispanic white youth consistently report the highest prevalence of all types of drinking.
As shown in Table 2-1, underage drinkers of all ages are much more likely to drink heavily than are adults. Although drinking is very uncommon among 12- to 14-year-olds, even those in this group who drink are more likely to engage in heavy drinking than adults. With increasing age, more youth drink and more drinkers are heavy drinkers. By the ages of 18 to 20, the rate of any alcohol use in the last 30 days is identical with the rate for adults over 26, but among those who drink, the proportion of 18- to 20-year-olds who drink heavily is significantly higher than that of adults over 26. Rates of both any drinking and heavy drinking peak between ages 21 and 25, shortly after drinking has become legal.
Different patterns of adolescent alcohol use have been identified. Schulenberg and his colleagues used ten cohorts from the MTF study to identify six different trajectories for frequent drinking during late adolescence (Schulenberg et al., 1996). These included “chronic drinkers,” who drank heavily in high school and continued this pattern into young adulthood (12 percent of males and 3 percent of females); the “decreased” group, who drank heavily in high school, but reduced their amount of heavy drinking as they moved into adulthood (14 percent of males and 7 percent of females); the “fling” group, who had a low rate of heavy drinking in high school, a substantial increase between the ages of 21 and 22, and a low frequency by age 23 to 34 (9 percent of males and 10 percent of females); the “rare” group, who maintained a low level of heavy drinking in
TABLE 2-1 Drinking Patterns Among Adults and Youths (in percent)
|
|
Age |
||||
|
Drinking Pattern |
12-14 |
15-17 |
18-20 |
21-25 |
26+ |
|
Nondrinkers |
93 |
74 |
51 |
38 |
51 |
|
Drinkers |
|
||||
|
Alcohol use but no heavy drinking in past 30 days |
51 |
32 |
29 |
36 |
61 |
|
Heavy drinking in past 30 days |
42 |
49 |
45 |
44 |
29 |
|
Frequent heavy drinking in past 30 days |
8 |
19 |
26 |
21 |
10 |
|
SOURCE: Data from the 2000 NHSDA. |
|||||
high school and in young adulthood (15 percent of males and 18 percent of females); and the group who reported never drinking alcohol (24 percent of males and 45 percent of females). These data suggest that not all adolescents drink and that many who do drink in high school or college choose to drink less as they enter young adulthood, suggesting that both developmental and contextual factors contribute to alcohol consumption during adolescence.
Drinking Initiation
According to the most recent year that public NHSDA data on this topic are available, the average age of first use of alcohol among individuals of all ages reporting any alcohol use, based on the respondents’ recall of this information, has decreased from 17.6 years in 1965 to 15.9 years in 1999 (SAMHSA 2003).2 For 12- to 20-year-olds only, the average age of first use in 2000 is even younger—14 (Foster et al., 2003). According to Youth Risk Behavior Surveillance, United States, 2001 (Grunbaum et al., 2002), 33.7 percent of Latino youth were more likely to report drinking before age 13 than their white (28.4 percent) and African American (28.2 percent) counterparts; see Figure 2-3.
As discussed in Chapter 3, early onset is associated with a number of problematic consequences. For instance, individuals who begin drinking before the age of 15 are more likely to have substance abuse problems in their lifetimes, to engage in risky sexual behavior, and to suffer other negative consequences in comparison with those who begin drinking at a later age. However, we recognize that age of “first drink” may not be a good measure of age of onset of drinking.
How Youth Drink
Looking at data for youths, rather than just those who are drinkers, reveals similar patterns to those discussed above (see Figure 2-4): any recent use and heavy use progressively increases as youths approach the legal drinking age. Figure 2-4 also shows steady increases in frequent heavy drinking from ages 12 to 20.
Over 40 percent of 18-year-olds and a majority (56 percent) of 20-year-olds report having recently drunk alcohol. Although overall alcohol use is low for the youngest age group, almost one-half of the 12-year-olds who reported alcohol use reported having drunk heavily in the past 30 days. The
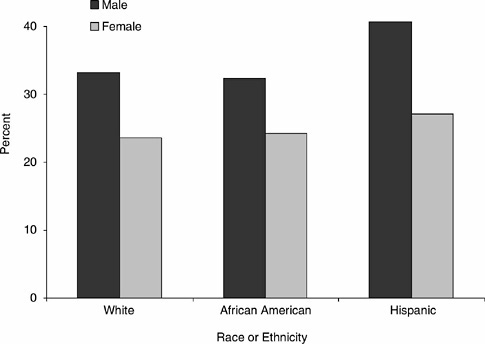
FIGURE 2-3 Students in grades 9-12 who initiated alcohol use before age 13 by sex and race or ethnicity.
SOURCE: Youth Risk Behavior Surveillance (2001, Table 26).
rate of heavy drinking doubles from age 14 (about 6 percent) to age 15 (about 12 percent) and continues to increase steadily. By age 18, more than 30 percent report heavy drinking, and at age 20 nearly 40 percent report heavy drinking. By ages 19 and 20 a full 70 percent of recent alcohol users engaged in heavy drinking.
Frequent heavy drinking also steadily increases for each age between 12 and 20. More than 10 percent of 18-year-olds and nearly 15 percent of 20-year-olds report frequent heavy drinking (Flewelling et al., 2004). When reported by race or ethnicity, white youths aged 12-20 have the highest reported rates of heavy drinking (21.4 percent), followed by American Indians and Alaska Natives (20.3 percent), Latinos (17.2 percent), African Americans (10.3 percent), and Asian Americans (7.9 percent) (SAMHSA, 2002). Data from MTF show somewhat different prevalence rates, but a similar pattern (see Table 2-2). Drinking prevalence increases as youth age, for lifetime use, use in the last 30 days, and five or more drinks in the past 2 weeks. As mentioned above, though MTF reports multiyear decreases in underage drinking (see Table 2-3) the rates remain disturbingly high. For
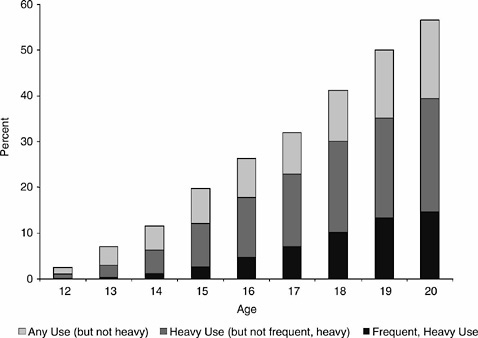
FIGURE 2-4 Prevalence of any use, heavy use, and frequent, heavy use of alcohol in the past 30 days, for youths aged 12 to 20, 2000.
SOURCE: Flewelling et al. (2004, Fig. 1).
example, despite continual decreases between 1996 and 2002 in lifetime use among junior high students (eighth graders), nearly one-half (47 percent) still report drinking in their lifetimes. Similarly, while the proportion of high school seniors who report having had five or more drinks in the past 2 weeks has decreased every year since 1998, nearly 30 percent (28.6) still report such use.
As drinking becomes legal, with the exception of 21- to 25-year-olds, the rate of heavy drinking and frequent, heavy drinking decreases substantially with increasing age (see Figure 2-5). In contrast, alcohol use that is not heavy (i.e., having fewer than five drinks on one occasion) increases and remains higher than that of underage drinkers until the age of 55. After their early 20s, adults begin to drink in a far more moderate manner than underage drinkers (SAMHSA, 2003).
TABLE 2-2 Drinking Prevalence Among Eighth, Tenth, and Twelfth Graders (in percent)
|
Prevalence |
8th Graders |
10th Graders |
12th Graders |
|
Lifetime |
47.0 |
66.9 |
78.4 |
|
Last 30 days |
19.6 |
35.4 |
48.6 |
|
Heavy Drinking* |
12.4 |
22.4 |
28.6 |
|
*Defined as five or more drinks in a row in the previous 2 weeks. SOURCE: Data from Johnston et al. (2003). |
|||
Overall Drinking Frequency
Although underage drinkers tend to consume alcohol more heavily than the majority of adults, they drink less frequently: 12- to 20-year-olds averaged about 6 drinking days per month, compared with slightly more than 8 days for adults (see Table 2-4). However, while adults drank less than three drinks in a day, young people reported that when they drink, they “usually” consume about four-and-a-half drinks. Again, the evidence shows that adults tend to drink fewer drinks per occasion than young people.
To examine differences more closely, the committee analyzed the same data by the number of days that current drinkers reported drinking heavily in the past month for different age groups (see Table 2-5). This more detailed analysis confirms the similar findings discussed above that drinking patterns for underage drinkers are notably different than those for the adult population. The number of drinks usually consumed on a single occasion is higher for 15- to 20-year-olds than for 21- to 25-year-olds, and is nearly double that of drinkers aged 26 and older. Underage drinkers do have far fewer drinking days than those aged 26 and older: 15- to 17-year-olds have 61 percent as many drinking days, and 18- to 20-year-olds have 80 percent as many drinking days as adults older than 26.
College Drinking Patterns
Much attention has been devoted to drinking on college campuses. A recent report from the National Institute on Alcohol Abuse and Alcoholism (NIAAA, 2002) cited data that about four in five college students drink and that, among these drinkers, about half engage in heavy drinking. A recent
TABLE 2-3 Prevalence Rates for Eighth, Tenth, and Twelfth Graders: 1993-2002 (in percent)
Harvard School of Public Health survey (Wechsler et al., 2002b) indicated that while the percentage of abstainers increased between 1993 and 2001, both frequent heavy drinking (defined as three or more times in the past two weeks) and drinking to intoxication also increased. Trends in college drinking over the last decade have found that the rate of self-reported heavy drinking has remained at approximately 44 percent (Wechsler et al., 2002a). Nearly half (48 percent) of all the alcohol consumed by students attending 4-year colleges is consumed by underage students (Wechsler et al., 2002b).
Multiple studies have indicated that the most likely individuals to report participation in heavy drinking are white, male, fraternity members, under the age of 24, involved in athletics, who do not hold strong religious beliefs and have a tendency to socialize a great deal (for example, cf. Wechsler et al., 2002a; Kellogg, 1999; Presley et al., 2002). However, clearly not all students fitting this profile drink, and not all drinkers share these characteristics.
Alcohol consumption rates increase significantly during the first year of college: this increased use has been attributed by some to adjustment
|
1997 |
1998 |
1999 |
2000 |
2001 |
2002 |
|
53.8 |
52.5 |
52.1 |
51.7 |
50.5 |
47.0 |
|
72.0 |
69.8 |
70.6 |
71.4 |
70.1 |
66.9 |
|
81.7 |
81.4 |
80.0 |
80.3 |
79.7 |
78.4 |
|
45.5 |
43.7 |
43.5 |
43.1 |
41.9 |
38.7 |
|
65.2 |
62.7 |
63.7 |
65.3 |
63.5 |
60.0 |
|
74.8 |
74.3 |
73.8 |
73.2 |
73.3 |
71.5 |
|
24.5 |
23.0 |
24.0 |
22.4 |
21.5 |
19.6 |
|
40.1 |
38.8 |
40.0 |
41.0 |
39.0 |
35.4 |
|
52.7 |
52.0 |
51.0 |
50.0 |
49.8 |
48.6 |
|
14.5 |
13.7 |
15.2 |
14.1 |
13.2 |
12.4 |
|
25.1 |
24.3 |
25.6 |
26.2 |
24.9 |
22.4 |
|
31.3 |
31.5 |
30.8 |
30.0 |
29.7 |
28.6 |
experiences that adolescents report during that first year (Kenny and Donaldson, 1991; Rice, 1992; Brooks and DuBois, 1995). The first 6 weeks of the school year have been cited as the most dangerous with respect to drinking behavior due to the increased stress levels associated with a new environment and the pressure to be accepted by a peer group (Prendergast, 1994; Werch et al., 2000; Carlson et al., 2001).
According to data from the 2000 NHSDA, 41 percent of full-time college students aged 18 to 22 engaged in heavy drinking, compared with 36 percent of young adults who were attending college part time or not at all (see Table 2-6). This difference in drinking behavior by college enrollment status was greatest among 19- and 20-year-olds. The highest rates of heavy drinking occurred for both groups at age 21, and the gap between full-time students and other young adults began to close. By age 22, the percentage of heavy drinkers subsided for both groups, although full-time college students still engaged in this behavior more often than other young adults.
There is, however, some evidence to suggest that the key variable may
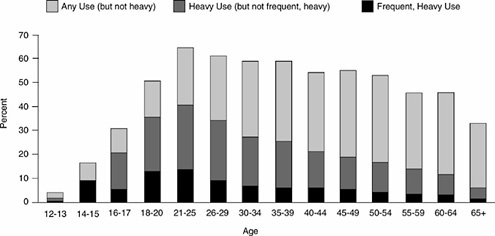
TABLE 2-4 Drinking Frequency and Intensity for Youths and Adults (current drinkers only)
|
|
Age |
|
|
Frequency and Intensity |
12-20 |
21 and older |
|
Mean number of drinking days per month |
5.79 (6.03) |
8.02 (8.32) |
|
Mean number of “usual” drinks on a drinking day* |
4.48 (2.75) |
2.78 (2.07) |
|
*If respondents indicated that their usual number of drinks per occasion was some number greater than 12, that response was recoded as “missing.” Missing values were imputed, using means for the same sex and age group. NOTE: Standard deviations in parentheses. SOURCE: Data from the 2000 NHSDA. |
||
TABLE 2-5 Drinking Patterns for Youth and Adults (current drinkers only)
be type of housing rather than college enrollment. Using data from the National Longitudinal Survey of Youth, Cook and Moore (2001) found that being in school actually reduced drinking and heavy drinking. The group with the highest prevalence of heavy drinking, other things equal,
TABLE 2-6 Past Month Heavy Drinking Among 18- to 22-Year-Olds by College Enrollment Status (in percent)
|
Age |
Full-Time College Students |
Other Young Adults |
Difference Between Students and Others |
|
18 |
33.8 |
29.8 |
4.0 |
|
19 |
39.1 |
31.7 |
9.3 |
|
20 |
42.9 |
35.6 |
7.3 |
|
21 |
48.0 |
43.7 |
4.3 |
|
22 |
44.8 |
40.7 |
4.1 |
|
Average, 18-22 |
41.4 |
35.9 |
5.5 |
|
SOURCE: Data from SAMHSA (2002). |
|||
were those living in a dormitory or fraternity house. Bachman et al. (1997) have found a similar “dormitory effect.”
Race and Ethnicity
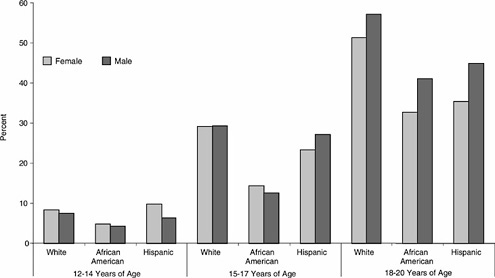
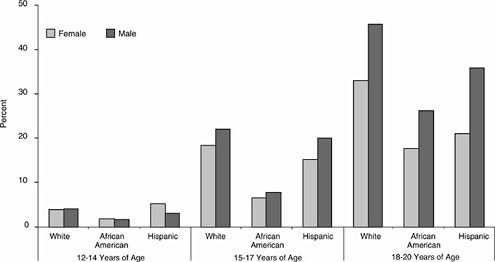
In general, drinking among racial and ethnic minorities is lower than among whites, and there is a great deal of variability across racial and ethnic groups. Among youths aged 12 to 20, drinking of all types (recent, heavy, frequent heavy) is highest for non-Hispanic whites, followed closely by Native Americans. Asian Americans and African Americans have the lowest prevalence of any racial or ethnic group. Hispanics and youth of multiple races fall about midway between the highest and lowest rates (Flewelling et al., 2004). For the 12- to 20-year-old population as a whole, the prevalence of alcohol use and heavy alcohol use increases among various racial and ethnic groups as they approach the legal drinking age (see Figures 2-6 and 2-7). “Due to sample size limitations, finer breakdowns by age groups and gender within the underage [whites, Hispanics, African Americans] population was only possible for the three major racial/ethnic groups” (Flewelling et al., 2004). This pattern holds for all three age groups and racial and ethnic groups.
Ethnic minorities consistently have lower rates of alcohol use than non-Hispanic whites, although it is unclear whether reporting bias contributes to these differences. Trend analysis of data from the Alcohol Research Group’s National Alcohol Surveys showed that while rates of heavy drinking among 18- to 29-year-olds dropped between 1984 and 1995, rates among African American males remained the same (Caetano and Clark, 1998). This suggests the need to further explore explanations for racial and ethnic differences in drinking rates.
Gender
Alcohol use varies by gender as well as ethnicity. In the past, boys have consumed alcohol at notably higher rates than girls (National Center on Addiction and Substance Abuse [CASA], 2003). Unfortunately, this particular gender gap, most notably for younger children, appears to be closing. As of 2000, the prevalence of alcohol use among boys and girls aged 12 to 14 and 15 to 17 were within a few percentage points of each other (see Figure 2-6). Girls aged 12 to 14 in all three racial and ethnic groups, but most notably Hispanic girls, are actually more likely than boys to have used alcohol in the past 30 days—9.8 percent of Hispanic females, 8.3 percent of non-Hispanic white females, and 4.8 percent of African American females (see Figure 2-7). These rates compare with 6.3 percent of Hispanic males, 7.5 percent of non-Hispanic white males, and 4.2 percent of African American males. Clearly, a greater number of girls are initiating alcohol use at a younger age than boys. African American girls aged 15 to 17 also tend to drink more than African American boys of the same age. Among 18- to 20-year-olds, boys drink more than girls across the three racial and ethnic groups. However, the gap between boys and girls in each group is relatively small (see Figures 2-6 and 2-7)—for non-Hispanic whites the difference in any alcohol use in the past 30 days for 18- to 20-year-olds is 5.9 percent, 9.5 percent for Hispanics, and 8.4 percent for African Americans (with the exception of 12- to 14-year-olds). Males do consistently report engaging in heavy drinking at a higher rate than females.
In general, the differences between girls and boys is greater for heavy drinking than for recent use: for example, non-Hispanic white males aged 18 to 20 have a 13 percent higher prevalence for heavy drinking than non-Hispanic white females, compared to a 5.9 difference for any recent use. Similar patterns are observed in Hispanics and African Americans—Hispanic males have a 14.9 percent higher prevalence and African American males have an 8.6 percent higher prevalence for heavy drinking compared to their female counterparts. Males also have a higher prevalence of frequent heavy drinking than females: for example, more than 20 percent of non-Hispanic white males aged 18 to 20 are frequent heavy drinkers, compared with about 10 percent of non-Hispanic white females in this age group (Flewelling et al., 2004).
When considering these differences, however, we should be mindful of the biological differences between women and men that result in women processing alcohol more slowly. From a physiological perspective, five drinks is substantially more alcohol for a young female than a young male (NIAAA, 1990). As a result, women may be drinking somewhat less, but given their size and body weight, still drinking heavily. Acknowledging differences in body composition and alcohol metabolism, recent measures
of heavy drinking on college campuses modify the definition for women to four rather than five drinks in a row. Recent studies using this modified measure have reported increased rates of heavy drinking among women on college campuses; this may suggest that gender differences in heavy drinking are also beginning to erode (Wechsler et al., 2002).
Summary
Several generalizations about underage drinking emerge from these data. Substantial numbers of 12- to 14-year-olds are using alcohol, and more girls than boys are having their first drink at this age. When adolescents and young adults do drink, they generally do not drink often as adults, but they drink more heavily. Variation in prevalence and drinking patterns are found by ethnicity and gender: racial and ethnic minorities tend to have a lower prevalence than non-Hispanic whites, and although the gender gap appears to be eroding, older females (18 to 20 years) tend to have a lower prevalence than males.
While it is encouraging that racial and ethnic minority youth as a whole have lower rates of alcohol use than non-Hispanic white youth, it is notable to mention that alcohol abuse and alcohol-related problems affect these communities to varying degrees. While Asian American youth as a whole tend to have lower rates of alcohol use than other youth, specific subgroups (Koreans, 21.1 percent; Filipinos, 19.1 percent; and Asian Indians, 17.5 percent) report similar rates of past month use as some Latino subgroups (Central or South American, 22.3 percent; Cuban, 22.3 percent) and African American youth (18.5 percent) (NHSDA, 2001). Moreover, for youth aged 12 to 17, nearly one-third of all Filipinos (29.5 percent) and a quarter of all Koreans (24.9 percent) reported alcohol use within the past year (NHSDA, 2001). By ignoring the differences that occur both across and within youth subgroups, misperceptions about alcohol use among certain groups may lead to incorrect views of actual need.
It is also important to consider acculturation experiences as they affect drinking behavior. Research has shown that while newly arrived immigrants have lower rates of alcohol use, consumption and more liberal attitudes toward drinking increase as individuals become more acculturated (NIAAA, 1994; National Women’s Health Information Center, 2002). This trend has serious implications for many minority communities as subsequent generations reside in the United States for longer periods of time.
OVERALL CONSUMPTION LEVELS
Efforts to estimate the proportion of alcohol consumed by underage drinkers have been bedeviled by the imprecision of quantity questions in
drinking surveys and by concerns about the differing prevalence rates that result from the three major national surveys, with the NHSDA consistently reporting the lowest prevalence. The most recent and prominent effort, by Foster et al. (2003), used the NHSDA data to estimate the number of drinks consumed during the previous 30 days by current drinkers, based on multiplying together answers to questions on the number of drinking days during that period, and on how many drinks the respondent “usually” had on a drinking day.3 But NHSDA data were not used to estimate the participation rates—the proportions of the youth and adult populations that were current drinkers. Instead, the authors chose to use the Youth Risk Behavior Survey (YRBS) of the Centers for Disease Control and Prevention to estimate the proportion of underage individuals (12 to 20) who were current drinkers, and the Behavioral Risk Factor Surveillance Survey to estimate the proportion of adults who were current drinkers. These estimated participation rates were then combined with the NHSDA data on average drinks per current drinker to estimate the total amounts of alcohol consumed by youths and adults. The authors (Foster et al., 2003) calculated that underage individuals consumed 19.7 percent of the total number of drinks consumed in the United States in 1999, amounting to more than 830.6 million drinks per month. It is easy to find fault with the procedure adopted by Foster et al. (2003), but it is nonetheless not clear a priori whether the estimate is high, low, or about right. Three problems may be especially important. First, the average number of drinks consumed on drinking occasions is not well captured by the NHSDA item, which asks about the usual number of drinks. For example, a respondent who drinks a beer with supper every night and an additional six-pack on Saturday nights will “usually” drink one drink per occasion, but will drink an average of two drinks per occasion (14 for the week, divided by 7 days). What is not known is how each respondent interpreted this question and whether he or she then answered one or two drinks or something else. Whether this problem is greater for underage or adult drinkers is not clear, so the possible bias in the Foster et al. estimate could be either positive or negative.
Second, the YBRS does not seem well suited for estimating the participation rate for all youth aged 12 to 20 because the YRBS sampling frame is limited to youth aged 12 to 18 who are in school. Unlike the NHSDA, dropouts and older youths are not included in the YRBS. If the omitted groups have a higher drinking participation rate, as seems reasonable, then
the YRBS estimate will tend to underestimate the youth participation rate, and hence underestimate the bottom line.
Third, since the prevalence rates for NHSDA youth respondents are substantially lower than for YRBS respondents and since NHSDA conducts household-based interviews only when a parent is in the home, Foster et al. (2003, p. 990) assert, reasonably enough, that “the accuracy of the responses may be suspect.” In contrast, YRBS is conducted in schools. But if, as also seems reasonable, current drinkers who deny drinking in the NHSDA interview also tend to drink less than average, then these youths will be excluded from the calculation (since they have denied drinking) of the average number of drinks per self-admitted drinker and the average may be too high. (There is no analogous problem with the adult estimates.) The effect would be an overestimate.
Unfortunately, the estimate of the underage share of alcohol consumption is very sensitive to the procedure used. The somewhat elaborate procedure preferred by Foster et al. (2003) produces an estimate of about 20 percent. The more straightforward procedure of using the NHSDA data for estimating not only average quantity of drinks per drinker, but also the participation rates, produces an estimate of 10.8 percent for 2000.4 Based on their preferred quantity estimates, the researchers then estimate the expenditures made by underage drinkers for beer, spirits, and wine. They conclude that underage drinkers spent $22.5 billion, representing 19.4 percent of total consumer expenditures for alcohol (slightly lower than the proportion of consumption because youths are more likely to consume beer, a lower priced beverage).
The procedure used by Foster et al. (2003) does not account for the differences in the average prices paid by underage youths and adults. It seems likely that youths pay less because they are less likely than adults to buy their drinks at bars or restaurants and because they may drink lower quality beverages. Unfortunately, there are no systematic data on prices paid by age. Given these problems, there is a good deal of uncertainty about the shares of total quantity consumed and total expenditures accounted for by underage drinkers. Is the true share of quantity nearer the 20 percent estimate preferred by Foster et al. based on combining selected statistics from three different surveys, or the 11 percent estimate using only the NHSDA survey data? Is it reasonable to assume (as do Foster et al.) that
underage drinkers pay the same amount for beer or other beverages as adult drinkers or that youths tend to drink more cheaply? Current data sources do not provide reliable answers to these questions, and there is a wide range of plausible possibilities. The committee concludes that one can only say that underage youths consume in the range of 10 to 20 percent of all drinks and account for a somewhat lower, albeit still substantial, percentage of total expenditures.
CONTEXTS OF UNDERAGE DRINKING
It is apparently not difficult for youth who want to drink to readily obtain alcohol. A majority of high school students, even eighth graders, report that alcohol is “fairly easy” or “very easy” to get, with the proportion increasing from eighth to tenth to twelfth grade. Although the proportion of eighth graders who report that alcohol is fairly easy or very easy to get has decreased over the past decade, it remains more than 60 percent. For twelfth graders, the percentage is more than 90 percent (Johnston et al., 2003).
The alcohol most favored by underage drinkers is beer. Based on 2000 MTF data, high school seniors, more than one-half of males and more than one-third of females drank beer in the past 30 days. Liquor (the term used in MTF) was a close second—41.7 and 30.7 percent of males and females, respectively—with far fewer drinking wine and wine coolers.5 Among those who reported heavy drinking, a similar pattern is found (see Figure 2-8). However, there are differences by beverage types in the relative proportion of heavy drinkers. Most beer and liquor drinkers also tend to be heavy drinkers, particularly boys. This relationship is much weaker for wine and wine coolers (Flewelling et al., 2004). Although it is reasonable to assume that youth drink beer more often than adults, data comparable to the above are not available for adults.
Young people drink in a variety of locations and situations. Drinking at one’s own home, friends’ homes, outdoors, and in cars or other vehicles are the most commonly reported drinking contexts for young people. For example, survey data from high school seniors in Minnesota indicate that 38 percent of drinkers reported drinking in their own home, 83 percent drinking at another person’s home, 22 percent in a bar or restaurant, 46 percent outdoors, 7 percent at work, and 41 percent in a moving car or vehicle (Lee et al., 1997). Similarly, for 15- to 20-year-old drinkers in a recent survey in
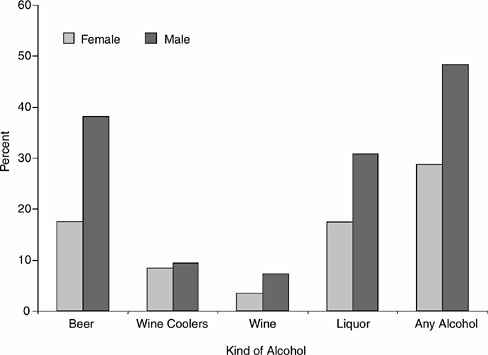
FIGURE 2-8 Kind of alcohol consumed by high school seniors who are heavy drinkers, by gender.
NOTE: Heavy drinkers consumed five or more drinks in a row during the past 2 weeks.
SOURCE: Flewelling et al. (2004, Fig. 5).
California (Table 2-7), parties and outdoor venues were the most frequently reported drinking locations during the past year followed by cars (Walker et al., 2001). In this same survey, drinking in bars and restaurants was rare among younger adolescents, but increased substantially with age. Some studies suggest that drinking in supervised settings (i.e., at home with parent present) decreases with age, while drinking in unsupervised settings (i.e., parties, cars, and outdoors) increases with age (Harford, 1984). For young people, drinking in friends’ homes, bars, parties, cars, and parking lots and other outdoor locations is related to higher frequency of intoxication, drinking and driving, and riding with drinking drivers than drinking in the home (Jones-Webb et al., 1997; Lee et al., 1997; Snow and Landrum, 1986; Walker et al., 2001).


